Logotipo de Revista Mexicana de Fitopatología

Mexican Journal
of Phytopathology

Logotipo Sociedad Mexicana de Fitopatología A.C.

Article filters

Search Papers

Searches prior to 2023, No. 3. In the section Volumes 30 - 41 (2012 - 2023).

Latest Papers

  • Vol. 2025, 43(2)
  • Scientific Article

Cloning, expression, and serological detection of the putative RNA polymerase of Papaya meleira virus Mexican variant in Escherichia coli

byWendy Serra, Jeanin A. Arguelles Quintal, Mildred Carrillo Pech, Alethia F. Toriz, Enrique Castaño, Ignacio Islas Flores, Luisa A. Lopez Ochoa*

Received: 01/May/2024 – Published: 30/April/2025DOI: https://doi.org/10.18781/R.MEX.FIT.2405-00

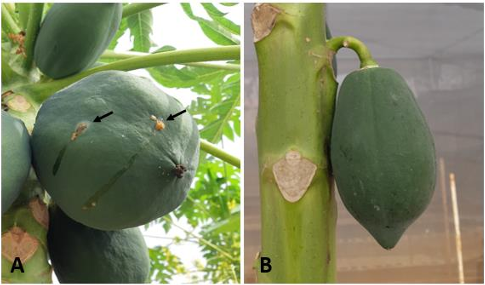
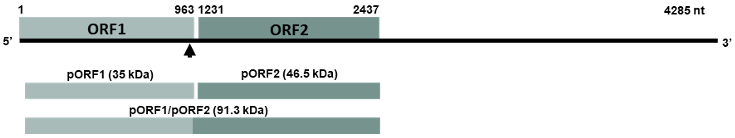
Abstract Background/Objective. Papaya meleira disease in Mexico is associated to Papaya meleira virus Mexican variant (PMeV-Mx) and is characterized by the spontaneous exudation of latex in fruits. PMeV-Mx ORF2 encodes a protein with RNA-dependent RNA polymerase (RdRp) motifs, which is essential for viral replication. This study aimed to develop a method for producing and purifying recombinant PMeV-Mx ORF2 encoded protein (pORF2) in E. coli and generate specific antibodies for its detection.

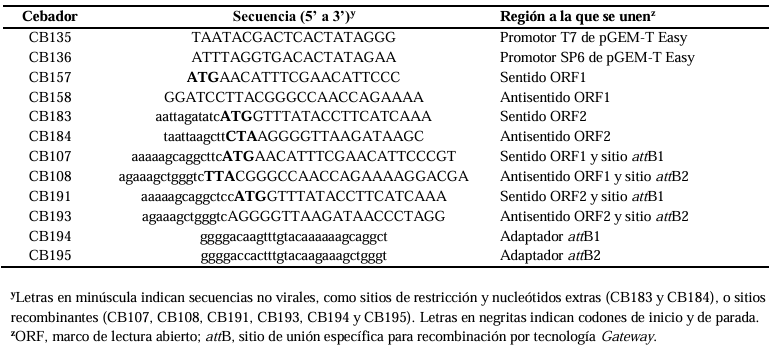
Materials and Methods. The PMeV-Mx genome was analyzed using UGENE to predict ORFs and identify the putative slippery site. ORF1 and ORF2 were amplified by PCR from cDNA obtained from infected papaya latex, cloned into pGEM-T Easy, and subsequently transferred into pDONR221 and pDEST17 for expression in E. coli. Recombinant 6xHis-pORF2 was expressed in E. coli BL21 strain, induced with IPTG, and purified under denaturing conditions. The purified protein was used to generate polyclonal antibodies, with immunizations conducted at different time points. Antisera specificity and optimal working dilutions were evaluated by immunodetection assays, using recombinant 6xHis-pORF2 as the target and His-tagged proteins as negative controls. Additionally, papaya plants were inoculated with latex from symptomatic fruits as virus reservoir and PMeV-Mx infection was confirmed by RT-PCR.

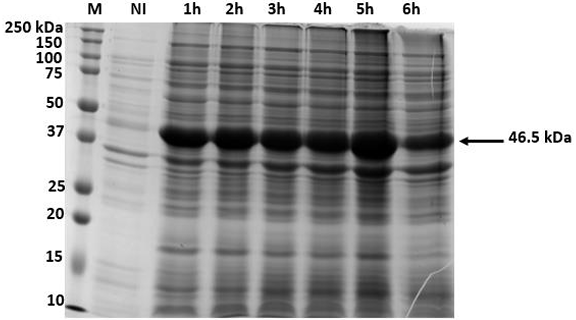
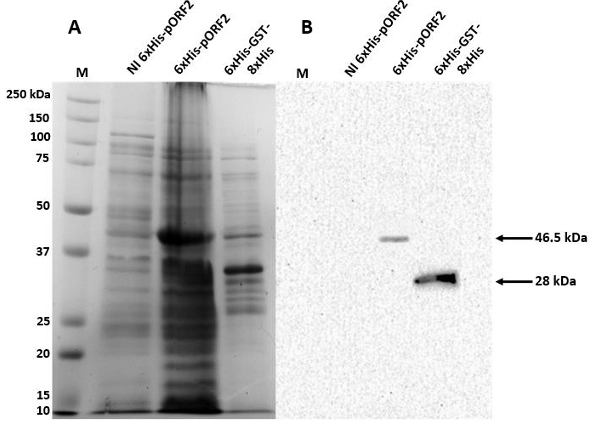
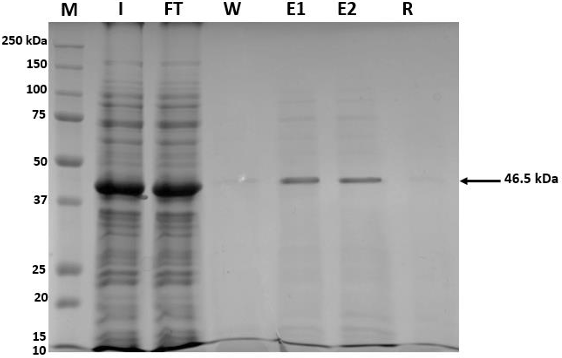
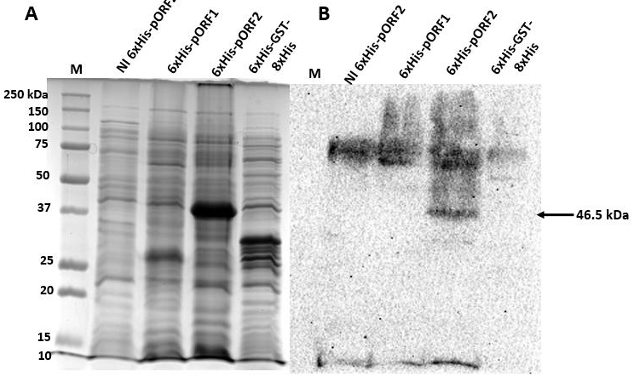
Results. The recombinant 6xHis-pORF2 protein of PMeV-Mx was expressed in E. coli and purified. A ~46.5 kDa band was detected, consistent with its estimated molecular weight. The protein expression increased between 2- and 6-hours post-induction with IPTG. Western blot analysis confirmed the presence of the His tag and the integrity of the recombinant protein. Purification using Ni-NTA resin resulted in a strong ~46.5 kDa band along with light bands ranging from 15 to 150 kDa. Polyclonal antibodies against pORF2 were generated and specifically recognized the purified protein in immunoassays, with detection observed at dilutions from 1:500 to 1:3000. No cross-reactivity was observed with negative controls, but a non-specific ~75 kDa band was detected in E. coli extracts.

Conclusion. A protocol for expressing, detecting, and purifying the recombinant 6xHis-pORF2 protein from PMeV-Mx in E. coli was established. Rabbit polyclonal antibodies recognized the target protein in bacterial fractions, though further optimization is needed to enhance specificity. These antibodies will support future diagnostic development and protein characterization in plants.

Show Figures and/or Tables
Table 1. Primers used TO clone PMeV-Mx ORF1 AND ORF2 IN pDEST17 vector, TO generate plasmids pCB252 AND pCB253, respectively.
Figure 1. Fruits of <em>Carica papaya</em> cv. Maradol plants grown in the screen house. A) Papaya fruits infected with PMeV-Mx showing the typical meleira disease symptom of spontaneous latex exudation. B) Fruit of mock-inoculated papayas (Healthy).
Figure 1. Fruits of Carica papaya cv. Maradol plants grown in the screen house. A) Papaya fruits infected with PMeV-Mx showing the typical meleira disease symptom of spontaneous latex exudation. B) Fruit of mock-inoculated papayas (Healthy).
Figure 2. Genomic organization of PMeV-Mx. Numbers indicate the nucleotide (nt) positions and the total number of nt in the genome. Solid boxes in the genome represent ORF1 and ORF2, respectively. Solid boxes below indicate the putative proteins, product of ORF1 and ORF2 (pORF1 and pORF2, respectively) and the putative fusion product of -1 ribosomal frameshifting (pORF1/pORF2). The arrow indicates the position of the heptanucleotide.
Figure 3. Time course of PMeV-Mx 6xHis-pORF2 expression using insoluble crude <em>E. coli</em> lysate to establish the optimal induction period for expression. Expression of 6xHis-pORF2 was induced with 1 mM IPTG, at 37 ºC. Aliquots were removed at the times indicated (1 to 6 h after IPTG induction) and proteins were visualized by Coomassie-stained SDS gel. M, Bio-Rad 10-250 kDa marker; NI, non-induced control. The arrow indicates the 46.5 kDa 6xHis-pORF2 protein.
Figure 3. Time course of PMeV-Mx 6xHis-pORF2 expression using insoluble crude E. coli lysate to establish the optimal induction period for expression. Expression of 6xHis-pORF2 was induced with 1 mM IPTG, at 37 ºC. Aliquots were removed at the times indicated (1 to 6 h after IPTG induction) and proteins were visualized by Coomassie-stained SDS gel. M, Bio-Rad 10-250 kDa marker; NI, non-induced control. The arrow indicates the 46.5 kDa 6xHis-pORF2 protein.
Figure 4. Detection of PMeV-Mx 6xHis-pORF2 in <em>E. coli</em> crude lysates by monoclonal anti-His antibodies. A) Coomassie stained SDS gel. B) Western blot in PVDF membranes incubated with a 1:1000 dilution of the anti-His tag monoclonal antibody coupled to horseradish peroxidase (HRP). M, Bio-Rad 10-250 kDa marker; NI and 6xHis GST-8xHis, non-induced and positive controls, respectively; 6xHis-pORF2, cellular fraction with recombinant PMeV-Mx pORF2 expressed in BL21 cells. The arrows indicate the 46.5 kDa 6xHis-pORF2 and the 28 kDa 6xHis GST-8xHis proteins, respectively.
Figure 4. Detection of PMeV-Mx 6xHis-pORF2 in E. coli crude lysates by monoclonal anti-His antibodies. A) Coomassie stained SDS gel. B) Western blot in PVDF membranes incubated with a 1:1000 dilution of the anti-His tag monoclonal antibody coupled to horseradish peroxidase (HRP). M, Bio-Rad 10-250 kDa marker; NI and 6xHis GST-8xHis, non-induced and positive controls, respectively; 6xHis-pORF2, cellular fraction with recombinant PMeV-Mx pORF2 expressed in BL21 cells. The arrows indicate the 46.5 kDa 6xHis-pORF2 and the 28 kDa 6xHis GST-8xHis proteins, respectively.
Figure 5. Purification of PMeV-Mx 6xHis-pORF2 with Ni-NTA Agarose under denaturing conditions. M, Bio-Rad 10-250 kDa marker; I, <em>input</em>; Ft, <em>flow-through</em>; E1 and E2, first and second eluates, respectively; R, resin. The arrow indicates the 46.5 kDa 6xHis-pORF2 protein.
Figure 5. Purification of PMeV-Mx 6xHis-pORF2 with Ni-NTA Agarose under denaturing conditions. M, Bio-Rad 10-250 kDa marker; I, input; Ft, flow-through; E1 and E2, first and second eluates, respectively; R, resin. The arrow indicates the 46.5 kDa 6xHis-pORF2 protein.
Figure 6. Detection of PMeV-Mx 6xHis-pORF2 in <em>E. coli</em> crude lysate with anti-pORF2 antibodies. A) Coomassie-stained SDS gel. B) Western blot (Nitrocellulose membrane) incubated with the anti- PMeV-Mx pORF2 polyclonal antibody (dilution 1:1000), and the anti-rabbit coupled to horseradish peroxidase (HRP) secondary antibody (dilution 1:3000). M, Bio-Rad 10-250 kDa marker; NI, non-induced cellular fraction. 6xHis-pORF1 and 6xHis GST-8xHis were used as negative controls. The arrow indicates the 46.5 kDa 6xHis-ORF2 protein.
Figure 6. Detection of PMeV-Mx 6xHis-pORF2 in E. coli crude lysate with anti-pORF2 antibodies. A) Coomassie-stained SDS gel. B) Western blot (Nitrocellulose membrane) incubated with the anti- PMeV-Mx pORF2 polyclonal antibody (dilution 1:1000), and the anti-rabbit coupled to horseradish peroxidase (HRP) secondary antibody (dilution 1:3000). M, Bio-Rad 10-250 kDa marker; NI, non-induced cellular fraction. 6xHis-pORF1 and 6xHis GST-8xHis were used as negative controls. The arrow indicates the 46.5 kDa 6xHis-ORF2 protein.
  • Vol. 2025, 43(2)
  • Phytopathological note

First report of Fusarium sulawesiensis (FIESC 16) and Fusarium pernambucanum (FIESC 17) as causal agents of blight in roselle (Hibiscus sabdariffa) calyces in Mexico

byCandelario Ortega Acosta, Daniel Leobardo Ochoa Martínez*, Santo Ángel Ortega Acosta, Javier Hernández Morales, Francisco Palemón Alberto

Received: 28/February/2025 – Published: 30/April/2025DOI: https://doi.org/10.18781/R.MEX.FIT.2502-1

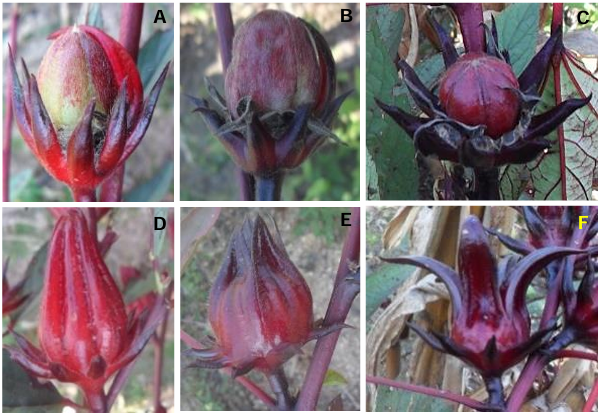
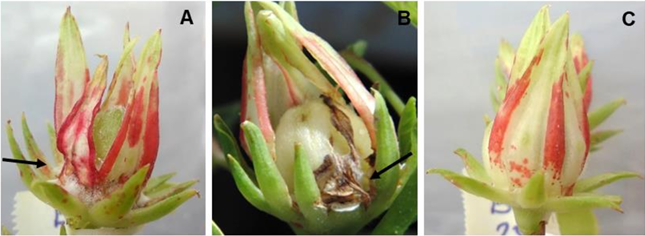
Abstract Background/Objective. In the roselle (Hibiscus sabdariffa) producing area of the state of Guerrero, Mexico, plantations with a high incidence of calyx blight were detected. The aim of this study was to know the causal agent of this disease.

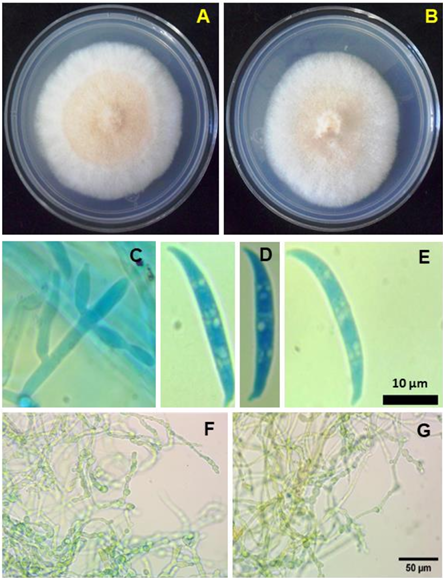
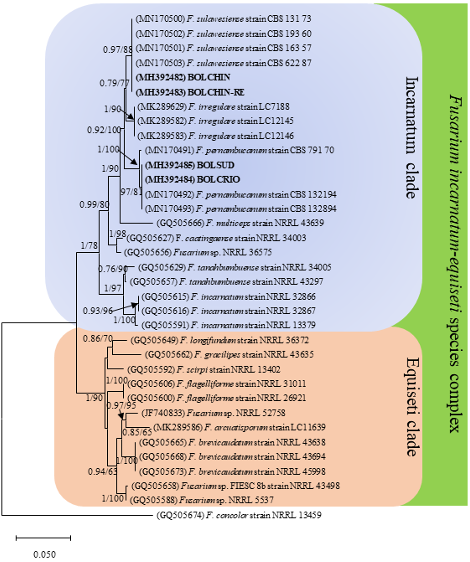
Materials and Methods. Calyces with and without symptoms of the “Criolla de Guerrero”, “Sudán” and “China Negra” cultivars were gathered from the municipal areas of Ayutla and Tecoanapa, Guerrero. Out of the calyces with symptoms, different fungal strains were isolated, out of which two were selected to perform pathogenicity tests under greenhouse conditions and identified with the amplification and sequencing of the elongation factor -1α (EF-1α) with the primers EF1-728F/EF1-986R.

Results and discussion. The sequences obtained were compared with the ones in the NCBI and Fusarium MLST databases and they corresponded with the Fusarium incarnatum-equiseti (FIESC) 16 and 17 species complexes, currently known as Fusarium sulawesiensis and Fusarium pernambucanum, respectively. In the pathogenicity tests, the inoculated strains induced similar symptoms to those observed in the field. The FIESC complex has been proven to produce the mycotoxin trichothecene. Therefore, studies to determine the presence of this toxin in roselle are required, considering that its main use is the preparation of refreshing beverages, which may be a health risk.

Conclusion. This is the first report of Fusarium sulawesiensis and Fusarium pernambucanum as causal agents of the roselle calyx blight in Mexico and in the world.

Show Figures and/or Tables
Figure 1. Symptoms of calyx blight in the three roselle cultivars; it can be observed that the capsule is exposed due to the blighting of the calyces; A. “Criolla de Guerrero”. B. “China Negra”. C. “Sudán”. Asymptomatic calyces of the different cultivars; D. “Criolla de Guerrero”, E= “China Negra” and F= “Sudán”.
Figure 2. Morphological species of the <em>Fusarium</em> <em>incarnatum</em>-<em>equiseti</em> species complex. A-B = Colonies grown in PDA for one week at 28 °C. A = <em>F. sulawesiensis</em> isolate BOLCHIN. B = F. pernambucanum isolate BOLCRIO. C = Monophialids from the isolate BOLCHIN. D and E = Macroconidia with a foot-shaped <em>F. sulawesiensis</em> and <em>F. pernambucanum</em> basal cells, respectively. F and G = <em>F. sulawesiensis</em> and <em>F. pernambucanum</em>, chain chlamidospores, respectively.
Figure 2. Morphological species of the Fusarium incarnatum-equiseti species complex. A-B = Colonies grown in PDA for one week at 28 °C. A = F. sulawesiensis isolate BOLCHIN. B = F. pernambucanum isolate BOLCRIO. C = Monophialids from the isolate BOLCHIN. D and E = Macroconidia with a foot-shaped F. sulawesiensis and F. pernambucanum basal cells, respectively. F and G = F. sulawesiensis and F. pernambucanum, chain chlamidospores, respectively.
Figure 3. Maximum likelihood (ML) tree, from the <em>Fusarium incarnatum-equiseti</em> species complex, from partial gene EF-1α. A similar topology was generated using Bayesian Inference (BI). Subsequent Bayesian probabilities (PP> 0.5) and the Bootstrap support values (BS> 50) are shown in the nodes (PP/BS). The sequences of this study are in bold. The scale bar indicates the number of expected changes per site. *<em>F. sulawesiense</em> currently recognized as <em>F. sulawesiensis</em> (Xia <em>et al</em>., 2019).
Figure 3. Maximum likelihood (ML) tree, from the Fusarium incarnatum-equiseti species complex, from partial gene EF-1α. A similar topology was generated using Bayesian Inference (BI). Subsequent Bayesian probabilities (PP> 0.5) and the Bootstrap support values (BS> 50) are shown in the nodes (PP/BS). The sequences of this study are in bold. The scale bar indicates the number of expected changes per site. *F. sulawesiense currently recognized as F. sulawesiensis (Xia et al., 2019).
Figure 4. Pathogenicity tests in roselle calyces 12 days after artificial inoculation under greenhouse conditions. A= <em>F. sulawesiensis</em> isolate BOLCHIN. B= <em>F. pernambucanum</em> isolate BOLCRIO. C=Calyx in which only the basal part was injured with a sterile toothpick.
Figure 4. Pathogenicity tests in roselle calyces 12 days after artificial inoculation under greenhouse conditions. A= F. sulawesiensis isolate BOLCHIN. B= F. pernambucanum isolate BOLCRIO. C=Calyx in which only the basal part was injured with a sterile toothpick.
  • Vol. 2025, 43(2)
  • Phytopathological note

Morphological and molecular characterization of Fusarium incarnatum associated to the malformation of mango (Mangifera indica) in Sinaloa, Mexico

byLeonardo Román Román, Tomás Aarón Vega Gutiérrez, Martín Abraham Tirado Ramírez, Luz Llarely Cázarez Flores, Lorena Molina Cárdenas*, Indira Rojo Báez

Received: 01/July/2024 – Published: 29/April/2025DOI: https://doi.org/10.18781/R.MEX.FIT.2407-1

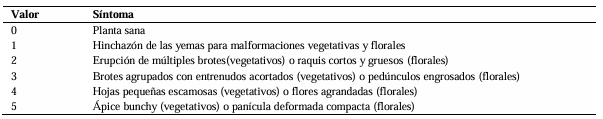
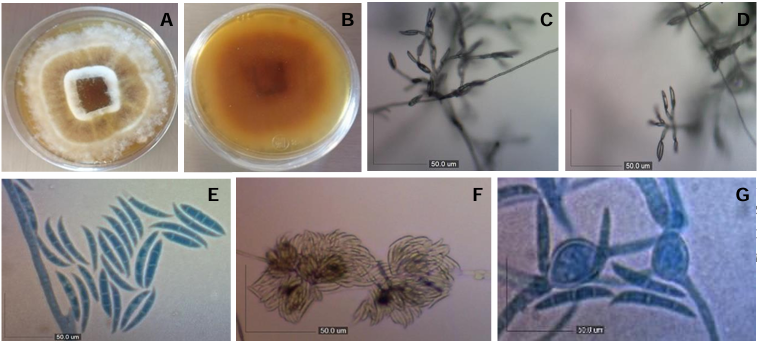
Abstract Background/Objective. The malformation in mango is one of the main diseases to attack this crop, and therefore limits its worldwide production. The aim of this study was to identify, morphologically and molecularly, the phytopathogen associated to the malformation of mango in Sinaloa, Mexico.

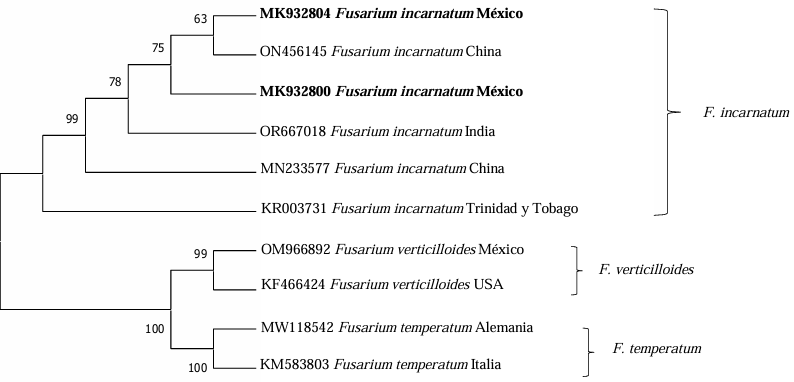
Materials and methods. In 2018, samples showing malformation symptoms, such as compacted panicles and the eruption of multiple vegetative shoots, were collected from mango orchards in Sinaloa. Based on morphological characteristics, the isolates were identified as Fusarium incarnatum. The molecular identification was carried out by amplifying the partial sequence of the elongation factor gene (TEF-1α) and conducting a phylogenetic analysis. Pathogenicity tests were performed on mango plants through artificial inoculation.

Results. Symptoms on the inoculated plants were observed seven weeks after inoculation, with a disease severity scale rating between 2 and 4; no symptoms were observed in the control plants. The pathogen was re-isolated from symptomatic tissue and identified based on morphology, thus fulfilling Koch’s postulates.

Conclusion. Fusarium incarnatum is repored for the first time as associated with mango malformation in Sinaloa, Mexico.

Show Figures and/or Tables
Table 1. Scale of severity of the malformation disease proposed by Iqbal <em>et al</em>. (2006).
Table 1. Scale of severity of the malformation disease proposed by Iqbal et al. (2006).
Figure 1. A-G. Morphological characteristics of <em>Fusarium incarnatum</em>. A and B) Culture in PDA; C and D) <em>In situ</em> microconidia; E) Microconidia and macroconidia; F) Brown sporodochia; G) Alternated and lone chlamidospores in a CLA culture medium. Bars= 50 μm.
Figure 1. A-G. Morphological characteristics of Fusarium incarnatum. A and B) Culture in PDA; C and D) In situ microconidia; E) Microconidia and macroconidia; F) Brown sporodochia; G) Alternated and lone chlamidospores in a CLA culture medium. Bars= 50 μm.
Figure 2. A–D) Symptoms of malformation in common mango plants inoculated with <em>Fusarium incarnatum</em> (95VESIN and 121FRSIN); E) Control mango plant.
Figure 2. A–D) Symptoms of malformation in common mango plants inoculated with Fusarium incarnatum (95VESIN and 121FRSIN); E) Control mango plant.
Figure 3. Phylogram inferred by Neighbor Joining for partial sequenced of the TEF-1α gene of <em>Fusarium</em> species. The values in the nodes represent bootstrap scores based on 1000 replicates. Sequences MK932800 and MK932804 originate from the present study.
Figure 3. Phylogram inferred by Neighbor Joining for partial sequenced of the TEF-1α gene of Fusarium species. The values in the nodes represent bootstrap scores based on 1000 replicates. Sequences MK932800 and MK932804 originate from the present study.
  • Vol. 2025, 43(2)
  • Scientific Article

Competitive interaction between Rotylenchulus reniformis and Meloidogyne enterolobii in tomato and cucumber plants

byMaría Trinidad Valdez Morales, José Armando Carrillo Fasio, Raymundo Saúl García Estrada, Josefina León Félix, José Ángel Martínez Gallardo, Juan Manuel Tovar Pedraza*

Received: 22/September/2024 – Published: 29/April/2025DOI: https://doi.org/10.18781/R.MEX.FIT.2409-2

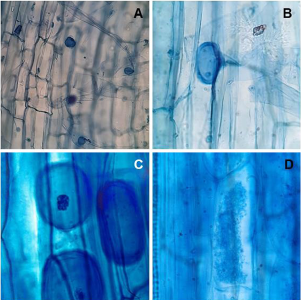
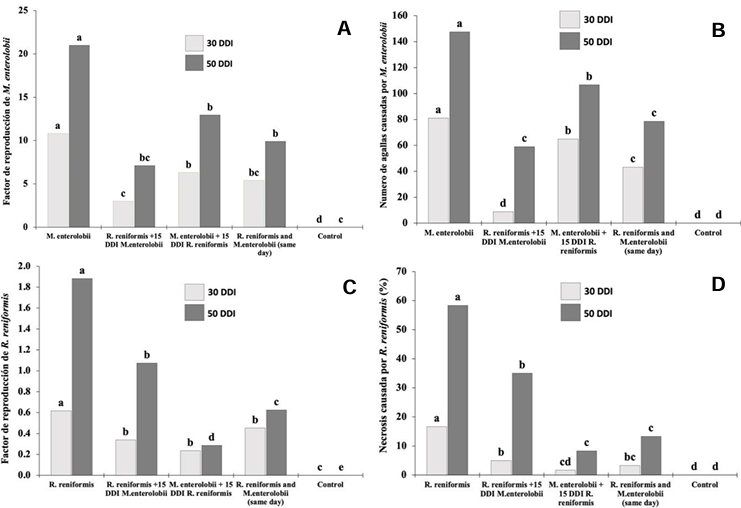
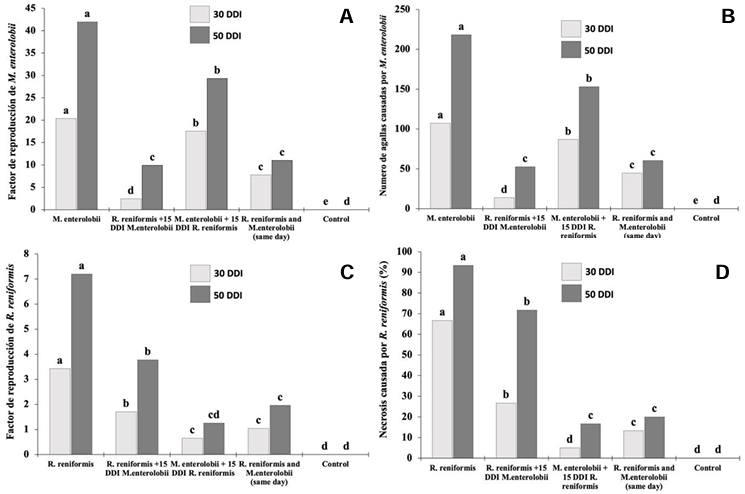
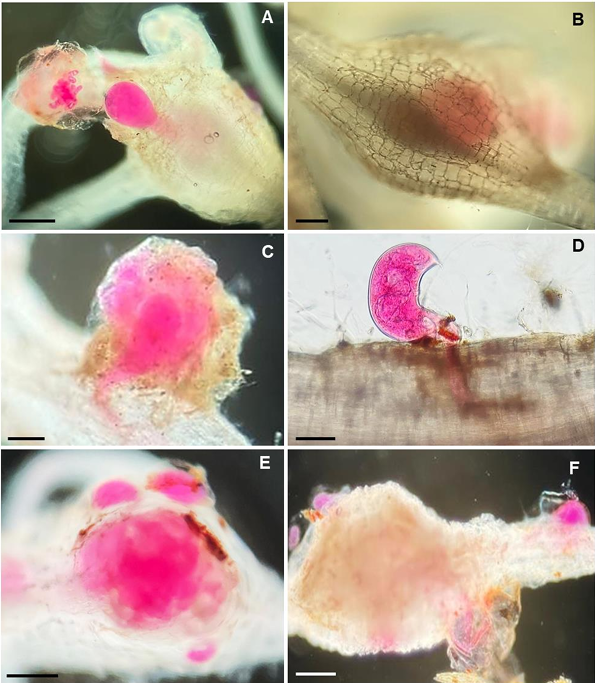
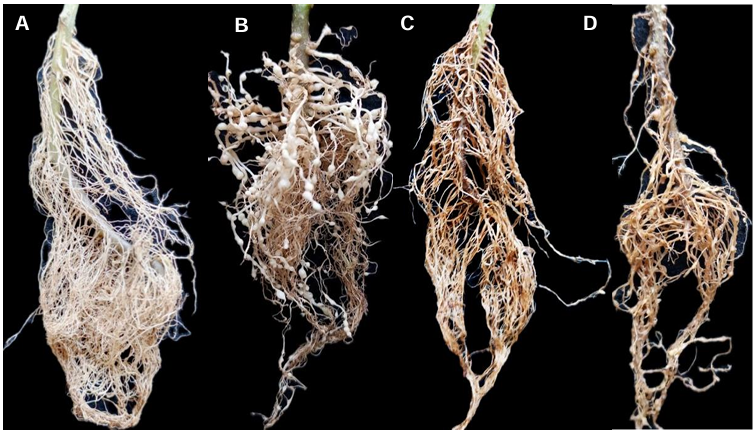
Abstract Background/Objective. The production of tomato (Solanum lycopersicum) and cucumber (Cucumis sativus) is affected by the nematodes Rotylenchulus reniformis and Meloidogyne enterolobii; however, the interaction between these two nematodes on these plant species is unknown. The aim of this study was to determine the interaction of R. reniformis and M. enterolobii in tomato and cucumber plants through artificial inoculations under greenhouse conditions.

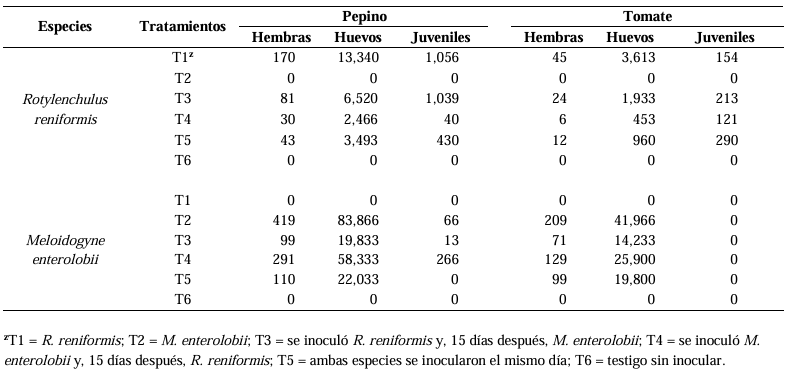
Materials and Methods. Twenty-one-day-old seedlings were inoculated with 2000 juveniles (J2) of each nematode per plant. The experiment followed a completely randomized three-factor design with six treatments: T1= R. reniformis; T2= M. enterolobii; T3= R. reniformis was inoculated and 15 days later M. enterolobii was added; T4 = M. enterolobii was inoculated and 15 days later R. reniformis was added; T5 = both species were inoculated on the same day; T6 = uninoculated control. The reproduction factor (RF) of both nematodes, galling index for M. enterolobii, and root necrosis percentage for R. reniformis were recorded at 30 and 50 days after inoculation.

Results. In cucumber plants, M. enterolobii reduced its reproduction by up to 73% in the presence of R. reniformis, while in tomato plants, its reproduction decreased by 52%, with a reduction in the galling index of 72 and 60% in cucumber and tomato plants, respectively, compared to T1 and T2. On the other hand, R. reniformis reduced its reproduction by 72% in cucumber plants and 67% in tomato plants in the presence of M. enterolobii, and a reduction in symptom severity was observed by 78 and 77% in cucumber and tomato plants, respectively, compared to T1 and T2.

Conclusion. In treatments where one species was inoculated before the other, the species inoculated first showed a higher RF and caused greater disease severity. In simultaneous co-inoculations, both nematodes reduced their RF and caused lower symptom severity in tomato and cucumber plants.

Show Figures and/or Tables
Table 1. Number of females, eggs, and juveniles of <em>R. reniformis</em> and <em>M. enterolobii</em> by treatment in cucumber and tomato plants at 50 days after inoculation.
Table 1. Number of females, eggs, and juveniles of R. reniformis and M. enterolobii by treatment in cucumber and tomato plants at 50 days after inoculation.
Figure 1. Reproduction and severity of <em>R. reniformis</em> and <em>M. enterolobii</em> in cucumber plants at 30 and 50 days after inoculation (DAI). A) Reproduction factor of <em>M. enterolobii</em>. B) Number of galls caused by <em>M. enterolobii</em>. C) Reproduction factor of <em>R. reniformis</em>. D) Percentage of root necrosis caused by <em>R. reniformis</em>. The comparison of means was conducted between bars of the same color; means that do not share a letter are significantly different.
Figure 1. Reproduction and severity of R. reniformis and M. enterolobii in cucumber plants at 30 and 50 days after inoculation (DAI). A) Reproduction factor of M. enterolobii. B) Number of galls caused by M. enterolobii. C) Reproduction factor of R. reniformis. D) Percentage of root necrosis caused by R. reniformis. The comparison of means was conducted between bars of the same color; means that do not share a letter are significantly different.
Figure 2. Reproduction and severity of <em>R. reniformis</em> and <em>M. enterolobii</em> in tomato plants at 30 and 50 days after inoculation (DAI). A) Reproduction factor of <em>M. enterolobii</em>. B) Number of galls caused by <em>M. enterolobii</em>. C) Reproduction factor of <em>R. reniformis</em>. D) Percentage of root necrosis caused by <em>R. reniformis</em>. The comparison of means was conducted between bars of the same color; means that do not share a letter are significantly different.
Figure 2. Reproduction and severity of R. reniformis and M. enterolobii in tomato plants at 30 and 50 days after inoculation (DAI). A) Reproduction factor of M. enterolobii. B) Number of galls caused by M. enterolobii. C) Reproduction factor of R. reniformis. D) Percentage of root necrosis caused by R. reniformis. The comparison of means was conducted between bars of the same color; means that do not share a letter are significantly different.
Figure 3. Micrographs of <em>Rotylenchulus reniformis</em> and <em>Meloidogyne enterolobii</em> parasitizing cucumber and tomato roots at 50 days after inoculation (DAI). A) Female of <em>M. enterolobii</em> in cucumber root. B) Female of <em>M. enterolobii</em> causing galls in tomato root. C) Female of <em>R. reniformis</em> affecting cucumber roots. D) Female of <em>R. reniformis</em> in tomato root. E) Cucumber root with a gall caused by <em>M. enterolobii</em> and three mature females of <em>R. reniformis</em> around it. F) Tomato root with a gall from <em>M. enterolobii</em> and necrosis caused by <em>R. reniformis</em>. Scale Bars: A= 300 μm; B, E, F= 500; C, D= 100 μm.
Figure 3. Micrographs of Rotylenchulus reniformis and Meloidogyne enterolobii parasitizing cucumber and tomato roots at 50 days after inoculation (DAI). A) Female of M. enterolobii in cucumber root. B) Female of M. enterolobii causing galls in tomato root. C) Female of R. reniformis affecting cucumber roots. D) Female of R. reniformis in tomato root. E) Cucumber root with a gall caused by M. enterolobii and three mature females of R. reniformis around it. F) Tomato root with a gall from M. enterolobii and necrosis caused by R. reniformis. Scale Bars: A= 300 μm; B, E, F= 500; C, D= 100 μm.
Figure 4. Tomato roots at 50 days after inoculation (DAI). A) Control without inoculation. B) Root with galls caused by <em>M. enterolobii</em>. C) Root with stunting and necrosis caused by R. reniformis. D) Root with galls, necrosis, and stunting symptoms, inoculated with <em>R. reniformis</em> and <em>M. enterolobii</em> simultaneously.
Figure 4. Tomato roots at 50 days after inoculation (DAI). A) Control without inoculation. B) Root with galls caused by M. enterolobii. C) Root with stunting and necrosis caused by R. reniformis. D) Root with galls, necrosis, and stunting symptoms, inoculated with R. reniformis and M. enterolobii simultaneously.
Figure 5. Cucumber roots at 50 days after inoculation (DAI). A) Control without inoculation. B) Root with galls caused by <em>M. enterolobii</em>. C) Root with symptoms of stunting and necrosis caused by <em>R. reniformis</em>. D) Root with galls, necrosis, and stunting symptoms, inoculated with R. reniformis and <em>M. enterolobii</em> simultaneously.
Figure 5. Cucumber roots at 50 days after inoculation (DAI). A) Control without inoculation. B) Root with galls caused by M. enterolobii. C) Root with symptoms of stunting and necrosis caused by R. reniformis. D) Root with galls, necrosis, and stunting symptoms, inoculated with R. reniformis and M. enterolobii simultaneously.
  • Vol. 2025, 43(2)
  • Scientific Article

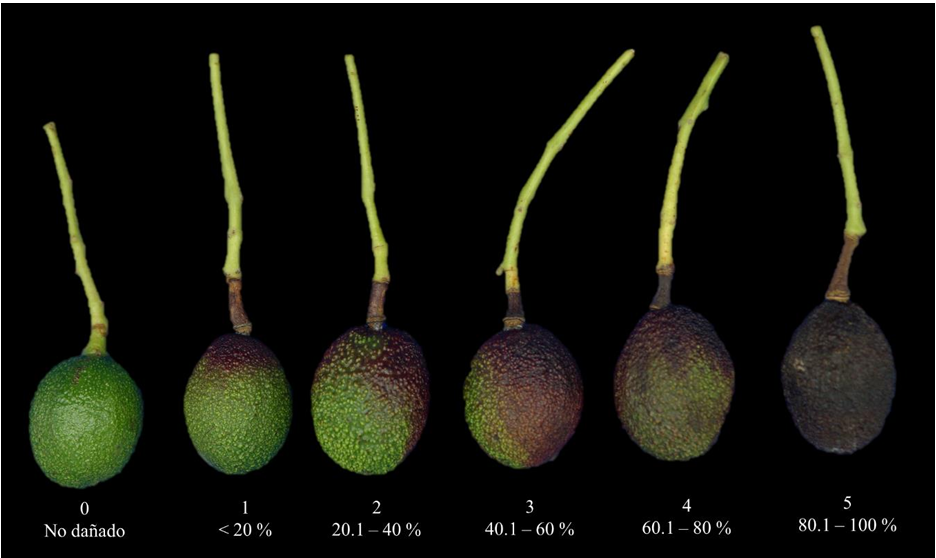
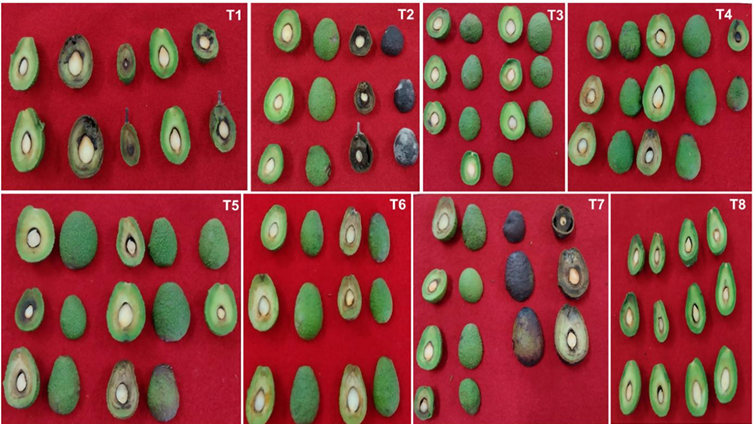
Etiology of the peduncle ringing of avocado (Persea americana) fruits cv. Hass

byMaría del Carmen Ramírez Mendoza, Rómulo García Velasco*, Juan Carlos Reyes Alemán, Gerardo Justino González Díaz

Received: 02/October/2024 – Published: 24/April/2025DOI: https://doi.org/10.18781/R.MEX.FIT.2310-3

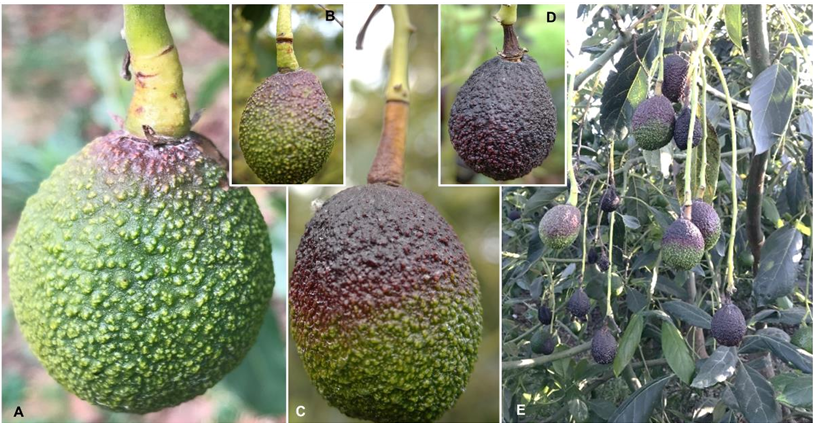
Abstract Background/Objective. In recent years, a phytopathological problem has manifested itself in avocado cultivation whose etiology is unknown, this disease is known as peduncle ringing, mainly affects fruits of the cv. Hass. The objective of this research was to determine the etiological agent involved in the development of the disease.

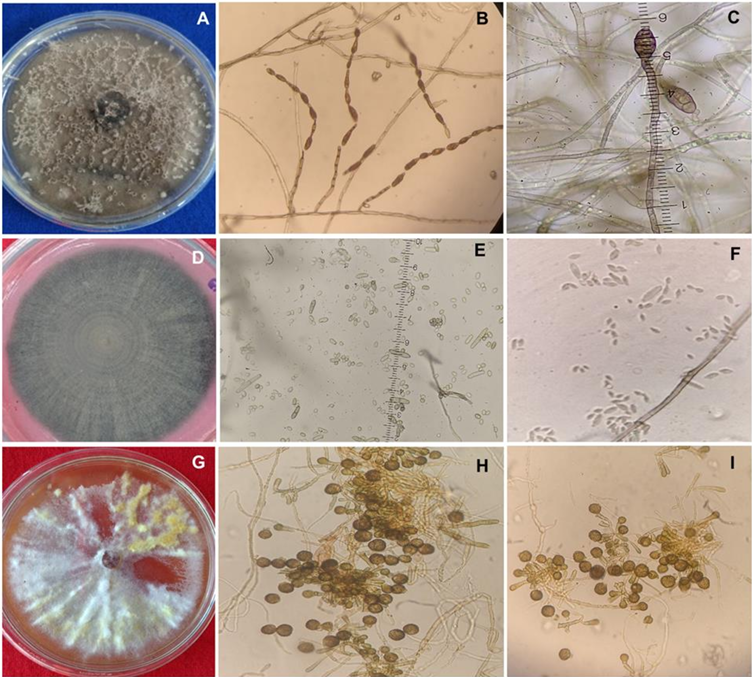
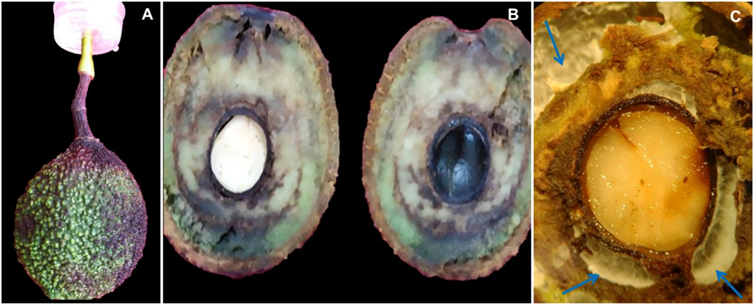
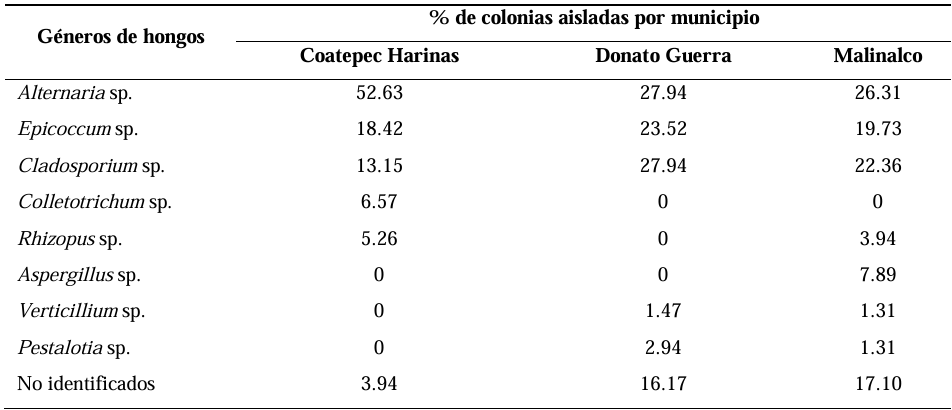
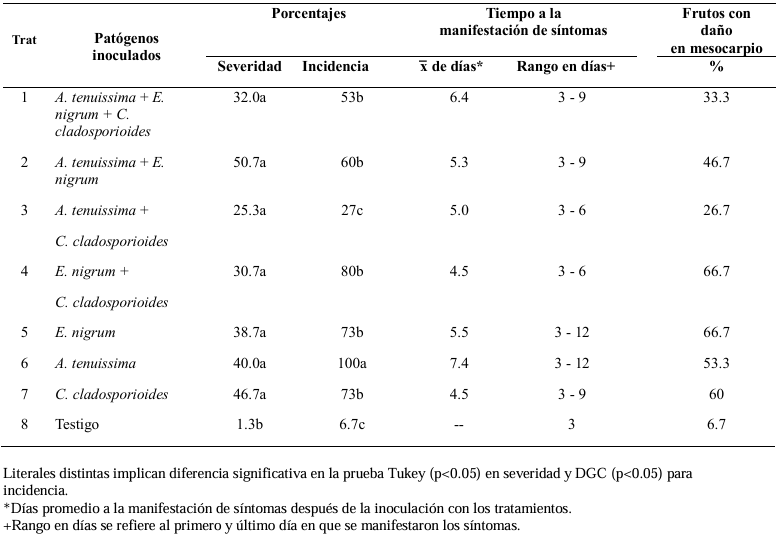
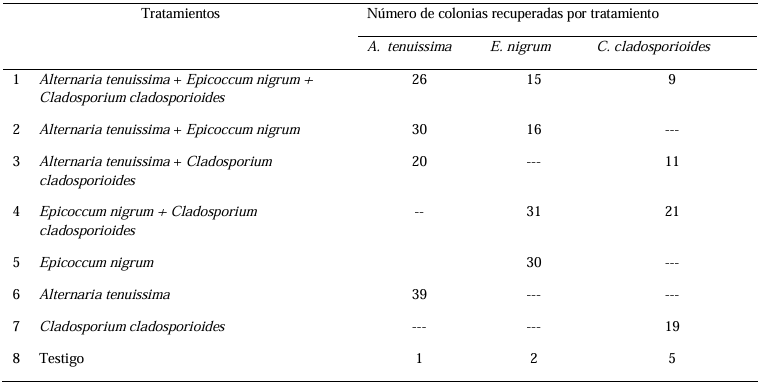
Materials and Methods. A collection of avocado fruits was carried out with characteristic symptoms of peduncle ringing: brown peduncle and reddish to purple coloration in the pericarp, the collections were made in the municipalities of Coatepec Harinas, Donato Guerra and Malinalco State of Mexico. In the laboratory, fungi were isolated in PDA medium. Three species of fungi were identified by morphological analysis and confirmed at the DNA level by PCR. Pathogenicity tests were performed on the three species identified individually and in combinations. The variables evaluated were incidence, severity, days at symptom manifestation and percentage of fruits with damaged mesocarp.

Results. Fungi associated with peduncle ringing damage in avocado fruits cv. Hass were identified as Alternaria tenuissima, Cladosporium cladosporioides and Epicoccum nigrum. A. tenuissima showed its high pathogenic capacity to induce peduncle ringing in avocado fruits with 100% incidence and 40% severity. It should be noted that the data on incidence, severity and mesocarp damage are higher in treatments when A. tenuissima, C. cladosporioides and E. nigrum act independently than in consortia.

Conclusion. A. tenuissima, C. cladosporioides and E. nigrum inoculated independently and in consortia were shown to replicate the symptoms of ringing: peduncle in brown-colored fruits and reddish to purple coloration on the pericarp and the mummification of fruits.

Show Figures and/or Tables
Figure 1. Severity scale for peduncle ringing symptoms in avocado fruits cv. Hass, proposed for assessing lesions in inoculated fruits.
Figure 2. Typical symptoms of peduncle ringing in avocado fruits cv. Hass. A and B) Fruits with dark brown ringing on the peduncle; C) Corky peduncle and fruit with purple coloration on the exocarp; D) Final stage of the ringing symptom, mummified avocado fruit with necrotic peduncle; E) Branch with fruits in different stages of ringing development.
Figure 3. Cultural and morphometric characteristics of <em>Alternaria tenuissima</em>, <em>C. cladosporioides</em> and <em>E. nigrum</em>. A) Colony of <em>A. tenuissima</em> flat growth grown in PCA medium. B) Chain conidia of 4-13 originating from primary conidiophores of erect growth. C) Measurement of muriform conidia with micrometric ruler. D) Colony of <em>C. cladosporioides</em> with flocy micelium grown in PDA medium, front. E) Measurement of unicellular-cell conidia. F) Solitary conidia detached from the conidiophore. G) Colony of <em>Epicoccum nigrum</em> flat growth and development of cottony mycelium in PDA medium. H) Formation of multicelular chlamydospores. I) Septate mycelium and globose chlamydospores of <em>E. nigrum</em>.
Figure 3. Cultural and morphometric characteristics of Alternaria tenuissima, C. cladosporioides and E. nigrum. A) Colony of A. tenuissima flat growth grown in PCA medium. B) Chain conidia of 4-13 originating from primary conidiophores of erect growth. C) Measurement of muriform conidia with micrometric ruler. D) Colony of C. cladosporioides with flocy micelium grown in PDA medium, front. E) Measurement of unicellular-cell conidia. F) Solitary conidia detached from the conidiophore. G) Colony of Epicoccum nigrum flat growth and development of cottony mycelium in PDA medium. H) Formation of multicelular chlamydospores. I) Septate mycelium and globose chlamydospores of E. nigrum.
Figure 4. Symptomatology developed in fruits inoculated with <em>Epicoccum nigrum</em>. A) Fruit with peduncle damage and purplish discoloration on the exocarp. B) Longitudinal section of the fruit showing brown to dark lesions in the mesocarp. C) Mycelial growth in the cavities of the fruit mesocarp, observed under a stereoscopic microscope.
Figure 4. Symptomatology developed in fruits inoculated with Epicoccum nigrum. A) Fruit with peduncle damage and purplish discoloration on the exocarp. B) Longitudinal section of the fruit showing brown to dark lesions in the mesocarp. C) Mycelial growth in the cavities of the fruit mesocarp, observed under a stereoscopic microscope.
Figure 5. Symptoms observed in fruits inoculated with the different fungi, both in combination and individually: T1) <em>A. tenuissima</em> + <em>E. nigrum</em> + <em>C. cladosporioides</em>. T2) <em>A. tenuissima</em> + <em>E. nigrum</em>. T3) <em>A. tenuissima</em> + <em>C. cladosporioides</em>. T4) <em>E. nigrum</em> + <em>C. cladosporioides</em>. T5) <em>E. nigrum</em>. T6) <em>A. tenuissima</em>. T7) <em>C. cladosporioides</em>. T8) Control.
Figure 5. Symptoms observed in fruits inoculated with the different fungi, both in combination and individually: T1) A. tenuissima + E. nigrum + C. cladosporioides. T2) A. tenuissima + E. nigrum. T3) A. tenuissima + C. cladosporioides. T4) E. nigrum + C. cladosporioides. T5) E. nigrum. T6) A. tenuissima. T7) C. cladosporioides. T8) Control.
Table 1. Frequency of fungi isolated from peduncles of avocado fruits cv. Hass collected from commercial orchards in the municipalities of Coatepec Harinas, Donato Guerra, and Malinalco, State of Mexico, Mexico.
Table 2. Incidence, severity, and time to symptom appearance in avocado fruits cv. Hass inoculated with A. tenuissima, <em>C. cladosporioides</em>, <em>E. nigrum</em>, and their combinations.
Table 2. Incidence, severity, and time to symptom appearance in avocado fruits cv. Hass inoculated with A. tenuissima, C. cladosporioides, E. nigrum, and their combinations.
Table 3. Number of colonies and fungal species recovered from <em>in vitro</em> pathogenicity tests on avocado fruits cv. Hass.
Table 3. Number of colonies and fungal species recovered from in vitro pathogenicity tests on avocado fruits cv. Hass.
  • Vol. 2025, 43(2)
  • Scientific Article

Characterization and identification of Burkholderia glumae in seeds of rice (Oryza sativa) varieties planted in Mexico

byGabriel Alejandro Hernández Nava, Sergio Aranda Ocampo*, Guadalupe Valdovinos Ponce, Obdulia Segura León, Mónica Osnaya González, Eridani García Vázquez, Sergio Ramírez Rojas, Leonardo Hernández Aragón

Received: 19/August/2024 – Published: 21/April/2025DOI: https://doi.org/10.18781/R.MEX.FIT.2408-3

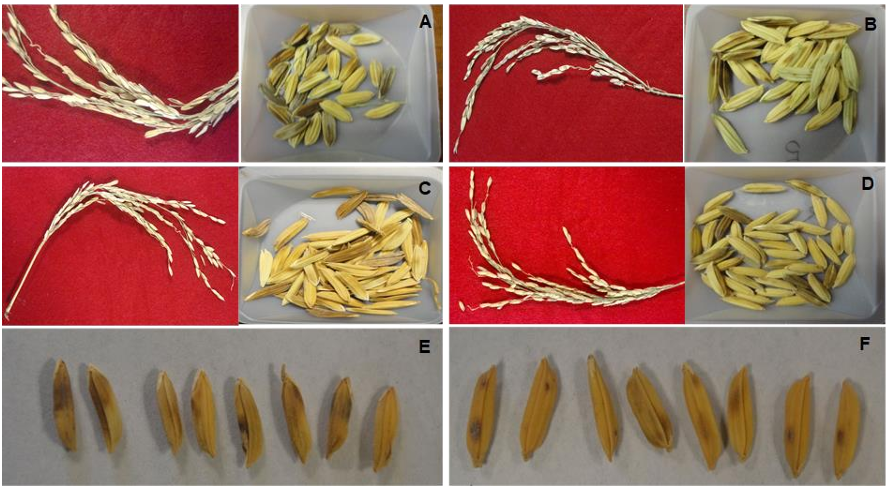
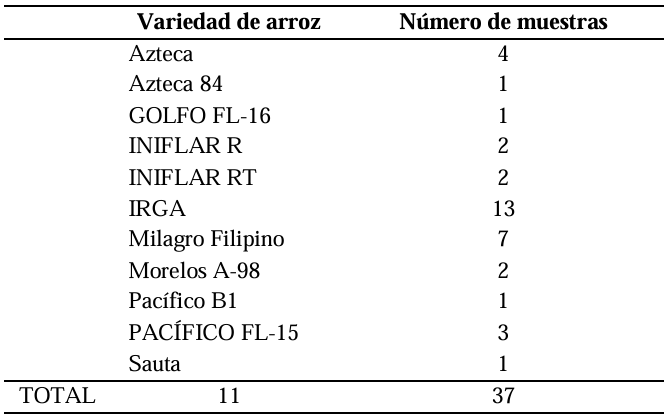
Abstract Backgrounds/Objectives. Burkholderia glumae is the most important pathogen transmitted through seeds that reduces the yield of rice (Oryza sativa). In 2022, seeds were found with symptoms of glume blotch in Mexico. The aim of this investigation was to characterize and identify the causal agent of the symptoms of glume blotch of 11 varieties of rice planted in Mexico.

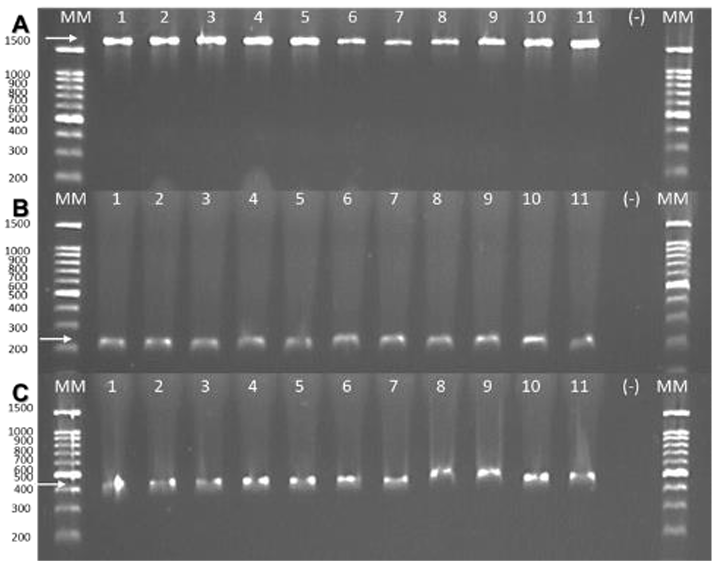
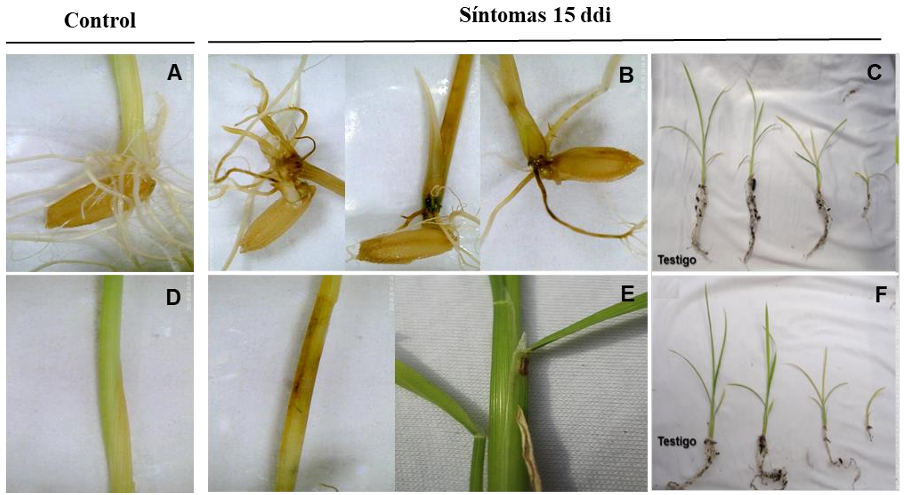
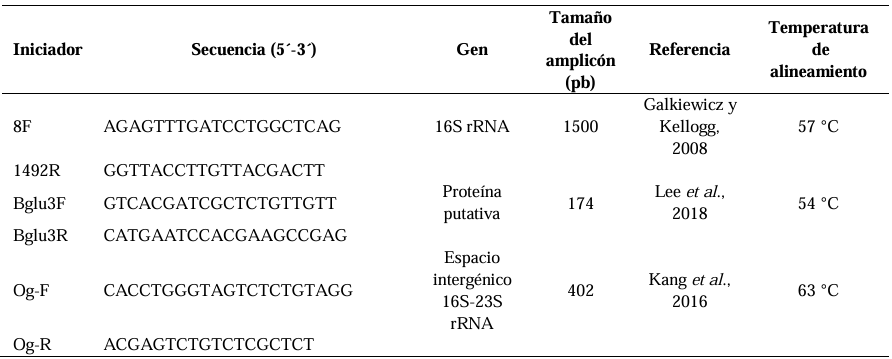
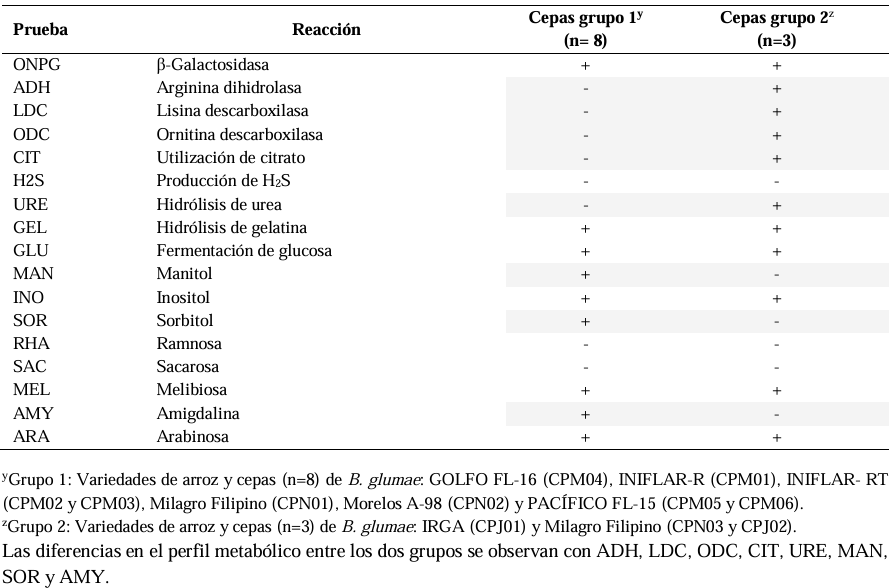
Materials and Methods. A total of 37 seeds samples were analyzed. From each sample, 1 g of seed was disinfested with sodium hypochlorite and macerated in a PBS buffer and subsequently streaked onto SPG, B de King and Wilbrinks culture media. The isolated bacterial strains were characterized by API20 and identified by amplification and partial sequencing of universal and specific genes. Pathogenicity was evaluated using a 3.5 x 10⁸ CFU mL-1 suspension on rice seeds and seedlings of the Milagro Filipino and INIFLAR R varieties.

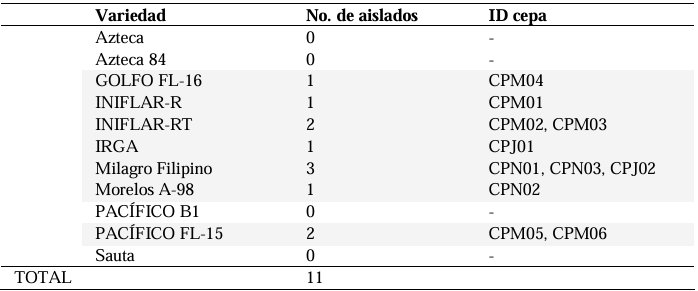
Results. Out of 37 samples, in nine (24.3 %), 11 isolates were taken with the morphology described for B. glumae. Characterization by API20 identified two groups with different metabolic profiles between the 11 strains. With PCR, the 11 strains were identified with a coverage of 100% as B. glumae with the universal primers 8F-1492R, and specific to B. glumae Bglu3F-Bglu3R and OgF-OgR. The pathogenicity of B. glumae was confirmed in rice seeds and seedlings of the Milagro Filipino and INIFLAR-R varieties.

Conclusion. B. glumae is the causal agent of the symptoms of glume blotch in rice seeds, and it was detected in seeds from seven varieties (63.6 %): GOLFO FL-16, INIFLAR-R, INIFLAR-RT, IRGA, Milagro Filipino, Morelos A-98 and PACÍFICO FL-15 of 11 rice varieties planted in Mexico.

Show Figures and/or Tables
Figure 1. Symptoms of glume blotch in panicles and seeds in the rice varieties: <strong>A</strong>. MILAGRO FILIPINO, <strong>B</strong>. MORELOS A 98, <strong>C</strong>. PACÍFICO FL-15, <strong>D</strong>. IRGA. Symptoms of blotch in seeds of the rice varieties: <strong>E</strong>. MILAGRO FILIPINO, <strong>F</strong>. MORELOS A-98.
Figure 1. Symptoms of glume blotch in panicles and seeds in the rice varieties: A. MILAGRO FILIPINO, B. MORELOS A 98, C. PACÍFICO FL-15, D. IRGA. Symptoms of blotch in seeds of the rice varieties: E. MILAGRO FILIPINO, F. MORELOS A-98.
Figure 2. Morphological characteristics of the bacterial colonies isolated from rice seeds with symptoms of glume blotch. Culture of the colonies at 28 °C for 72 h in a culture medium. <strong>A</strong>. Sucrose-phosphate-glutamate (S-PG), <strong>B</strong>. King’s B, <strong>C</strong>. Wilbrinks.
Figure 2. Morphological characteristics of the bacterial colonies isolated from rice seeds with symptoms of glume blotch. Culture of the colonies at 28 °C for 72 h in a culture medium. A. Sucrose-phosphate-glutamate (S-PG), B. King’s B, C. Wilbrinks.
Figure 3. Detection of <em>B. glumae</em> by endpoint PCR. Partial amplification of the following genes: <strong>A</strong>. 16S rRNA with primers 8F-1492R (1500 bp). <strong>B</strong>. Putative protein with primers Bglu3 (174 bp). <strong>C</strong>. 16S-23S rRNA intergenic spacer region with primers Og (402 bp). Lane 1: INIFLAR-R (CPM01); lanes 2-3: INIFLAR-RT (CPM02 and CPM03, respectively); Lane 4: GOLFO FL-16 (CPM04); lanes 5-6: PACÍFICO FL-15 (CPM05 and CPM06, respectively); Lanes 7-9: Milagro Filipino (CPN01, CPN03 and CPJ02, respectively); Lane 10: IRGA (CPJ01) and lane 11: Morelos A-98 (CPN02). MM: Molecular marker 100 bp (GOLDBIO); (-): Negative control (sterile distilled water).
Figure 3. Detection of B. glumae by endpoint PCR. Partial amplification of the following genes: A. 16S rRNA with primers 8F-1492R (1500 bp). B. Putative protein with primers Bglu3 (174 bp). C. 16S-23S rRNA intergenic spacer region with primers Og (402 bp). Lane 1: INIFLAR-R (CPM01); lanes 2-3: INIFLAR-RT (CPM02 and CPM03, respectively); Lane 4: GOLFO FL-16 (CPM04); lanes 5-6: PACÍFICO FL-15 (CPM05 and CPM06, respectively); Lanes 7-9: Milagro Filipino (CPN01, CPN03 and CPJ02, respectively); Lane 10: IRGA (CPJ01) and lane 11: Morelos A-98 (CPN02). MM: Molecular marker 100 bp (GOLDBIO); (-): Negative control (sterile distilled water).
Figure 4. Phylogenetic analysis of the fragment of region 16S rRNA of 11 strains of <em>B. glumae</em> isolated in Mexico. Consensus phylogenetic tree inferred by the Maximum likelihood method. Model GTR+G+I and 500 Bootstrap replicates. The <em>Burkholderia gladioli</em> sequence CP098321.1 was included as an outgroup. = B. glumae strains isolated from seeds with symptoms of glume blotch from rice varieties planted in Mexico.
Figure 4. Phylogenetic analysis of the fragment of region 16S rRNA of 11 strains of B. glumae isolated in Mexico. Consensus phylogenetic tree inferred by the Maximum likelihood method. Model GTR+G+I and 500 Bootstrap replicates. The Burkholderia gladioli sequence CP098321.1 was included as an outgroup. = B. glumae strains isolated from seeds with symptoms of glume blotch from rice varieties planted in Mexico.
Figure 5. Symptoms induced by <em>B. glumae</em> CPM01 15 dai in rice seeds and seedlings. MILAGRO FILIPINO variety: <strong>A</strong>. Control, submersion of seed in sterile distilled water. <strong>B</strong>. Necrosis and rotting of seeds, roots and stem. <strong>C</strong>. Reduction in growth and abnormal root development. INIFLAR-R variety: <strong>D</strong>. Control, spraying of sterile distilled water on stem. <strong>E</strong>. Necrosis and rotting of seedling stems. F. Reduction in growth and abnormal development of roots.
Figure 5. Symptoms induced by B. glumae CPM01 15 dai in rice seeds and seedlings. MILAGRO FILIPINO variety: A. Control, submersion of seed in sterile distilled water. B. Necrosis and rotting of seeds, roots and stem. C. Reduction in growth and abnormal root development. INIFLAR-R variety: D. Control, spraying of sterile distilled water on stem. E. Necrosis and rotting of seedling stems. F. Reduction in growth and abnormal development of roots.
Table 1. Varieties of rice analyzed to identify the causal agent of the glume blotch in seeds.
Table 2. Primers used for the identification of bacteria isolated from seeds with symptoms of glume blotch in rice varieties planted in Mexico.
Table 3. Bacterial strains with a <em>B. glumae</em> phenotype isolated with symptoms of glume blotch in rice varieties planted in Mexico.
Table 3. Bacterial strains with a B. glumae phenotype isolated with symptoms of glume blotch in rice varieties planted in Mexico.
Table 4. Physiological and biochemical characterización with API 20E from 11 strains with a <em>B. glumae</em> phenotype of rice seeds with symptoms of necrosis in glumes.
Table 4. Physiological and biochemical characterización with API 20E from 11 strains with a B. glumae phenotype of rice seeds with symptoms of necrosis in glumes.
Table 5. Molecular identification of 11 strains isolated from seeds of rice varieties planted in Mexico with symptoms of glume blotch.
  • Vol. 2025, 43(2)
  • Phytopathological note

Spent substrate of Pleurotus ostreatus as a nematicide of Nacobbus aberrans in chili pepper (Capsicum annuum) plants

byRicardo Del Porte Argueta, Maura Téllez Téllez, Ma. de Lourdes Acosta Urdapilleta, Olga Gómez Rodríguez, Arnoldo Wong Villarreal, Christian Carreño Campos, Liliana Aguilar Marcelino*

Received: 27/July/2024 – Published: 17/April/2025DOI: https://doi.org/10.18781/R.MEX.FIT.2407-2

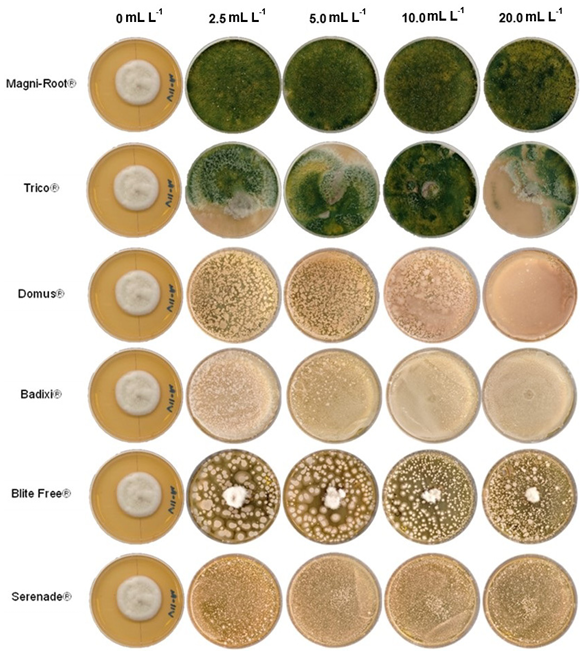
Abstract Background/Objetive. The chili pepper (Capsicum annuum) is one of the most important agricultural crops in Mexico. Due to this, the aims were to determine the in vitro effect of the spent substrate by the edible fungus P. ostreatus, strain HEMIM-50, (SSPO) against N. aberrans and evaluate the in situ effectiveness of the SSPO against N. aberrans in chili pepper plants.

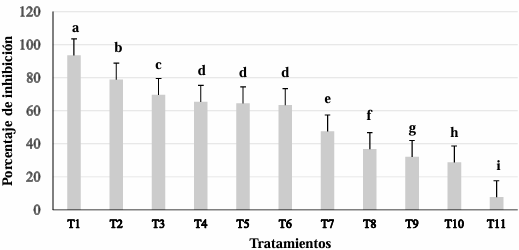
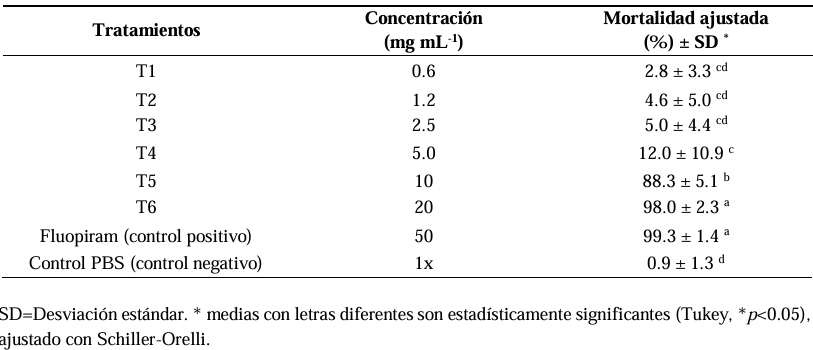
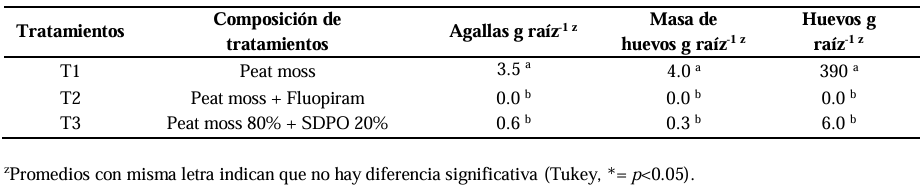
Material and methods. For the in vitro test, six serial concentrations of the hydroalcoholic extract (SSPO), ranging from 0.62 to 20 mg mL-1 against N. aberrans juveniles. An ANOVA was carried out, followed by Tukey’s means comparison test (p<0.05), adjusted with Schiller-Orelli. For the in situ assay with chili pepper plants, three treatments were evaluated: control (Peat moss), nematicide (Peat moss + Fluopiram) and SSPO (Peat moss 80% + SSPO 20%) and galls, egg masses and eggs per gram of root were measured after 45 days. The data were analyzed using the GLM and LSD tests to compare the means of each treatment. All statistical analyses were analyzed in the Statistical Analysis System program, SAS 9.0.

Results. The highest percentage of mortality was obtained with 20 mg mL-1 of the SSPO with a mortality of 98% of mortality and had no significant difference with the positive control with Fluopiram (p<0.05), followed by a mortality of 88.3% with the treatment at 10 mg mL-1. In the in situ evaluation in a combination of Peat moss 80% + SSPO 20%, a reduction of 82% in the number of galls was observed, along with 99% in the mass of eggs and 98% in the number of N. aberrans in comparison with the control with Peat moss. There were no significant differences (0.0b) with the combination of Peat moss + Fluopiram commercial nematicide (Tukey, p<0.05).

Conclusion. The spent substrate by P. ostreatus (SSPO) had an in vitro nematocidal activity (98%) against juvenile N. aberrans nematodes; in addition, the input in which the fungus was planted presented a reduction in galls of 82% and 98% for in situ N. aberrans egg mass that infected the chili pepper crop.

Show Figures and/or Tables
Table 1. Mortality of <em>N. aberrans</em> (J2) in presence of the spent substrate <em>P. ostreatus</em> (SSPO) at 72 h post confrontation.
Table 1. Mortality of N. aberrans (J2) in presence of the spent substrate P. ostreatus (SSPO) at 72 h post confrontation.
Table 2. <em>In situ</em> effect of the spent substrate <em>P. ostreatus</em> against <em>N. aberrans</em> 45 days after inoculation in chili pepper plants.
Table 2. In situ effect of the spent substrate P. ostreatus against N. aberrans 45 days after inoculation in chili pepper plants.
  • Vol. 2025, 43(4)
  • Scientific Article
  • Special issue

In vitro antagonism of Trichoderma against Sclerotium rolfsii from potato (Solanum tuberosum)

byGabriel Herrera Rodríguez, Gabriel Antonio Lugo García*, María Belén Irazoqui Acosta, Diana Laura Muñoz Bojórquez, Sara Elodia Armenta López, Rubén Félix Gastélum, Hugo Beltrán Peña, Guadalupe Arlene Mora Romero

Received: 23/November/2024 – Published: 17/April/2025DOI: https://doi.org/10.18781/R.MEX.FIT.2024-10

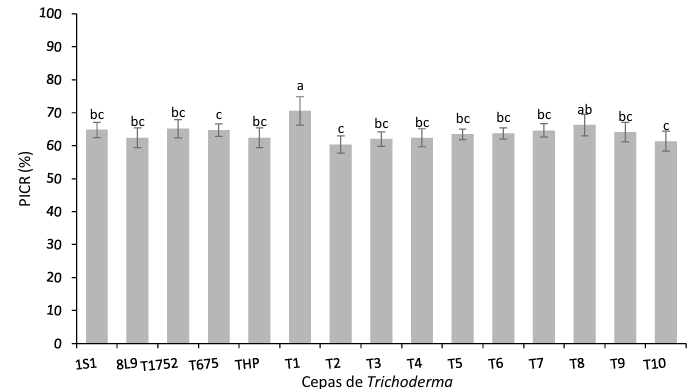
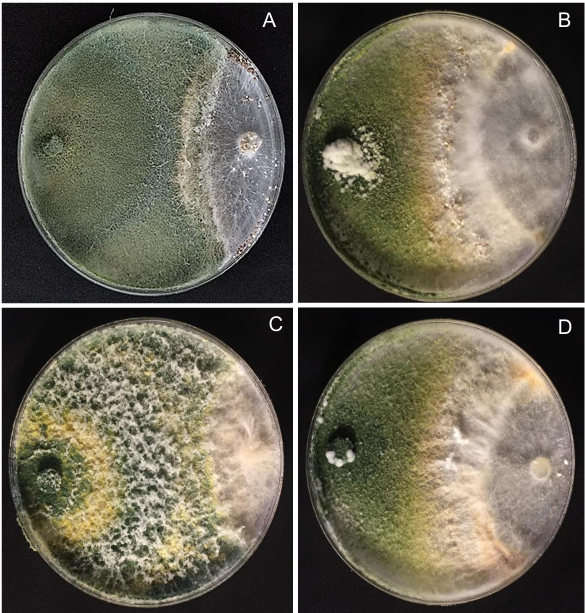
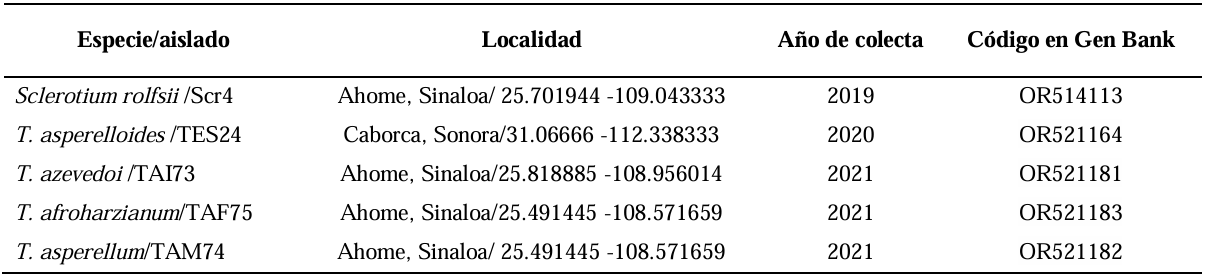
Abstract Background/Objective. Trichoderma constitutes a viable alternative for reducing the destructive potential of soft rot (Sclerotium rolfsii) in potato crops. The objectives of this research were to determine the in vitro antagonistic effectiveness of Trichoderma asperellum, T. asperelloides, T. afroharzianum, and T. azevedoi against S. rolfsii (Scr4 and Scr17) and to determine the hyphal interactions of the antagonists, on addition to determinate the inhibition of mycelial growth of S. rolfsii (Scr4) by volatile metabolites produced by Trichoderma species.

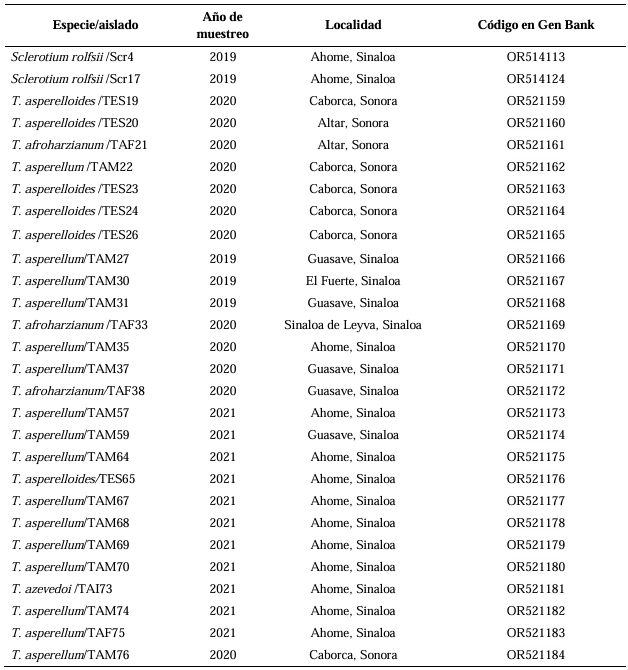
Materials and Methods. The in vitro biological effectiveness of 16 T. asperellum isolates, five T. asperelloides isolates, four T. afroharzianum isolates, and one T. azevedoi isolate in inhibiting S. rolfsii (Scr4 and Scr17) mycelial growth was studied. The type of hyphal interaction between the same Trichoderma spp. isolates and S. rolfsii (Scr4) was also determined. The effect of volatile metabolites produced by Trichoderma spp. isolates on the inhibition of mycelial growth of S. rolfsii (Scr4) was evaluated. Data on mycelial growth inhibition were analyzed using nonparametric statistical analysis (Kruskal Wallis), and the mean separation was performed using the procedures of Conover (1999) with (P ≤ 0.05).

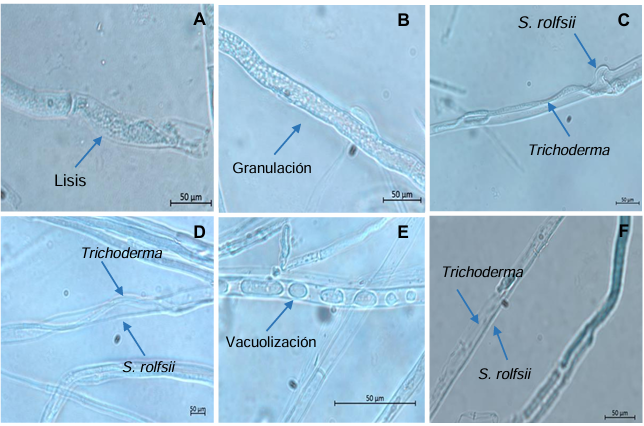
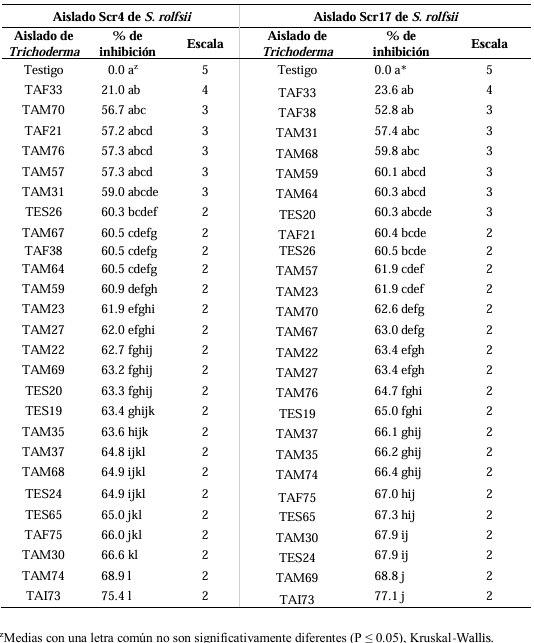
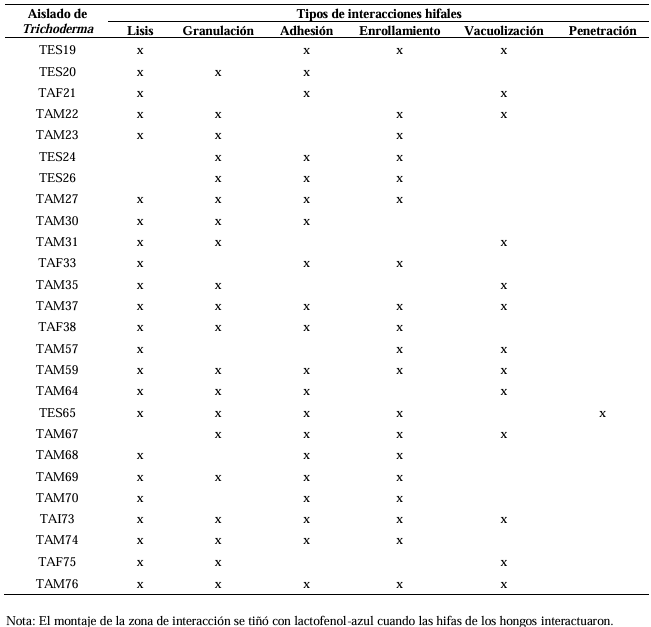
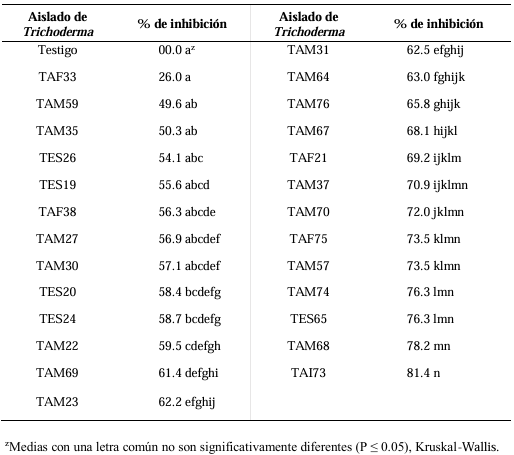
Results. In dual confrontations, Trichoderma species showed mycelial growth inhibitions of 21.0 to 75.4% and 23.6 to 77.1% in S. rolfsii isolates Scr4 and Scr17, respectively. Hyphal interactions of the same Trichoderma species consisted of vacuolization, granulation, coiling, adhesion, lysis, and penetration into the pathogen (Scr4); all four Trichoderma species inhibited mycelial growth (26.0 to 81.4%) of S. rolfsii. T. azevedoi stood out among the isolates for showing greater antagonistic capacity in all tests.

Conclusion. The results indicate that Trichoderma species, especially T. azevedoi (TAI73), inhibited the growth of S. rolfsii Scr4 (75.4%) and Scr17 (77.1%). T. azevedoi (TAI73) caused vacuolization, granulation, coiling, adhesion, and lysis of hyphae in the Scr4 isolate.

Show Figures and/or Tables
Figure 1. <em>In vitro</em> antagonism of <em>Trichoderma</em> spp. (left) against <em>S. rolfsii</em> (right). (A) <em>Trichoderma</em> isolate TAI73 against <em>S. rolfsii</em> Scr4, (B) <em>Trichoderma</em> TAF33 against <em>S. rolfsii</em> Scr4, (C) <em>Trichoderma</em> TES24 against <em>S. rolfsii</em> Scr17 and (D) <em>Trichoderma</em> TAF33 against <em>S. rolfsii</em> Scr17.
Figure 1. In vitro antagonism of Trichoderma spp. (left) against S. rolfsii (right). (A) Trichoderma isolate TAI73 against S. rolfsii Scr4, (B) Trichoderma TAF33 against S. rolfsii Scr4, (C) Trichoderma TES24 against S. rolfsii Scr17 and (D) Trichoderma TAF33 against S. rolfsii Scr17.
Figure 2. Hyphal interactions between <em>Trichoderma</em> spp. isolates and <em>Sclerotium rolfsii</em>. (A) Lysis (TAM67), (B) granulation (TES65), (C) adhesion (TAM69), (D) coiling (TAM59), (E) vacuolization (TAM76), and (F) penetration (TES65).
Figure 2. Hyphal interactions between Trichoderma spp. isolates and Sclerotium rolfsii. (A) Lysis (TAM67), (B) granulation (TES65), (C) adhesion (TAM69), (D) coiling (TAM59), (E) vacuolization (TAM76), and (F) penetration (TES65).
Figure 3. Inhibitory effect of volatile metabolites from <em>Trichoderma</em> spp. against <em>Sclerotium rolfsii</em>. (A) <em>Sclerotium rolfsii</em> (Scr4) isolate exposed to volatile metabolites from <em>Trichoderma</em> TAM68 and (B) <em>S. rolfsii</em> (Scr4) exposed to volatile metabolites from <em>Trichoderma</em> TAM30.
Figure 3. Inhibitory effect of volatile metabolites from Trichoderma spp. against Sclerotium rolfsii. (A) Sclerotium rolfsii (Scr4) isolate exposed to volatile metabolites from Trichoderma TAM68 and (B) S. rolfsii (Scr4) exposed to volatile metabolites from Trichoderma TAM30.
Table 1. Origin and identification of <em>Sclerotium rolfsii</em> and <em>Trichoderma</em> species isolates.
Table 1. Origin and identification of Sclerotium rolfsii and Trichoderma species isolates.
Table 2. <em>In vitro</em> antagonism of 26 <em>Trichoderma</em> spp. isolates against two <em>Sclerotium rolfsii</em> isolates.
Table 2. In vitro antagonism of 26 Trichoderma spp. isolates against two Sclerotium rolfsii isolates.
Table 3. <em>In vitro</em> hyphal interaction of 26 <em>Trichoderma</em> spp. isolates and <em>Sclerotium rolfsii</em> (Scr4).
Table 3. In vitro hyphal interaction of 26 Trichoderma spp. isolates and Sclerotium rolfsii (Scr4).
Table 4. Effect of volatile metabolites from <em>Trichoderma</em> isolates against <em>Sclerotium rolfsii</em> Scr4.
Table 4. Effect of volatile metabolites from Trichoderma isolates against Sclerotium rolfsii Scr4.
  • Vol. 2025, 43(2)
  • Scientific Article

In vitro sensitivity of Sclerotium rolfsii and four species of Trichoderma to common-use fungicides on the potato (Solanum tuberosum) crop

byGabriel Herrera Rodríguez, Gabriel Antonio Lugo García1, María Belén Irazoqui Acosta, José de Jesús Lara Flores, Sara Elodia Armenta López, Rubén Félix Gastélum*, Hugo Beltrán Peña, Guadalupe Arlene Mora Romero

Received: 30/May/2024 – Published: 14/April/2025DOI: https://doi.org/10.18781/R.MEX.FIT.2405-12

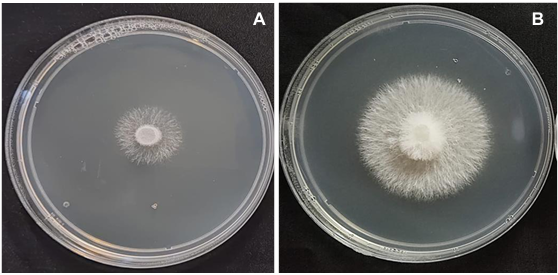
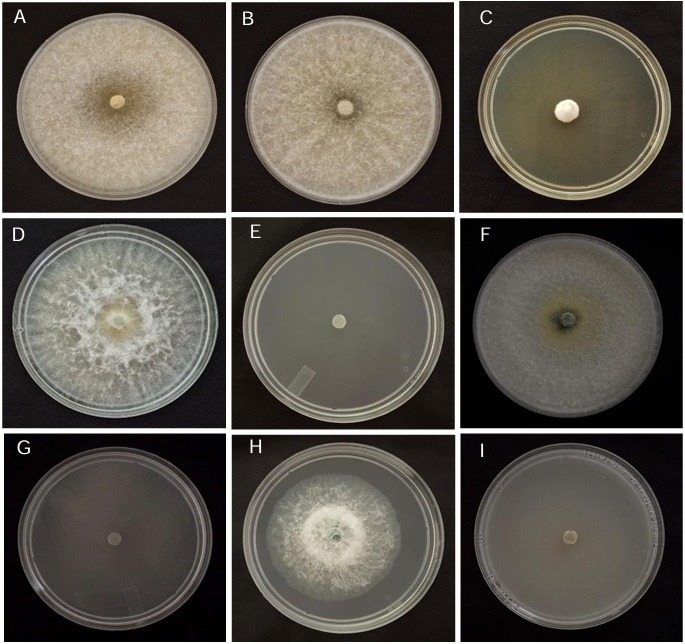
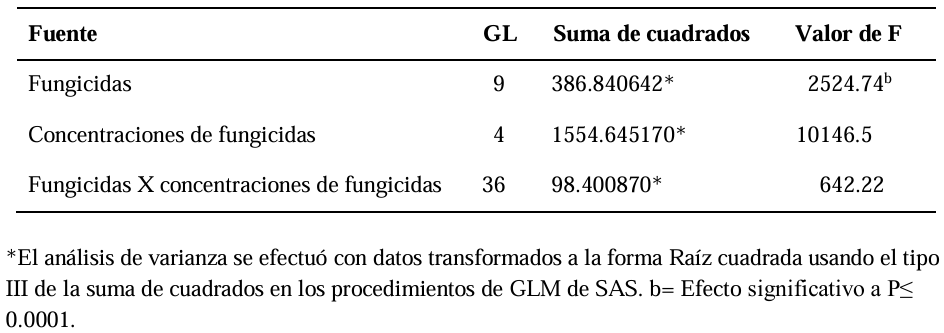
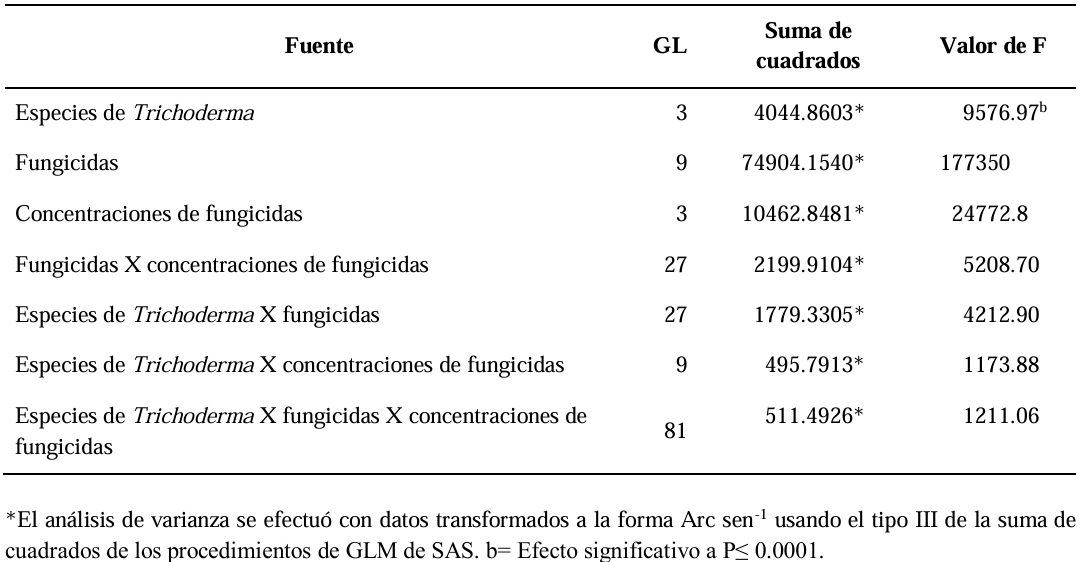
Abstract Background/Objective. Soft rot of potato tubers, caused by Sclerotium rolfsii, is a disease that occurs in soils with high levels of humidity and temperatures above 30 °C. Synthetic fungicides are primarily used for its control. The objectives of this study were to determine the biological efficacy of synthetic fungicides at different concentrations against the pathogen and the sensitivity of four species of Trichoderma to commonly used fungicides in potato in Sinaloa.

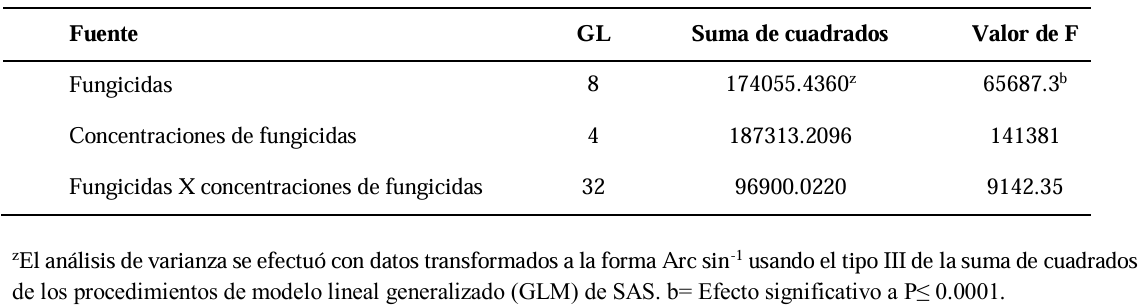
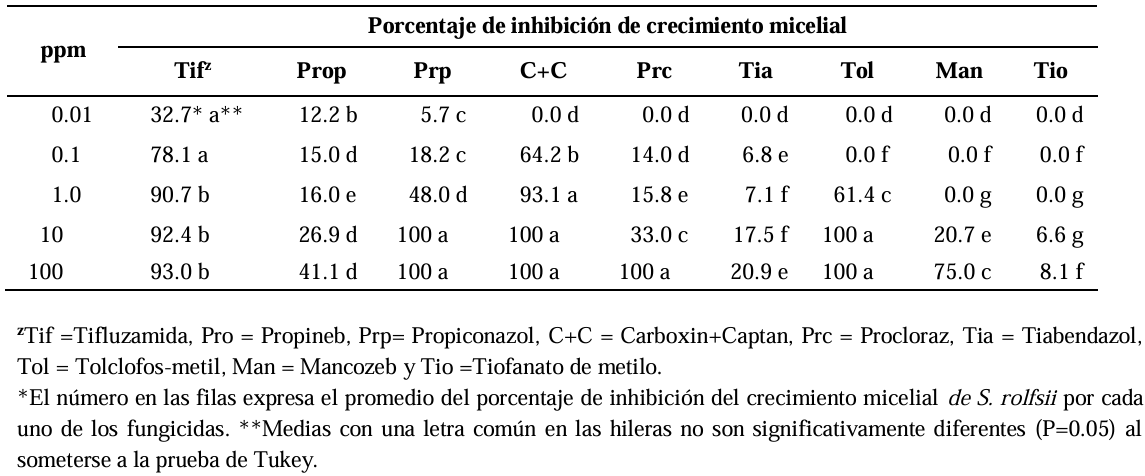
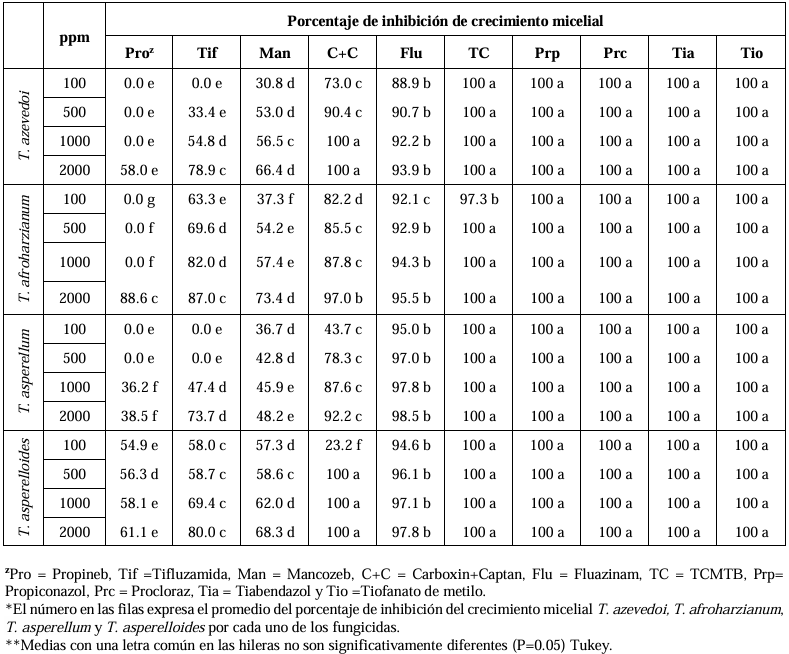
Materials and Methods. The in vitro efficacy of nine fungicides at concentrations of 0.01, 0.1, 1, 10 and 100 ppm on mycelial growth inhibition and sclerotia formation of S. rolfsii was determined. Furthermore, the in vitro sensitivity of T. afroharzianum, T. asperelloides, T. asperellum, and T. azevedoi to 10 fungicides at concentrations of 100, 500, 1000, and 2000 ppm was studied. The experiment was conducted twice. Treatments were distributed in a completely randomized design and data were subjected to ANOVA. Means were compared with the Tukey test (p < 0.05).

Results. Thifluzamide and Propineb at the 0.01 ppm concentration inhibited mycelial growth S. rolfsii by 32.7 and 12.2%, respectively. On the other hand, S. rolfsii produced 157, 164, and 164 sclerotia per Petri dish on PDA supplemented with the fungicides. Thifluzamide, Propineb and prochloraz, respectively, at the same concentration. In contrast, Propineb at a concentration of 100 ppm inhibited the mycelial growth of T. azevedoi, T. afroharzianum, T. asperellum and T. asperelloides by 0, 0, 0 and 54.9%, respectively; while the inhibition of mycelial growth by Thifluzamide at the same concentration in T. azevedoi, T. afroharzianum, T. asperellum and T. asperelloides ranged from 0 to 63%. The results indicate that the four Trichoderma species are compatible with both fungicides.

Conclusion. The effect of thifluzamide and propineb on mycelial growth inhibition and sclerotia formation of S. rolfsii, as well as their compatibility with the four species Trichoderma, indicates that the combination of Trichoderma spp. and the fungicides has potential use for controlling soft rot of potato tubers under field conditions.

Show Figures and/or Tables
Figure 1. Inhibition of the mycelial growth of four <em>Trichoderma</em> species in PDA added with synthetic fungicides. A) <em>T. azevedo</em>i+Propineb 100 ppm; B) <em>T. azevedoi</em>+Tifluzamide 100 ppm; C) <em>T. azevedoi</em>+Fluazinam 100 ppm; D) <em>T. afroharzianum</em>+Propineb 100 ppm; E) <em>T. afroharzianum</em>+Propiconazole 100 ppm; F) <em>T. asperellum</em>+Propineb 100 ppm; G) <em>T. asperellum</em>+Thiabendazole 100 ppm; H) <em>T. asperelloides</em>+Tifluzamide 100 ppm; I) <em>T. asperelloides</em>+TCMTB 100 ppm.
Figure 1. Inhibition of the mycelial growth of four Trichoderma species in PDA added with synthetic fungicides. A) T. azevedoi+Propineb 100 ppm; B) T. azevedoi+Tifluzamide 100 ppm; C) T. azevedoi+Fluazinam 100 ppm; D) T. afroharzianum+Propineb 100 ppm; E) T. afroharzianum+Propiconazole 100 ppm; F) T. asperellum+Propineb 100 ppm; G) T. asperellum+Thiabendazole 100 ppm; H) T. asperelloides+Tifluzamide 100 ppm; I) T. asperelloides+TCMTB 100 ppm.
Table 1. Species and isolates of <em>Sclerotium rolfsii</em> and <em>Trichoderma</em>, site and year of collection and code in the GeneBank.
Table 1. Species and isolates of Sclerotium rolfsii and Trichoderma, site and year of collection and code in the GeneBank.
Table 2. Factorial analysis of variance of the percentage of <em>in vitro</em> inhibition of the mycelial growth in <em>S. rolfsii</em> to four concentrations of nine fungicides.
Table 2. Factorial analysis of variance of the percentage of in vitro inhibition of the mycelial growth in S. rolfsii to four concentrations of nine fungicides.
Table 3. Average percentage of <em>in vitro</em> inhibition of the radial growth of <em>Sclerotium rolfsii</em>, caused by various synthetic fungicides.
Table 3. Average percentage of in vitro inhibition of the radial growth of Sclerotium rolfsii, caused by various synthetic fungicides.
Table 4. Factorial analysis of variance of sclerotia production by<em> S. rolfsii</em> in PDA with five concentrations of nine fungicides.
Table 4. Factorial analysis of variance of sclerotia production by S. rolfsii in PDA with five concentrations of nine fungicides.
Table 5. Production of <em>Sclerotium rolfsii</em> sclerotia per Petri dish with PDA added with the different concentrations of nine fungicides.
Table 5. Production of Sclerotium rolfsii sclerotia per Petri dish with PDA added with the different concentrations of nine fungicides.
Table 6. Factorial analysis of variance of the percentage of <em>in vitro</em> inhibition of the mycelial growth of four <em>Trichoderma</em> species by four concentrations of ten fungicides.
Table 6. Factorial analysis of variance of the percentage of in vitro inhibition of the mycelial growth of four Trichoderma species by four concentrations of ten fungicides.
Table 7. Means of percentage of <em>in vitro</em> inhibition of the radial growth of four <em>Trichoderma</em> species, caused by various synthetic fungicides.
Table 7. Means of percentage of in vitro inhibition of the radial growth of four Trichoderma species, caused by various synthetic fungicides.
  • Vol. 2025, 43(2)
  • Scientific Article

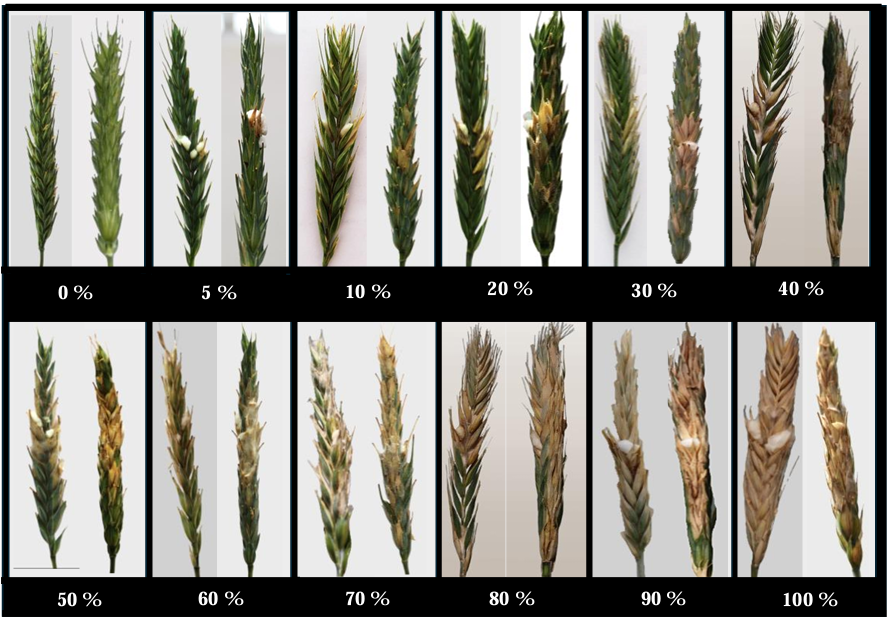
Resistance of Triticale (× Triticosecale) varieties to Fusarium spp.

byGloria Sánches Jiménez, Santos Gerardo Leyva Mir, Mateo Vargas Hernández, María Florencia Rodríguez García*, Héctor Eduardo Villaseñor Mir

Received: 24/November/2024 – Published: 14/April/2025DOI: https://doi.org/10.18781/R.MEX.FIT.2305-3

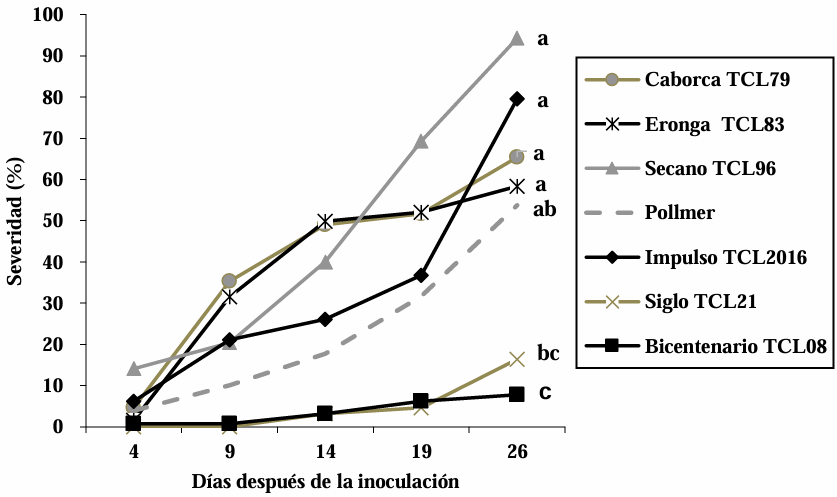
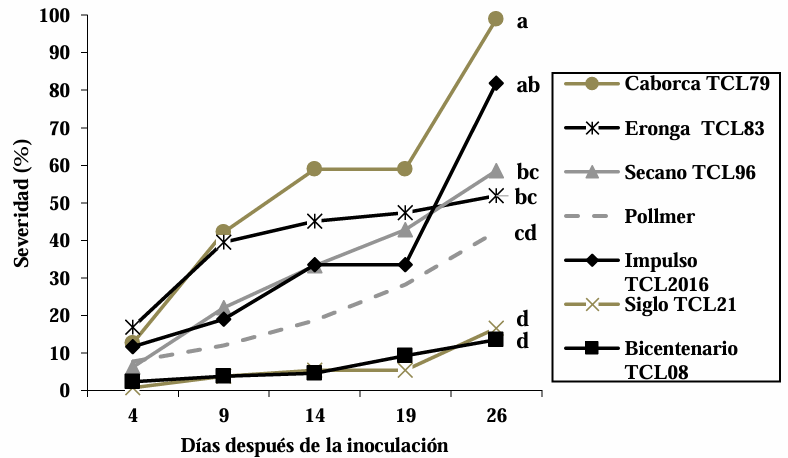
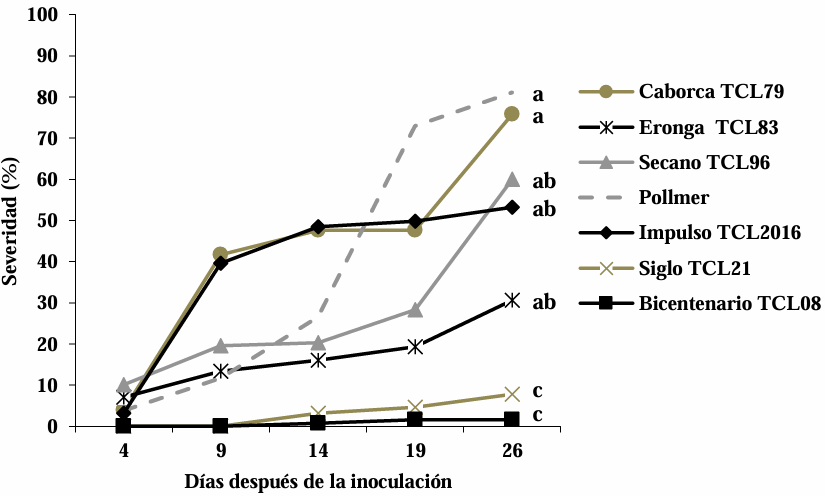
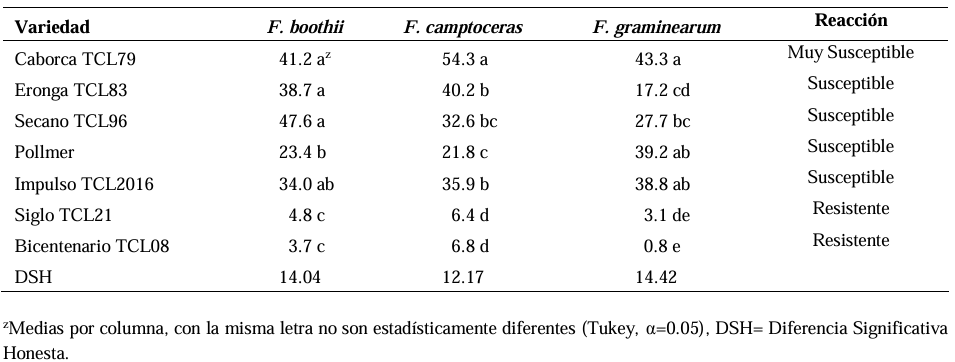
Abstract Background/Objective. Fusarium head blight (FHB) is mainly caused by Fusarium spp. species, and is a disease that affects the yield and quality of cereal grain. The objective was to evaluate the resistance in adult plants of seven triticale varieties to Fusarium boothii, F. camptoceras and F. graminearum.

Materials and Methods. The experiment was established under greenhouse conditions at INIFAP-CEVAMEX. The pathogenicity tests were carried out during the flowering stage, by means of spot inoculation by the cotton method. The severity of the disease in the spikes was assessed at 4, 9, 14, 19 and 26 days after inoculation.

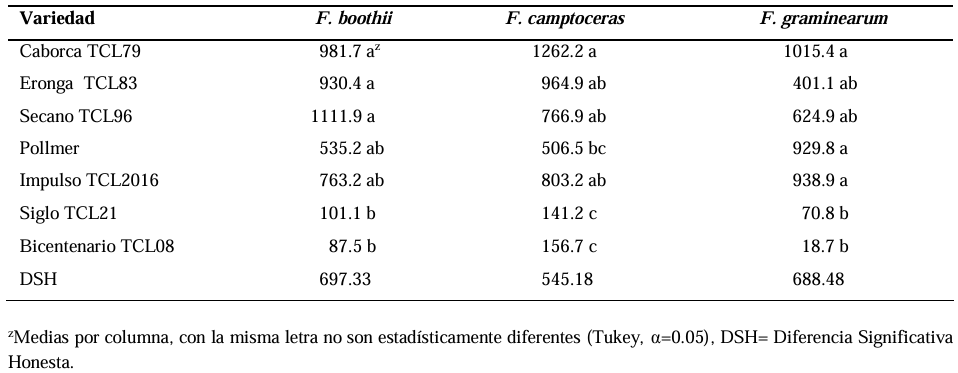
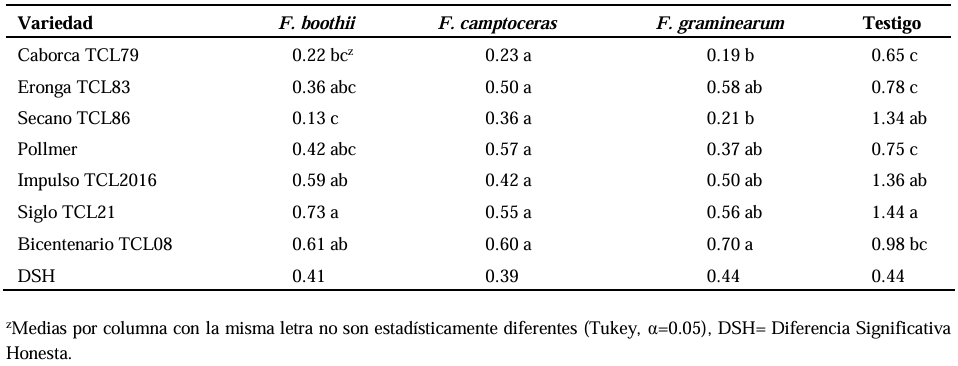
Results. The analysis of variance showed significant differences (p≤0.01) between varieties where variation in resistance was observed. The varieties Siglo TCL21 (3.1 to 6.4%) and Bicentenario TCL08 (0.8 to 6.8%) showed the lowest severities and were resistant to the three species of Fusarium, while Secano TCL96 was the most susceptible variety to F. boothii, presenting 47.6% severity; for F. camptoceras and F. graminearum, the most susceptible variety was Caborca TCL79, with severity percentages of 54.3 and 43.3%, respectively. Grain weight per spike was affected up to 90% in susceptible varieties.

Conclusion. It is important to consider in triticale breeding programs the incorporation of resistance to several Fusarium species, standing out in the present study Siglo TCL21 and Bicentenario TCL08.

Show Figures and/or Tables
Figure 1. Visual scale for determining the percentage of <em>Fusarium</em> head blight severity in triticale spikes under greenhouse conditions.
Figure 1. Visual scale for determining the percentage of Fusarium head blight severity in triticale spikes under greenhouse conditions.
Figure 2. Performance of the varieties inoculated with <em>F. boothii</em> over the five evaluations.
Figure 2. Performance of the varieties inoculated with F. boothii over the five evaluations.
Figure 3. Performance of the varieties inoculated with <em>F. camptoceras</em> over the five evaluations.
Figure 3. Performance of the varieties inoculated with F. camptoceras over the five evaluations.
Figure 4. Performance of the varieties inoculated with <em>F. graminearum</em> over the five evaluations.
Figure 4. Performance of the varieties inoculated with F. graminearum over the five evaluations.
Table 1. Mean comparisons of average severity (%) for each triticale variety in the combined analysis across the five evaluations for each <em>Fusarium</em> species.
Table 1. Mean comparisons of average severity (%) for each triticale variety in the combined analysis across the five evaluations for each Fusarium species.
Table 2.  Mean comparisons of the Area Under the Disease Progress Curve (AUDPC) for each triticale variety in the combined analysis across the five evaluations for each <em>Fusarium</em> species.
Table 2. Mean comparisons of the Area Under the Disease Progress Curve (AUDPC) for each triticale variety in the combined analysis across the five evaluations for each Fusarium species.
Table 3. Mean comparisons of grain weight (grams) per spike for each triticale variety across the five evaluations.
More Papers…

Inicia Sesión