RMF Logo

Article filters

Search Papers:

For searching before 2024 see Archive (2000-2023)

Latest Papers

  • Vol. 2026, 44(3)
  • Scientific Article

Emerging disease in melon crop associated with a mixed infection by three whitefly-transmitted viruses in La Comarca Lagunera, Mexico

byÁngela Paulina Arce Leal, Edgar Antonio Rodríguez Negrete, Manuel Arturo Méndez De León, Enrique Alejandro Guevara Rivera, Norma Elena Leyva López, Jesús Méndez Lozano*

Received: 14/April/2026 – Published: 05/August/2026
DOI: https://doi.org/10.18781/R.MEX.FIT.2604-3

Abstract Background/Objective. Cucurbits are an economic pillar of global and national agriculture. However, their productivity is threatened by the increasing incidence of viral plant diseases. Consequently, coinfections with members of the Begomovirus and Crinivirus genera have been associated with exacerbated symptoms and high incidence rates in crops, leading to emerging disease patterns. The aim of this study was to identify and molecularly characterize the begomoviruses and criniviruses associated with an emerging disease in melon crops in a municipality of the Comarca Lagunera region, Mexico.

Materials and Methods. A targeted sampling of nine melon plants exhibiting symptoms such as severe interveinal chlorosis, mottling, yellow mosaic patterns, and fruit deformation was carried out. For viral detection, DNA extraction was performed using 3% CTAB and RNA extraction using the TRIzol reagent. Begomoviruses and criniviruses were detected using PCR and RT-PCR with specific primers. Complete begomovirus genomes were enriched by rolling circle amplification (RCA). Amplicons derived from Open Reading Frame (ORF) of the capsid protein (CP) of criniviruses were generated using RT-PCR. Subsequently, the genomes and CP amplicons were cloned and sequenced for phylogenetic and evolutionary analysis.

Results. Molecular identification revealed the prevalence of mixed infections in seven of nine samples, comprised of two begomovirus species, cucurbit leaf crumple virus (CuLCrV, Begomovirus cucurbitae) and watermelon chlorotic stunt virus (WmCSV, Begomovirus citrulli), and the crinivirus cucurbit yellow stunting disorder virus (CYSDV, Crinivirus cucurbitae). Genomic analyses confirmed that CuLCrV and WmCSV possess genomic structure typical of begomoviruses. Significant divergence was observed at specific loci (CuLCrV C4 gene, WmCSV NSP gene, and DNA-B intergenic regions of both species), suggesting their potential involvement in evolutionary adaptation processes. Phylogenetically, although the CuLCrV isolate showed close relationship to isolates from Arizona and Sonora, it was placed in a clade distinct from those previously reported in the region, indicating an independent evolutionary course. Furthermore, phylogenetic analysis based on the nucleotide sequence of the CYSDV capsid protein (CP) gene revealed a close relationship with isolates previously reported in Jordan and Mexico.

Conclusions. This study represents the first report in Mexico of a disease associated with WmCSV, CuLCrV, and CYSDV coinfection in cucurbits. The findings amphasize the complexity of emerging diseases and highlight the importance of strengthening molecular epidemiological surveillance to mitigate the impact of these mixed infections on Mexican agriculture.

Show Figures and/or Tables
Table 1. Molecular detection of begomoviruses and criniviruses in melon leaf tissue. Nine samples were analyzed by PCR for the detection of begomoviruses: cucurbit leaf crumple virus (CuLCrV), watermelon chlorotic stunt virus (WmCSV), squash leaf curl virus (SLCuV), and melon chlorotic leaf curl virus (MCLCuV), and RT-PCR for the criniviruses: cucurbit yellow stunting disorder virus (CYSDV), cucurbit chlorotic yellows virus (CCYV), beet pseudo yellows virus (BPYV), and lettuce infectious virus (LIVY). (+) positive detection, (-) negative detection.
Figure 1. Melon plants and fruits showing viral symptoms collected in the La Comarca Lagunera (CL) region. A total of nine samples (M1-M9) of melon with viral symptoms were collected in the municipality of Tlahualilo. Symptoms observed in the leaf tissue were severe interveinal chlorosis, mottling, and yellow mosaic, while in the fruits, chlorosis, deformation, and cracking.
Figure 2. Complete genomic description of begomoviruses and criniviruses isolated from melon plants in the Comarca Lagunera region. A) Complete genome of CuLCrV-CL (DNA-A of 2631 bp and DNA-B of 2602 bp); B) Complete genome of WmCSV-CL (DNA-A of 2758 bp and DNA-B of 2766 bp). The open reading frames of the DNA-A (CP, AC4, Rep, TrAP, and REn) and DNA-B (NSP and MP) segments, as well as the intergenic regions (IR) of all viral segments, are shown. In the case of WmCSV, the DNA-A segment additionally encodes the AV2 and AC5 genes. C) Genomic organization of RNA segment 2 of CYSDV (7976 bp) (accession number: NC_004810). The open reading frames of Hsp70h, P6, P59, P9, CP, CPm, and p26 are displayed. The region corresponding to the CP gene (753 bp), used for molecular detection of CYSDV, is indicated with red arrows. Created in BioRender.
Figure 3. Phylogenetic trees corresponding to the DNA-A segments of begomoviruses and the CP gene of criniviruses. Neighbor-Joining (NJ) phylogenies were constructed by multiple alignments of the DNA-A segments of the begomoviruses CuLCrV-CL and WmCSV-CL (panels A and B, respectively), as well as by alignments of the complete ORF of the capsid protein (CP) of the crinivirus CYSDV (C). For the NJ phylogenetic trees, the Tamura-3 model with 1000 replicates was used. Isolates derived from this research are marked with a red asterisk. The accession numbers of the different isolates are indicated. The DNA-A of the begomovirus okra mottle virus (OMoV) and the CP of the crinivirus lettuce chlorosis virus (LCV) were used as outgroup sequences.
  • Vol. 2026, 44(3)
  • Phytopathological Note

Isolation and molecular characterization of native Trichoderma species in sites with different management practices in Chilpancingo, Guerrero, Mexico

byJatsiris A Meza Silva, Jeiry Toribio Jiménez, Renato León Rodríguez, Nelda Xanath Martínez Galero, Erubiel Toledo Hernández, Roxana Reyes Ríos, Alberto Patricio Hernández*

Received: 15/May/2026 – Published: 29/July/2026
DOI: https://doi.org/10.18781/R.MEX.FIT.2605-2

Abstract Background/Objective. The genus Trichoderma comprises fungi widely recognized for their capacity as biological control agents and plant growth promoters; however, information on their molecular diversity in agricultural systems in Guerrero, Mexico, is limited. The objective of this study was to isolate and molecularly identify native Trichoderma species present in different sites within the municipality of Chilpancingo de los Bravo, Guerrero, and to analyze their distribution in relation to management conditions.

Experimental development. During August and September 2025, 125 traps with sterile rice were installed at four sampling points: Palo Blanco (Agroecological system), the Botanical Garden of the Universidad Autónoma de Guerrero (Plant conservation), and two areas of Petaquillas (Unmanaged natural vegetation). Isolates were purified by monosporic culture, morphologically characterized, and identified by ITS region sequencing and maximum likelihood phylogenetic analysis with 1,000 bootstrap replicates.

Results. Seven Trichoderma isolates were obtained, recovered only from the Palo Blanco agroecological plot and the Botanical Garden of the Universidad Autónoma de Guerrero. Phylogenetic analysis identified T. harzianum/Hypocrea lixii, T. asperellum, and T. longibrachiatum. Representatives of T. harzianum/H. lixii and T. longibrachiatum were identified at Palo Blanco, while T. harzianum/H. lixii and T. asperellum were identified at the Botanical Garden. The T. harzianum/H. lixii complex was the predominant taxon, representing 57.1% of the isolates obtained.

Conclusion. Three Trichoderma taxa were identified, with the T. harzianum/Hypocrea lixii complex predominating (57.1%), present in Palo Blanco and the Botanical Garden. The results expand our knowledge of its diversity and distribution in Guerrero, although its biotechnological potential should be confirmed through functional evaluations.

Show Figures and/or Tables
Table 1. Location of sampling sites and <em>Trichoderma</em> isolates recovered according to site management type.
Table 1. Location of sampling sites and Trichoderma isolates recovered according to site management type.
Table 2. Sequence length, GenBank accession number, and ITS sequence similarity of <em>Trichoderma</em> isolates.
Table 2. Sequence length, GenBank accession number, and ITS sequence similarity of Trichoderma isolates.
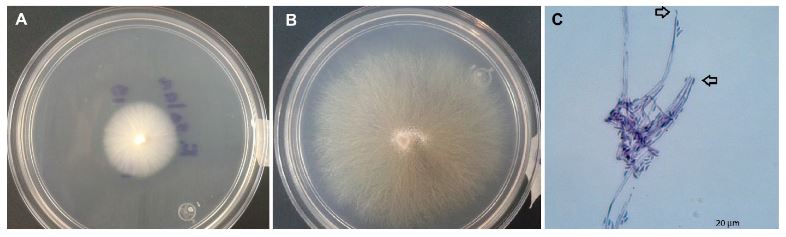
Figure 1. Representative morphological characterization of <em>Trichoderma</em>. A) Colony morphology observed on potato dextrose agar (PDA), showing the obverse and reverse sides of the colony. B) Microscopic structures observed using the slide-culture technique and lactophenol cotton blue staining (100×), showing septate hyphae, branched conidiophores, phialides, and conidia characteristic of the genus <em>Trichoderma</em>.
Figure 1. Representative morphological characterization of Trichoderma. A) Colony morphology observed on potato dextrose agar (PDA), showing the obverse and reverse sides of the colony. B) Microscopic structures observed using the slide-culture technique and lactophenol cotton blue staining (100×), showing septate hyphae, branched conidiophores, phialides, and conidia characteristic of the genus Trichoderma.
Figure 2. Phylogenetic tree inferred from ITS-region (ITS1–5.8S–ITS2) sequences of <em>Trichoderma</em> isolates obtained in this study and reference sequences retrieved from GenBank. The analysis grouped the isolates within the clades corresponding to T<em>. longibrachiatum</em>, <em>T. asperelloides</em>, <em>T. asperellum</em>, <em>T. harzianum</em>, and <em>Hypocrea lixii</em>. <em>Aspergillus niger</em> was used as the outgroup because of its phylogenetic position outside the genus <em>Trichoderma</em>, allowing the tree to be rooted and the evolutionary relationships among the analyzed isolates to be interpreted. Node values indicate bootstrap support (%) based on 1,000 replicates.
Figure 2. Phylogenetic tree inferred from ITS-region (ITS1–5.8S–ITS2) sequences of Trichoderma isolates obtained in this study and reference sequences retrieved from GenBank. The analysis grouped the isolates within the clades corresponding to T. longibrachiatum, T. asperelloides, T. asperellum, T. harzianum, and Hypocrea lixii. Aspergillus niger was used as the outgroup because of its phylogenetic position outside the genus Trichoderma, allowing the tree to be rooted and the evolutionary relationships among the analyzed isolates to be interpreted. Node values indicate bootstrap support (%) based on 1,000 replicates.
  • Vol. 2026, 44(3)
  • Scientific Article

Natural co-infection of Pospiviroid machoplantae and Begomovirus solanumseveri in tomato

byMaría del Carmen Zuñiga Romano, Daniel Leobardo Ochoa Martínez*, Reyna Isabel Rojas Martínez, Sergio Aranda Ocampo, Candelario Ortega Acosta, Erika Janet Zamora Macorra

Received: 08/March/2026 – Published: 27/July/2026
DOI: https://doi.org/10.18781/R.MEX.FIT.2603-1

Abstract Background/Objective. High whitefly populations and incidence of up to 90% of tomato plants showing mosaic, intervenial chlorosis, deformation, rugosity and leaf necrosis, associated with virus and viroids, were observed at a high-tech greenhouse in Atlacomulco, State of Mexico. To identify the viruses or viroids associated with these symptoms, the withefly species, as well as to determine if the insects were carrying any of these pathogens, monthly sampling was conducted over a two-year period, collecting plant leaf tissue and adult whiteflies.

Materials y Methods. A total of 347 plants (211 symptomatic and 136 asymptomatic) were analyzed using immunostrips for impatiens necrotic spot virus (Orthotospovirus impatiensnecromaculae), tomato spotted wilt virus (O. tomatomaculae), tobacco mosaic virus (Tobamovirus tabaci), tomato mosaic virus (T. tomatotessellati), pepino mosaic virus (Potexvirus pepini) and cucumber mosaic virus (Cucumovirus CMV), as well as by RT-PCR and PCR using universal primers for viroids and viruses of the genera Pospiviroid and Begomovirus, respectively. DNA was extracted from the insects and analyzed by PCR with specific primers that amplify a fragment of the mitocondrial gene (mtCOI) to identify the whitefly species, as well as universal primers for begomoviruses to determine if the insects were carriers of these viruses.

Results. The results obtained using immunostrips were negative. The fragments amplified by RT-PCR and PCR were sequenced and corresponded to tomato planta macho viroid (Pospiviroid machoplantae) and tomato severe leaf curl virus (Begomovirus solanumseveri). Of the plants analyzed, 49.56% tested positive for the pospiviroid, 23.9% for the begomovirus, and 8.93% for both. Infection caused solely by the viroid was the only one that resulted in an asymptomatic condition. Bemisia tabaci was identified as the whitefly species and was determined to be a carrier of B. solanumseveri.

Conclusions. Symptoms of mosaic, intervenial chlorosis, leaf deformation and necrosis, blistering, and rugosity observed in tomato plants were associated with individual infection by tomato planta macho viroid (Pospiviroid machoplantae), and tomato severe leaf curl virus (Begomovirus solanumseveri), as well as co-infection by both. This is the first report of natural co-infection of tomato planta macho viroid and tomato leaf curl virus. The presence of asymptomatic plants is a key factor to consider when carrying out cultural practices to minimize mechanical transmission of the viroid.

Show Figures and/or Tables
Figure 1. Symptoms observed in tomato plants associated with begomoviruses. A. Mosaic; B. Interveinal chlorosis; C. Leaf deformation; D. Necrosis; E. Chlorosis with blistering; F. Chlorosis with leaf deformation; G. Chlorosis with rugosity; H. Rugosity with mild mosaic.
Figure 2. 1% agarose gel electrophoresis of PCR products. A. RT-PCR products obtained using universal primers for viroids of the genus <em>Pospiviroid</em> (⁓200 bp). Lane M: 100 bp molecular marker (Promega®); Lane (+): positive control (sample positive for <em>Pospiviroid machoplantae</em>); Lane (-): negative control (water); Lanes 1-16: processed samples; B. PCR products obtained using universal primers for viruses of the genus <em>Begomovirus</em> (⁓550 bp). Lane M: 100 bp molecular marker (Promega®); Lane (+): positive control (sample positive for <em>Begomovirus abelsmoschusmexicoense</em>); Lane (-): negative control (water); Lanes 1-16: processed samples.
Figure 2. 1% agarose gel electrophoresis of PCR products. A. RT-PCR products obtained using universal primers for viroids of the genus Pospiviroid (⁓200 bp). Lane M: 100 bp molecular marker (Promega®); Lane (+): positive control (sample positive for Pospiviroid machoplantae); Lane (-): negative control (water); Lanes 1-16: processed samples; B. PCR products obtained using universal primers for viruses of the genus Begomovirus (⁓550 bp). Lane M: 100 bp molecular marker (Promega®); Lane (+): positive control (sample positive for Begomovirus abelsmoschusmexicoense); Lane (-): negative control (water); Lanes 1-16: processed samples.
Figure 3. Phylogenetic tree constructed using the Neighbor-Joining method based on partial sequences of <em>Begomovirus solanumseveri</em> and <em>Pospiviroid machoplantae</em> from the isolates obtained in this study. A. For <em>B. solanumseveri</em> the Tajima-Nei model was used with 1,000 bootstrap replicates in the MEGAX program, and <em>Capulavirus medicagonis</em> was used as the outgroup; B. For <em>P. machoplantae</em> the Tamura 3-parameter model was used with 1,000 bootstrap replicates in the MEGAX program, and <em>Coleviroid alphacolei</em> was used as the outgroup.
Figure 3. Phylogenetic tree constructed using the Neighbor-Joining method based on partial sequences of Begomovirus solanumseveri and Pospiviroid machoplantae from the isolates obtained in this study. A. For B. solanumseveri the Tajima-Nei model was used with 1,000 bootstrap replicates in the MEGAX program, and Capulavirus medicagonis was used as the outgroup; B. For P. machoplantae the Tamura 3-parameter model was used with 1,000 bootstrap replicates in the MEGAX program, and Coleviroid alphacolei was used as the outgroup.
  • Vol. 2026, 44(3)
  • Scientific Article

Detection of Closterovirus tristezae in Persian lime using machine learning and drones

byMaribel Reyes García, Remigio Anastacio Guzmán Plazola*, Reyna Isabel Rojas Martínez, Victoria Ayala Escobar, Héctor Flores Magdaleno

Received: 03/October/2025 – Published: 17/July/2026
DOI: https://doi.org/10.18781/R.MEX.FIT.2510-2

Abstract Background/Objective. Persian lime (Citrus latifolia) production in Mexico is threatened by various diseases. Among the most significant is the citrus tristeza virus (Closterovirus tristezae, CTV), which can infect plants asymptomatically. This research aimed to evaluate the use of drone-acquired multispectral imagery and machine learning algorithms to identify diseased plants as a tool for early, non-destructive detection.

Materials and Methods. The study was conducted in three agricultural fields in Campeche, México: Champotón and Castamay (sections 1 and 2). Multispectral images (green, red, red-edge, and near-infrared) were acquired, and spectral signatures, vegetation indices (NDVI, GNDVI, NDRE, SIPI), and principal components (PCA) were extracted. Supervised classifiers—Random Forest (RF), Maximum Likelihood (MAXLIKE), Support Vector Machine (SVM), and Multilayer Perceptron (MLP)—were applied using hard and soft classification schemes.

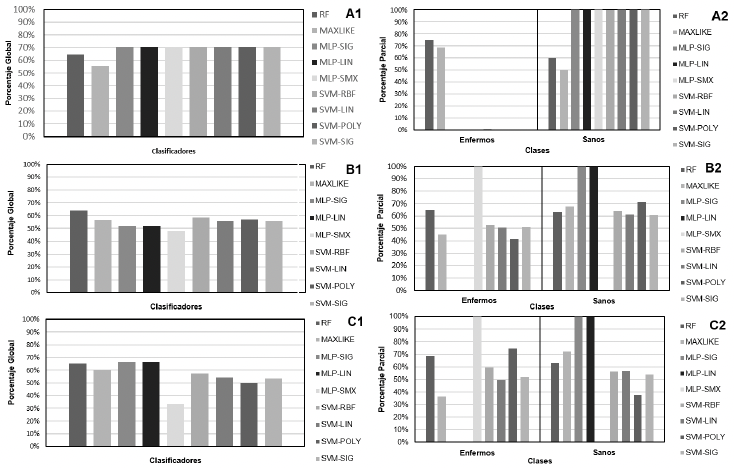
Results. RF performed the best. In hard classification, it achieved overall accuracies of 64% in Champotón and Castamay Section 1, and 65% in Section 2, with diseased plant detection rates between 65 and 75%. It yielded better results in soft classification. In Champotón, it achieved 94% overall accuracy and detected 79% of diseased plants. In Castamay Section 1, the figures were 91 and 92%, respectively; and in Section 2, it achieved 99% overall accuracy and 100% disease detection.

Conclusion. Random Forest demonstrated the most robust and stable performance across the various scenarios and fields analyzed—in both hard classification (65%) and soft classification (94%)—confirming its ability to handle non-linear relationships and spectral variability in real agricultural environments. The use of multispectral imagery combined with machine learning algorithms—specifically Random Forest (RF) for soft classification—represents an effective tool for early diagnosis of CTV in Persian lime.

Show Figures and/or Tables
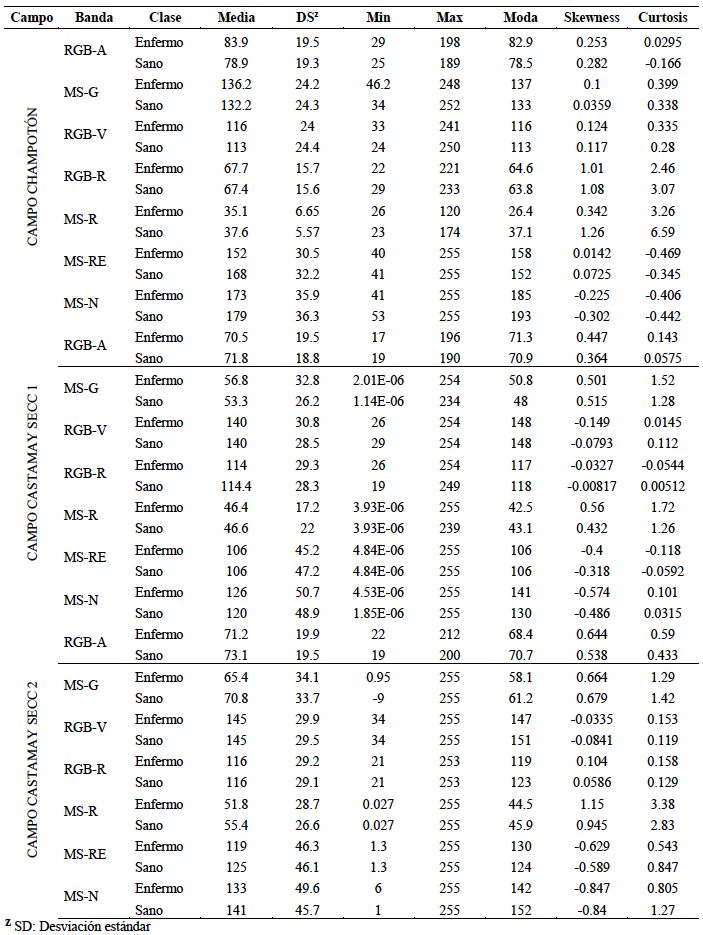
Table 1. Statistical summary of spectral values by band and class across the three fields evaluated in commercial Persian lime plantations.
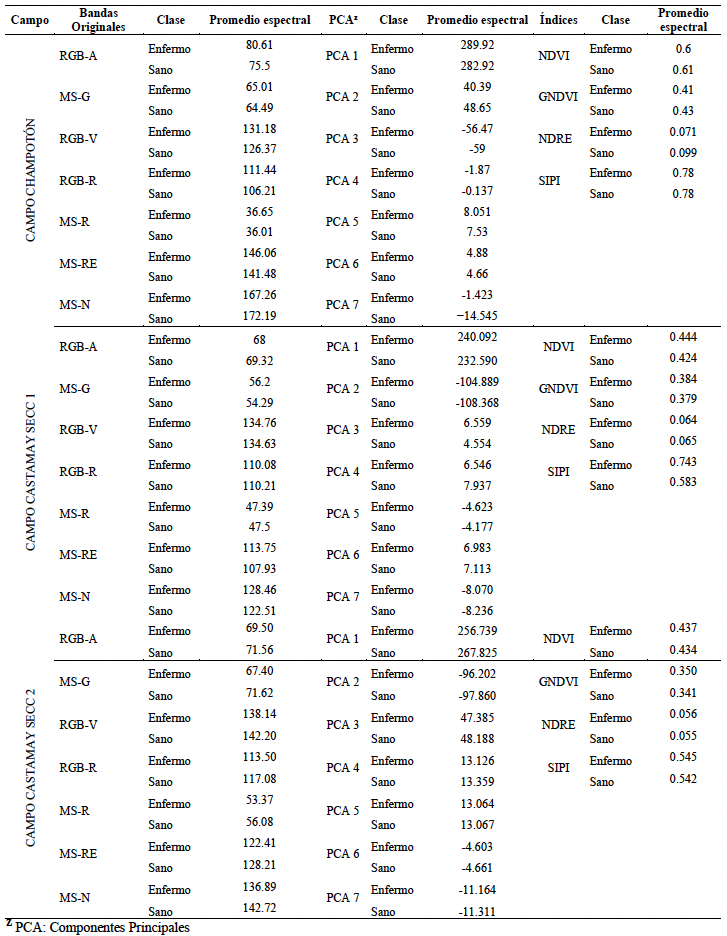
Table 2. Mean values of variables derived from the images (original bands, principal components, and vegetation indices) in the three fields analyzed in commercial Persian lime plantations.
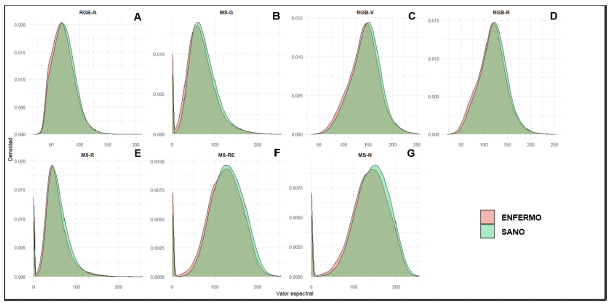
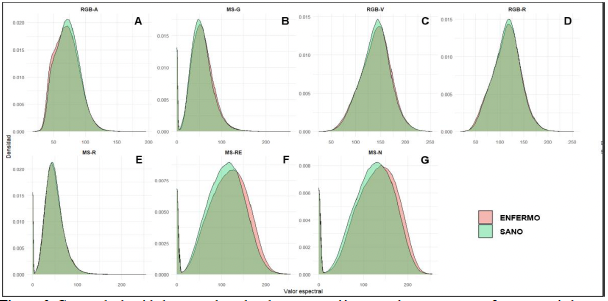
Figure 1. Spectral density curves by band: comparison between healthy plants and those infected with <em>Closterovirus tristezae</em> (CTV) in the Champotón, Campeche field.
Figure 1. Spectral density curves by band: comparison between healthy plants and those infected with Closterovirus tristezae (CTV) in the Champotón, Campeche field.
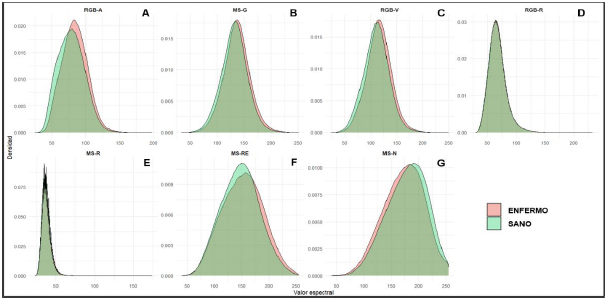
Figure 2. Spectral density curves by band: comparison between healthy plants and those infected with <em>Closterovirus tristezae</em> (CTV) in the Castamay Section 1 field, Campeche.
Figure 2. Spectral density curves by band: comparison between healthy plants and those infected with Closterovirus tristezae (CTV) in the Castamay Section 1 field, Campeche.
Figure 3. Spectral density curves by band: comparison between healthy plants and those infected with <em>Closterovirus tristezae</em> (CTV) in the Castamay Section 2 field, Campeche.
Figure 3. Spectral density curves by band: comparison between healthy plants and those infected with Closterovirus tristezae (CTV) in the Castamay Section 2 field, Campeche.
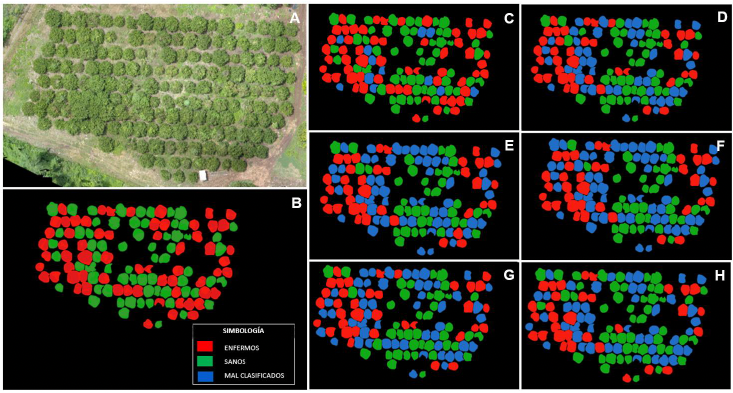
Figure 4. Hard classification for the three crop fields. Champotón field: A1) Overall accuracy considering all correctly classified pixels; A2) Percentage distribution of pixels by class (healthy and diseased plants). Castamay Section 1: B1) Overall accuracy considering all correctly classified pixels; B2) Percentage distribution of pixels by class (healthy and diseased plants). Castamay Section 2: C1) Overall accuracy considering all correctly classified pixels; C2) Percentage distribution of pixels by class (healthy and diseased plants).
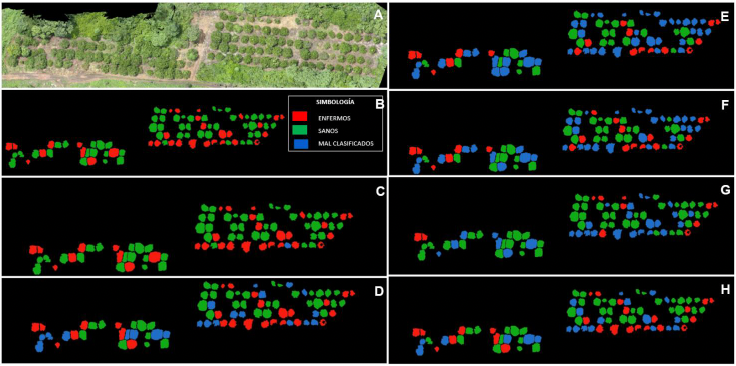
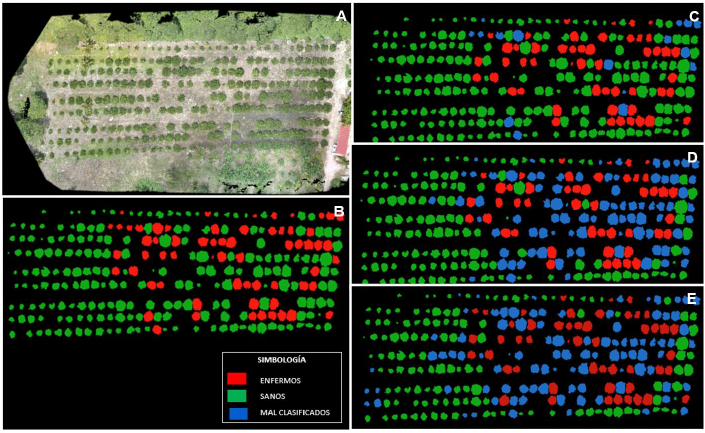
Figure 5. Champotón field in Campeche, Mexico, with a Persian lime crop. Soft classification of the best results on probability scales by algorithm. A) RGB drone image of the Persian lime field; B) Training site, data obtained from field analyses using immunostrips; C) RF with a 56% threshold; D) MAXLIKE with a 50% threshold; E) SVM-RBF with a 29% threshold.
Figure 6. Castamay Section 1 in Campeche, Mexico, with a Persian lime crop. Soft classification of the best results based on the algorithm probability scales. A) RGB drone image of the Persian lime crop; B) Training site, data obtained from field analyses using immunostrips; C) RF with 50% threshold; D) SVM-RBF with 50% threshold; E) SVM-LIN with 50% threshold; F) SVM-SIG with 50% threshold; G) MAXLIKE with 50% threshold; H) SVM-POLY with 50% threshold.
Figure 7. Castamay Section 2, Campeche, Mexico, with a Persian lime crop. Soft classification of the best results based on algorithmic probability scales. A) Drone-captured RGB image of the Persian lime field; B) Training site, with data obtained from field analyses using immunostrips; C) Random Forest results at a 50% membership threshold (MT); D) SVM-RBF with 50% MT; E) SVM-SIG with 50% MT; F) SVM-LIN with 50% MT; G) MAXLIKE with 50% MT; H) SVM-POLY with 51% MT.
  • Vol. 2026, 44(3)
  • Phytopathological Note

In vitro antifungal activity and sensitivity of Neopestalotiopsis rosae isolates to Baccharis salicifolia and Fouquieria splendens extracts

byJesús Eduardo Ramírez Méndez, Meralida Bartolón Pérez, Francisco Daniel Hernández Castillo, Yisa María Ochoa Fuentes, Laura Castro Rosalez, Marco Antonio Tucuch Pérez*

Received: 19/January/2026 – Published: 13/July/2026
DOI: https://doi.org/10.18781/R.MEX.FIT.2601-3

Abstract Background/Objective. Neopestalotiopsis rosae is the causal agent of crown and root rot in strawberry, resulting in significant yield losses. The aim of this study was to evaluate the sensitivity of four N. rosae isolates (466, 323, FREC, and 372) to plant extracts (PEs) obtained from Baccharis salicifolia and Fouquieria splendens, and to determine their in vitro antifungal activity.

Experimental development. A qualitative phytochemical screening was performed to identify the major bioactive compounds present in the PEs. Antifungal activity was evaluated using in vitro microdilution assays at concentrations ranging from 3.9 to 2 000 mg L⁻¹ (10 concentrations). The 50 and 90% inhibitory concentrations (IC₅₀ and IC₉₀) were estimated, and the data were analyzed using analysis of variance (ANOVA) followed by Tukey's multiple comparison test (p ≤ 0.05). The effects of the PEs on fungal cellular structures were also assessed.

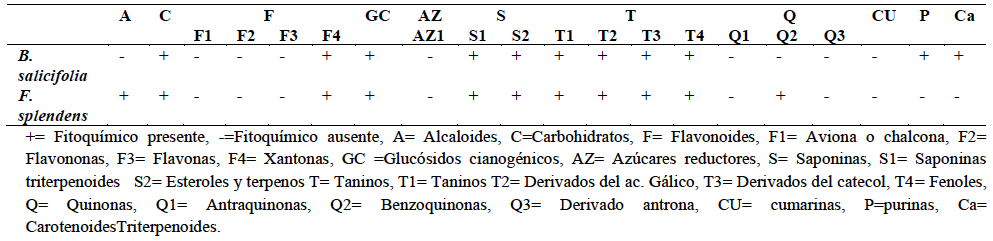
Results. Phytochemical screening revealed the presence of phenolic compounds, saponins, and tannins in both plant extracts. Among the N. rosae isolates, isolates 323 and FREC were the most sensitive, exhibiting complete inhibition with both PEs at 250 mg L⁻¹. In contrast, isolates 372 and 466 required higher concentrations to achieve complete inhibition. B. salicifolia was more effective against isolates 466 and 372, achieving complete inhibition at 1 000 mg L⁻¹, whereas F. splendens required 2 000 mg L⁻¹ to completely inhibit isolate 466. Structural analyses revealed that isolate 323 was most susceptible to extract-induced damage at 250 mg L⁻¹ and above, as evidenced by inhibition of conidial germination and severe morphological alterations, including cellular collapse and dehydration. Isolates FREC and 372 exhibited mycelial thickening at 500 mg L⁻¹, whereas isolate 466 was the least sensitive, showing no evident structural damage even at this concentration.

Conclusions. Plant extracts from B. salicifolia and F. splendens contain bioactive phytochemicals with antifungal activity against N. rosae. Isolates 323 and FREC were the most sensitive, exhibiting 100% inhibition and pronounced structural damage at 250 mg L⁻¹, highlighting the potential of these extracts as biorational alternatives for the management of N. rosae. Nevertheless, further greenhouse and field studies are required to validate their efficacy under commercial production conditions.

Show Figures and/or Tables
Table 1. Identification of phytochemicals present in methanolic extracts of <em>Baccharis salicifolia</em> and <em>Fouquieria splendens</em> using colorimetric assays.
Table 1. Identification of phytochemicals present in methanolic extracts of Baccharis salicifolia and Fouquieria splendens using colorimetric assays.
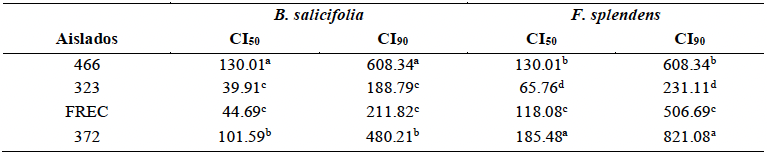
Table 2. Fifty percent and ninety percent inhibitory concentrations (IC₅₀ and IC₉₀) of <em>Neopestalotiopsis rosae</em> isolates treated with <em>Baccharis salicifolia</em> and <em>Fouquieria splendens</em> extracts.
Table 2. Fifty percent and ninety percent inhibitory concentrations (IC₅₀ and IC₉₀) of Neopestalotiopsis rosae isolates treated with Baccharis salicifolia and Fouquieria splendens extracts.
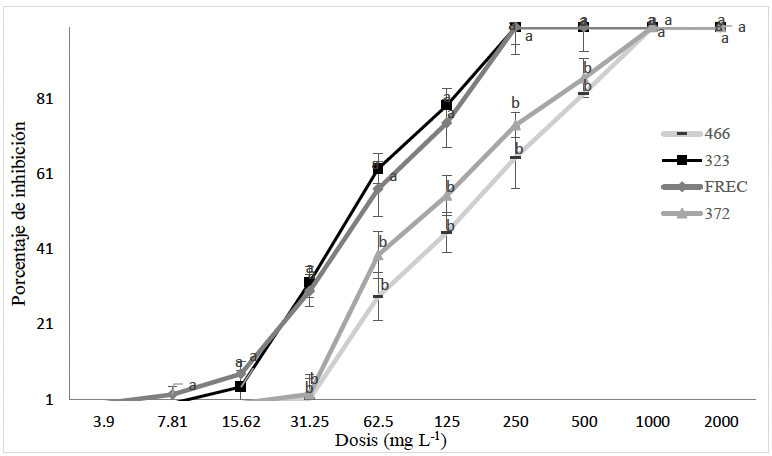
Figure 1. Inhibition percentage of <em>Neopestalotiopsis rosae</em> isolates treated with <em>Baccharis salicifolia</em> extract. *Data followed by the same letter are not significantly different
Figure 1. Inhibition percentage of Neopestalotiopsis rosae isolates treated with Baccharis salicifolia extract. *Data followed by the same letter are not significantly different
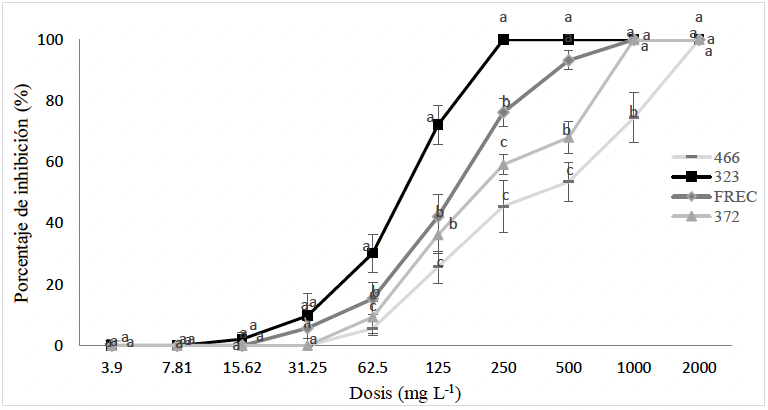
Figure 2. Inhibition percentage of <em>Neopestalotiopsis rosae</em> isolates treated with <em>Fouquieria splendens</em> extract. *Data followed by the same letter are not significantly different.
Figure 2. Inhibition percentage of Neopestalotiopsis rosae isolates treated with Fouquieria splendens extract. *Data followed by the same letter are not significantly different.
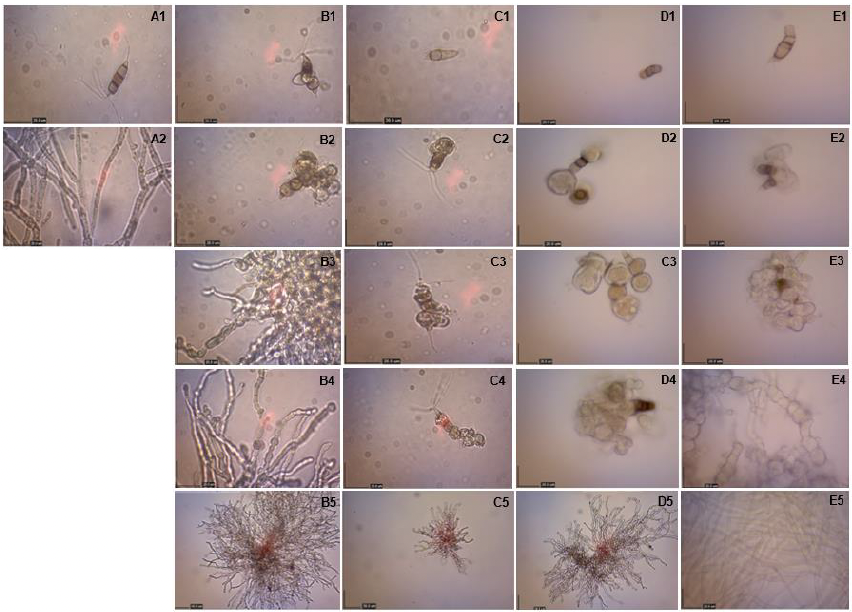
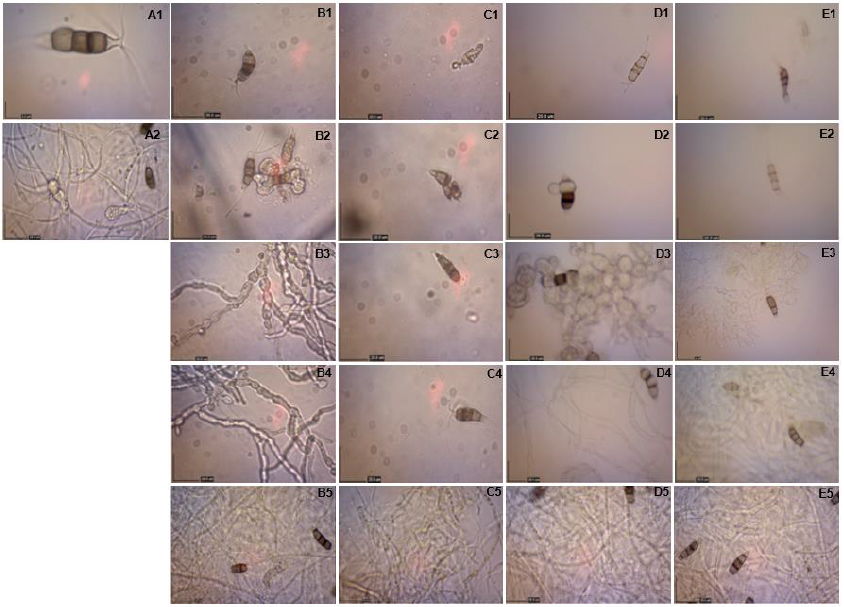
Figure 3. Effect of <em>Baccharis salicifolia</em> extract on the fungal structures of <em>Neopestalotiopsis rosae</em> isolates. A1–A2: untreated control. B1–B5: isolate 466 (2 000, 1 000, 500, 250, and 125 mg L⁻¹); C1–C5: isolate 323 (2 000, 1 000, 500, 250, and 125 mg L⁻¹); D1–D5: isolate FREC (2 000, 1 000, 500, 250, and 125 mg L⁻¹); E1–E5: isolate 372 (2 000, 1 000, 500, 250, and 125 mg L⁻¹). Microscopic observations were performed at 10× and 40× magnification.
Figure 3. Effect of Baccharis salicifolia extract on the fungal structures of Neopestalotiopsis rosae isolates. A1–A2: untreated control. B1–B5: isolate 466 (2 000, 1 000, 500, 250, and 125 mg L⁻¹); C1–C5: isolate 323 (2 000, 1 000, 500, 250, and 125 mg L⁻¹); D1–D5: isolate FREC (2 000, 1 000, 500, 250, and 125 mg L⁻¹); E1–E5: isolate 372 (2 000, 1 000, 500, 250, and 125 mg L⁻¹). Microscopic observations were performed at 10× and 40× magnification.
Figure 4. Effect of <em>Fouquieria splendens</em> extract on the fungal structures of <em>Neopestalotiopsis rosae</em> isolates. A1–A2: untreated control. B1–B5: isolate 466 (2 000, 1 000, 500, 250, and 125 mg L⁻¹); C1–C5: isolate 323 (2 000, 1 000, 500, 250, and 125 mg L⁻¹); D1–D5: isolate FREC (2 000, 1 000, 500, 250, and 125 mg L⁻¹); E1–E5: isolate 372 (2 000, 1 000, 500, 250, and 125 mg L⁻¹). Microscopic observations were performed using 10×, 40×, and 100× objective lenses
Figure 4. Effect of Fouquieria splendens extract on the fungal structures of Neopestalotiopsis rosae isolates. A1–A2: untreated control. B1–B5: isolate 466 (2 000, 1 000, 500, 250, and 125 mg L⁻¹); C1–C5: isolate 323 (2 000, 1 000, 500, 250, and 125 mg L⁻¹); D1–D5: isolate FREC (2 000, 1 000, 500, 250, and 125 mg L⁻¹); E1–E5: isolate 372 (2 000, 1 000, 500, 250, and 125 mg L⁻¹). Microscopic observations were performed using 10×, 40×, and 100× objective lenses
  • Vol. 2026, 44(3)
  • Phytopathological Note

First report of Pseudomonas putida affecting Eryngium spp., case study in Ixtapan de la Sal, State of Mexico

bySantiago Vergara Pineda, Paola S Puga Guzmán, Daniel Mendoza Jiménez, José Antonio Cervantes Chávez*

Received: 09/March/2026 – Published: 22/June/2026
DOI: https://doi.org/10.18781/R.MEX.FIT.2603-2

Abstract Background/Objective. Plant species of the genus Eryngium are native to Mexico; their cultivation as ornamental cut flowers is a recent development, so the pathogens that affect them are largely unknown. In this context, a grower set out to innovate by using this plant as a cut flower but encountered a rot disease that decimated his field; therefore, the objective of this study was to isolate, identify, and characterize the causal agent of soft rot in the stems of Eryngium spp.

Experimental development. Plants exhibiting rot symptoms were collected from a cultivated plot in the municipality of Ixtapan de la Sal, State of Mexico. From ten symptomatic plants kept in a humid chamber, a bacterium was isolated and identified using biochemical analysis. For molecular identification, DNA was extracted, and the 16S ribosomal gene was amplified with primers 27F and 1492R. PCR products were sent to the Advanced Genomics Laboratory at LANGEBIO, CINVESTAV Irapuato, Guanajuato. Koch’s postulates were also performed on twenty asymptomatic Eryngium spp. seedlings, which were inoculated by introducing a bacterial mass at the leaf base, the distal petiole, and the basal vein region.

Results. Based on biochemical analysis, the bacterium was identified as belonging to the genus Pseudomonas; molecular analysis revealed that the bacterium was Pseudomonas putida. According to Koch’s postulates, 100% of the symptoms associated with soft rot were observed.

Conclusion. Pseudomonas putida was confirmed as the causal agent of soft rot in Eryngium spp. Its pathogenicity was confirmed in Eryngium spp. seedlings according to Koch's postulates. This is the first report of P. putida causing this disease in these plants.

Show Figures and/or Tables
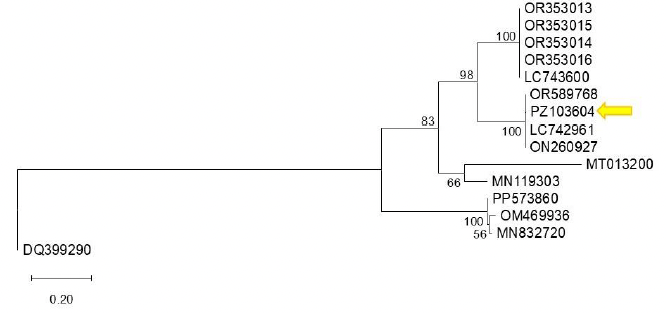
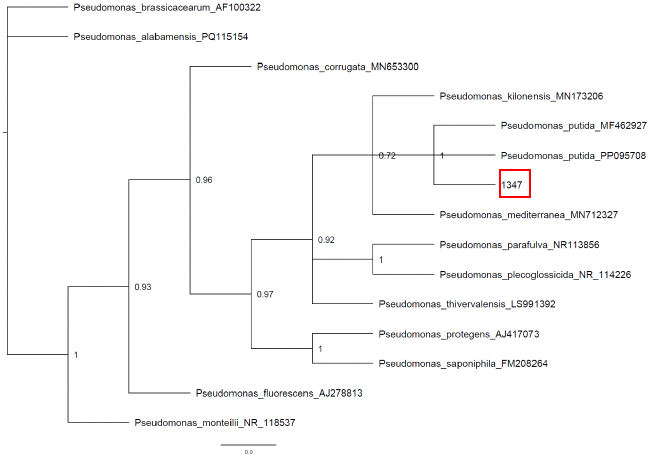
Figure 1. Phylogenetic relationship of bacterial strain 1347 and reference species from the genus <em>Pseudomonas</em>. The strain shows a correlation with <em>Pseudomonas putida</em> (MF462927, PP095708). The phylogenetic tree was constructed by the Maximum Likelihood method using 16S ribosomal DNA gene sequences. Bootstrap values at internal nodes represent support from 100,000 replicates. <em>P. brassicacearum</em> AF100322 and <em>P. alabamensis</em> PQ115154 served as the outgroup.
Figure 1. Phylogenetic relationship of bacterial strain 1347 and reference species from the genus Pseudomonas. The strain shows a correlation with Pseudomonas putida (MF462927, PP095708). The phylogenetic tree was constructed by the Maximum Likelihood method using 16S ribosomal DNA gene sequences. Bootstrap values at internal nodes represent support from 100,000 replicates. P. brassicacearum AF100322 and P. alabamensis PQ115154 served as the outgroup.
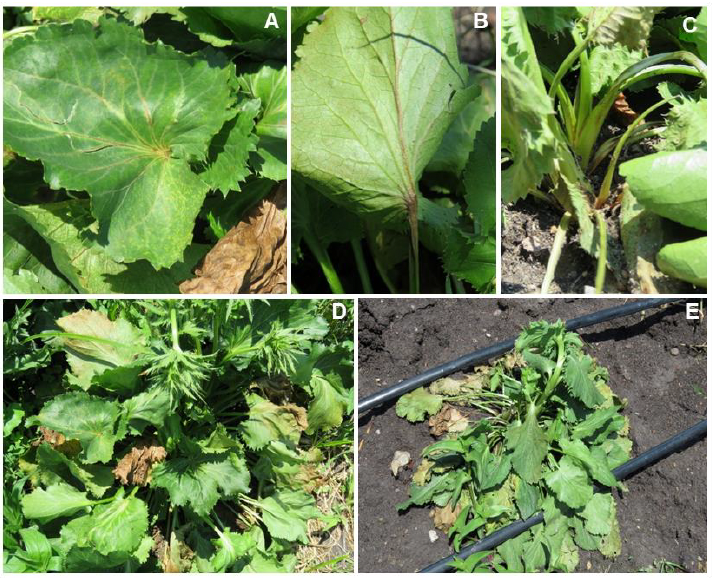
Figure 2. Stages of soft rot development in <em>Eryngium</em> sp. under field cultivation; A) Leaf blade showing necrosis along the main veins; B) Underside of the same leaf with severe necrosis; C) Leaf petioles with necrotic streaks; D) Wilting and death of leaves; E) Wilting of the entire plant.
Figure 2. Stages of soft rot development in Eryngium sp. under field cultivation; A) Leaf blade showing necrosis along the main veins; B) Underside of the same leaf with severe necrosis; C) Leaf petioles with necrotic streaks; D) Wilting and death of leaves; E) Wilting of the entire plant.
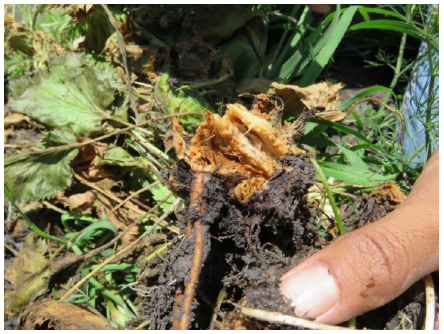
Figure 3. Soft rot in the stem and main root of <em>Eryngium</em> spp. associated with bacteria.
Figure 3. Soft rot in the stem and main root of Eryngium spp. associated with bacteria.
Figure 4. Koch’s postulates in <em>Eryngium</em> spp. seedlings inoculated with bacterial strain 1347; A) Water-soaked lesions at the site of puncture inoculation on the leaf with infectious process the following day; B) Progression of severity on the second day; C) Dead plant on the tenth day; D) Control plant.
Figure 4. Koch’s postulates in Eryngium spp. seedlings inoculated with bacterial strain 1347; A) Water-soaked lesions at the site of puncture inoculation on the leaf with infectious process the following day; B) Progression of severity on the second day; C) Dead plant on the tenth day; D) Control plant.
  • Vol. 2026, 44(2)
  • Scientific Article

In vitro and in planta effect of silicon and phosphites in control of Fusarium oxysporum f. sp. lycopersici causing wilting of tomato

byMagda Rocío Gómez Marroquín*, Sandra L Carmona, Diana Burbano David, Andrea del Pilar Villarreal, Mauricio Soto Suárez, Adriana González Almario

Received: 15/June/2025 – Published: 29/April/2026
DOI: https://doi.org/10.18781/R.MEX.FIT.2401-3

Abstract Background/Objective. Bioactive substances such as phosphites and silicon present a promising alternative for management of vascular wilt of tomato, due to their potential to inhibit pathogen growth and to induce plant defense mechanisms. The objective of this study was to evaluate the effect of three phosphite sources and a source of silicon on isolate Fol59 of Fusarium oxysporum f. sp. lycopersici race 2 via in vitro and in planta assays.

Materials and Methods. In in vitro conditions, percentage of radial growth inhibition (PRGI) of isolate Fol59 was determined in PDA medium supplemented with each bioactive substance in concentrations between 10 and 20 000 ppm following a completely randomized design (4 × 9) with four treatments and nine different concentrations; five technical replicates and three biological replicates. In in planta conditions, the area under the disease progress curve (AUDPC) and efficacy percentage were evaluated with a completely randomized design (4 × 2) with four treatments and two different concentrations under four experimental conditions: control, inoculated control, treatments without inoculation and inoculated treatments. 20 experimental units and three biological replicates were used per treatment.

Results. After seven days, the bioactive substances reduced radial growth of the fungus between 70 and 100% with significant differences among the concentrations. The largest inhibition was registered with silicon at 10 000 ppm (100%) followed by calcium phosphite at 2 000 ppm (99%). Fourteen days post inoculation, in in planta assays, the control showed 100% incidence and 98% severity. However, the potassium phosphite treatment (KPhi1) at 2 000 ppm reduced severity to 56%, which represents a 42% efficacy against the control.

Conclusion. Phosphites and silicon showed inhibitory effect on mycelial growth of the fungus under in vitro conditions. In in planta assays, potassium phosphite at 2 000 ppm was the most effective treatment, reducing the severity of vascular wilt of tomato caused by Fol59.

Show Figures and/or Tables
Table 1. Evaluated bioactive substances in <em>in vitro</em> and <em>in planta</em> assays in tomato (<em>Solanum lycopersicum</em>).
Table 1. Evaluated bioactive substances in in vitro and in planta assays in tomato (Solanum lycopersicum).
Table 2. Concentration of bioactive substances evaluated against <em>Fusarium oxysporum</em> f. sp. <em>lycopersici</em> (<em>Fol59</em>) in <em>in vitro</em> conditions.
Table 2. Concentration of bioactive substances evaluated against Fusarium oxysporum f. sp. lycopersici (Fol59) in in vitro conditions.
Table 3. Concentrations of bioactive substances evaluated in tomato plants under <em>Fusarium oxysporum</em> f. sp. <em>lycopersici</em> inoculated and non-inoculated conditions.
Table 3. Concentrations of bioactive substances evaluated in tomato plants under Fusarium oxysporum f. sp. lycopersici inoculated and non-inoculated conditions.
Table 4. Percentage of radial growth inhibition (PRGI) of <em>Fusarium oxysporum</em> f. sp. <em>lycopersici</em> using phosphites and silicon (KPhi1, KPhi2, CaPhi and Si) at different concentrations under <em>in vitro</em> conditions.
Table 4. Percentage of radial growth inhibition (PRGI) of Fusarium oxysporum f. sp. lycopersici using phosphites and silicon (KPhi1, KPhi2, CaPhi and Si) at different concentrations under in vitro conditions.
Table 5. Incidence and severity percentages caused for<em> Fusarium oxysporum</em> f. sp. <em>lycopersici</em> (<em>Fol59</em>) in tomato plants 14 days after inoculation (dai).
Table 5. Incidence and severity percentages caused for Fusarium oxysporum f. sp. lycopersici (Fol59) in tomato plants 14 days after inoculation (dai).
Figure 1. Effect of different concentrations of phosphites and silicon on mycelial growth of <em>Fol59</em> after seven days of incubation.
Figure 1. Effect of different concentrations of phosphites and silicon on mycelial growth of Fol59 after seven days of incubation.
Figure 2. Area under disease progression curve (AUDPC) 14 days after inoculation, expressed as severity in tomato plants previously treated with bioactive substances (KPhi, CaPhi and Si) and inoculated with isolate <em>Fol59</em>. Bars with the same letter do not show significant differences according to the Tukey test (p ≤ 0.05).
Figure 2. Area under disease progression curve (AUDPC) 14 days after inoculation, expressed as severity in tomato plants previously treated with bioactive substances (KPhi, CaPhi and Si) and inoculated with isolate Fol59. Bars with the same letter do not show significant differences according to the Tukey test (p ≤ 0.05).
Figure 3. Symptoms of vascular wilting in tomato plants 14 days after inoculation (dai). A) Non-inoculated plants, including control and treatments with bioactive substances; B) <em>Fol59</em> inoculated plants, including inoculated control and treatments with bioactive substances.
Figure 3. Symptoms of vascular wilting in tomato plants 14 days after inoculation (dai). A) Non-inoculated plants, including control and treatments with bioactive substances; B) Fol59 inoculated plants, including inoculated control and treatments with bioactive substances.
  • Vol. 2026, 44(2)
  • Phytopathological Note

Potential antagonist of native rhizobacteria of Parkinsonia aculeata on Fusarium spp. associated with native maize varieties from Bajío, Mexico

byLeandris Argentel Martínez, Ofelda Peñuelas Rubio*, Francisco Cervantes Ortíz, Joe Luis Arias Moscoso, Francisco Cadena Cadena, Pamela Romo Rodríguez, Lorenzo Pérez López, Rosario Alicia Fierro Coronado

Received: 15/January/2026 – Published: 29/April/2026
DOI: https://doi.org/10.18781/R.MEX.FIT.2601-2

Abstract Background/Objective. The genus Fusarium comprises some of the most important phytopathogenic fungi affecting maize crops. Fusarium cause diseases such as root, stalk, and ear rot, which negatively impact the crop's agricultural productivity. In the search for agrobiotechnological alternatives for controlling this fungus, this study was aimed to evaluate the antagonistic potential of Parkinsonia aculeata rhizobacteria against Fusarium spp. strains associated with native maize varieties from the Bajío region of Mexico.

Experimental development. Two strains of Fusarium spp. (MC-03 and MC-05), isolated from roots of native maize varieties from the Bajío region of Mexico, exhibiting Fusarium wilt symptoms, were used. These fungi were tested in vitro against nine rhizobacteria of P. aculeata: Enterobacter cloacae (BA1), Priestia megaterium (BA4 and BA-7B), Sinomonas halotolerans (BA10-B), Staphylococcus warneri (BP5), P. endophytica (BP6), Bacillus subtilis (TP1 and TP2), and S. hominis (TM6). Microscopic and macroscopic characterization of the fungal strains and biochemical analysis of the rhizobacteria were performed. Radial growth inhibition of the fungal isolates was determined by triplicate dual fungus-rhizobacteria confrontations. A completely randomized design was used, analyzing the data obtained in the STATISTICA software using an ANOVA based on a linear model of fixed effects and a mean comparison test by DMS (p>0.05).

Results. With the exception of P. endophytica (BP6), all rhizobacteria exhibited enzymatic activity related to fungal antagonism mechanisms. B. subtilis (TP1) produced glucanases, lipases, and proteases. Microscopic and macroscopic characterization of the fungal strains indicated that they belong to Fusarium spp. In the rhizobacteria-MC-03 confrontation, the B. subtilis bacterial strains (TP1 and TP2) were statistically similar and achieved the greatest inhibition of mycelial growth (23%). With the fungal strain MC-05, P. endophytica (BP6) and S. hominis (TM6) were statistically superior to the other rhizobacteria in inhibiting mycelial growth (17%), followed by the two B. subtilis strains (TP1 and TP2), which inhibited 10% and 17%, respectively.

Conclusion. There was a significant variability in the mycelial growth response of the fungi to rhizobacteria. B. subtilis (TP1 and TP2), S. hominis (TM6), and P. endophytica (BP6) exhibited an antagonistic effect, inhibiting the mycelial growth of Fusarium spp. strains by up to 23% compared to the absolute and commercial controls. This study establishes the preliminary scientific basis for obtaining a biofungicide with specific inhibitory capabilities against the fungi studied.

Show Figures and/or Tables
Table 1. Biochemical characterization of rhizobacteria isolated from palo verde (<em>Parkinsonia aculeata</em>).
Table 1. Biochemical characterization of rhizobacteria isolated from palo verde (Parkinsonia aculeata).
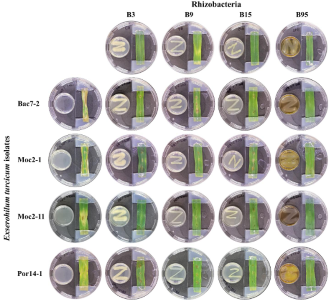
Figure 1. Diagram of the dual fungus-rhizobacteria confrontation assay. a) Distribution of microorganisms in the Petri dish; b-c) Macroscopic characteristics of the nine bacteria [<em>E. cloacae</em> (BA1), <em>P. megaterium</em> (BA4 and BA7B), <em>S. halotolerans</em> (BA10B), <em>S. warneri</em> (BP5), <em>P. endophytica</em> (BP6), <em>S. hominis</em> (TM6), <em>B. subtilis</em> (TP1 and TP2)] and two fungi (MC-03 and MC-05), respectively.
Figure 1. Diagram of the dual fungus-rhizobacteria confrontation assay. a) Distribution of microorganisms in the Petri dish; b-c) Macroscopic characteristics of the nine bacteria [E. cloacae (BA1), P. megaterium (BA4 and BA7B), S. halotolerans (BA10B), S. warneri (BP5), P. endophytica (BP6), S. hominis (TM6), B. subtilis (TP1 and TP2)] and two fungi (MC-03 and MC-05), respectively.
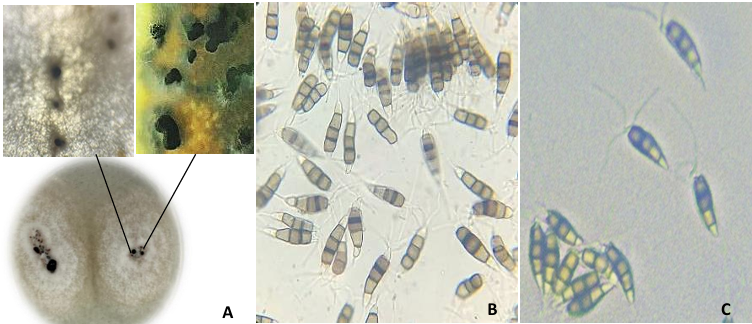
Figure 2. Morphological characterization of <em>Fusarium</em> fungal strains. A) Macroscopic characteristics of the fungal strains: front (top) and back (bottom) views of Petri dishes with PDA medium 10 days after sowing; B and C) Mycelial and conidial structures observed by optical microscopy at 40 and 100X (with immersion oil), from microculture at 5 days after sowing and stained with lactophenol blue (Riddell, 1950).
Figure 2. Morphological characterization of Fusarium fungal strains. A) Macroscopic characteristics of the fungal strains: front (top) and back (bottom) views of Petri dishes with PDA medium 10 days after sowing; B and C) Mycelial and conidial structures observed by optical microscopy at 40 and 100X (with immersion oil), from microculture at 5 days after sowing and stained with lactophenol blue (Riddell, 1950).
Figure 3. Mycelial growth exhibited by the <em>Fusarium</em> spp. strains MC-03 (a) and MC-05 (b) during dual confrontations with antagonistic bacteria. The treatments are shown on the Y-axis: CA: absolute control; CC: commercial control; antagonistic bacteria: BA1 (<em>E. cloacae</em>), BA4 and BA7B (<em>P. megaterium</em>), BA10B (<em>Sinomonas halotolerans</em>), BP5 (<em>S. warneri</em>), BP6 (<em>P. endophytica</em>), TM6 (<em>S. hominis</em>), TP1 and TP2 (<em>B. subtilis</em>).
Figure 3. Mycelial growth exhibited by the Fusarium spp. strains MC-03 (a) and MC-05 (b) during dual confrontations with antagonistic bacteria. The treatments are shown on the Y-axis: CA: absolute control; CC: commercial control; antagonistic bacteria: BA1 (E. cloacae), BA4 and BA7B (P. megaterium), BA10B (Sinomonas halotolerans), BP5 (S. warneri), BP6 (P. endophytica), TM6 (S. hominis), TP1 and TP2 (B. subtilis).
  • Vol. 2026, 44(2)
  • Phytopathological Note

Detection of a tentative alphanucleorhabdovirus infecting Carica papaya in Costa Rica

byLaura Garita Salazar, William Villalobos Muller, Mauricio Montero Astúa, Antonio Bogantes Arias, Teresita Coto Morales, Izayana Sandoval Carvajal, Lisela Moreira Carmona*

Received: 11/February/2026 – Published: 29/April/2026
DOI: https://doi.org/10.18781/R.MEX.FIT.2602-3

Abstract Background/Objective. Foliar chlorosis, short internodes, and curved petioles with purple streaks were observed in papaya (Carica papaya) crops (North and Atlantic regions) in Costa Rica since 2014. Identification of a putative plant virus associated with these symptoms was the aim of this research.

Experimental development. Plant material was tested by ELISA (four plant viruses and potyviruses group), transmission electron microscopy (TEM), RT-PCR (degenerate primers for plant viruses), sequencing and phylogenetics.

Results. All ELISA tests resulted negative. Bullet-shaped particles inside nuclei, and reticulum endoplasmic were only observed by TEM in symptomatic plants. Amplicons of 900 bp were consistently obtained from symptomatic samples using degenerate primers for plant rhabdoviruses. Nucleotide sequences showed 95.6 and 96.8% similarity to a putative papaya alphanucleorhabdovirus (Alphanucleorhabdovirus, Rhabdoviridae).

Conclusion. This is the first report of a putative alphanucleorhabdovirus associated with symptomatic papaya plants showing streaked petiole ("pecíolo rayado") disease in Costa Rica, but Koch's postulates must be fulfilled and vector identified.

Show Figures and/or Tables
Table 1. Oligonucleotides (primers) and thermocycling profiles used to detect RNA plant viruses in <em>Carica papaya</em> plants analyzed in this study.
Table 1. Oligonucleotides (primers) and thermocycling profiles used to detect RNA plant viruses in Carica papaya plants analyzed in this study.
Table 2. Summary of tests performed and results obtained from foliar samples of symptomatic and asymptomatic <em>Carica papaya</em> plants collected in Costa Rica to determine whether any plant virus is associated with
Table 2. Summary of tests performed and results obtained from foliar samples of symptomatic and asymptomatic Carica papaya plants collected in Costa Rica to determine whether any plant virus is associated with "streaked petiole" disease.
Figure 1. Morphological alterations observed in <em>Carica papaya</em> plants with
Figure 1. Morphological alterations observed in Carica papaya plants with "streaked petiole" disease in Costa Rica. A) A symptomatic plant (arrow) exhibiting downward-curved petioles, leaf reduction in the apical meristem, and cessation of fruit set. Adjacent (slightly behind) two healthy plants (right) showing prolific fruit development and typical foliar architecture; B) Detailed view of upper part of a symptomatic plant showing leaf reduction in the apical meristem, leaf petiole curved, and poor fruit setting, behind (left) a healthy plant with normal fruit production; C) Detailed view of upper part of a healthy plant; D) Petioles of a diseased plant displaying purple-colored streaks; E) Comparison between petioles from symptomatic (top) and healthy (bottom) plants.
Figure 2. Nucleus of a leaf parenchyma cell of <em>Carica papaya</em> symptomatic plant with "streaked petiole" disease observed with transmission electron microscopy.<strong> A</strong>) Bullet-shaped particles inside membranous vesicles in the nucleus; <strong>B</strong>) Detail of particles seen into the perinuclear space; <strong>C</strong>) Detail of viral particles into the packages scattered in the nucleus. C= cytoplasm, M= mitochondria, N= nucleus, Nu= nucleolus, inm= inner nuclear membrane, mv= membranous vesicle filled of viral particles, onm= outer nuclear membrane, vp= viral particles.
Figure 2. Nucleus of a leaf parenchyma cell of Carica papaya symptomatic plant with "streaked petiole" disease observed with transmission electron microscopy. A) Bullet-shaped particles inside membranous vesicles in the nucleus; B) Detail of particles seen into the perinuclear space; C) Detail of viral particles into the packages scattered in the nucleus. C= cytoplasm, M= mitochondria, N= nucleus, Nu= nucleolus, inm= inner nuclear membrane, mv= membranous vesicle filled of viral particles, onm= outer nuclear membrane, vp= viral particles.
Figure 3. Phylogenetic tree constructed with partial sequences (900 nt) of the viral RNA-dependent RNA polymerase (L gene) of a putative alphanucleorhabdovirus obtained from <em>Carica papaya</em> of Costa Rica (GB Acc. No. PX637683 to PX637686) with 31 different plant rhabdoviruses (34 sequences) and Farmington virus (GB Acc. No. KC602379) as outgroup, all of them retrieved from GenBank. These were aligned with ClustalW algorithm using BioEdit v.7.7.1, and phylogeny inferred with the maximum likelihood method in Mega 12 (General Time Reversible model with a gamma distributed rate of substitution with invariant sites) and a bootstrap of 1 000 replicates.
Figure 3. Phylogenetic tree constructed with partial sequences (900 nt) of the viral RNA-dependent RNA polymerase (L gene) of a putative alphanucleorhabdovirus obtained from Carica papaya of Costa Rica (GB Acc. No. PX637683 to PX637686) with 31 different plant rhabdoviruses (34 sequences) and Farmington virus (GB Acc. No. KC602379) as outgroup, all of them retrieved from GenBank. These were aligned with ClustalW algorithm using BioEdit v.7.7.1, and phylogeny inferred with the maximum likelihood method in Mega 12 (General Time Reversible model with a gamma distributed rate of substitution with invariant sites) and a bootstrap of 1 000 replicates.
  • Vol. 2026, 44(2)
  • Phytopathological Note

Potential transmission of grapevine red blotch virus (Grablovirus vitis, Geminiviridae) by Nearctic treehopper (Tortistilus wickhami) in Baja California, Mexico

byCynthia Ford Villalón, David Schneider, Idalia Montesinos Solano, Jimena Carrillo Tripp*

Received: 13/December/2025 – Published: 23/April/2026
DOI: https://doi.org/10.18781/R.MEX.FIT.2512-4

Abstract Background/Objective. Grapevine red blotch virus, GRBV (Grablovirus vitis) affects grapevine plants (Vitis vinifera) causing significant economic losses in vineyards. In Mexico, where GRBV has been reported in wine-producing regions such as Baja California, information on potential GRBV vectors remains limited. Although the three-cornered alfalfa hopper (Spissistilus festinus) is a confirmed vector in the USA, the role of other membracids in vineyards around the globe is still unclear. Recently, the Nearctic treehopper (Tortistilus wickhami) has been reported in Baja California, prompting this study to evaluate its potential for GRBV acquisition and transmission.

Experimental development. Adult Nearctic treehoppers were collected from February to November 2023 in 20 vineyards in Valle de Guadalupe, Baja California. A total of 30 individuals were screened to detect GRBV by real-time PCR. In May 2024, 17 additional individuals were collected and used in transmission assays, with an acquisition access period of up to 4 days on GRBV-infected grapevine cv. Cabernet Sauvignon leaves, followed by an inoculation access period of up to 9 days on virus-free leaves. Both insects and recipient leaves were tested for GRBV by real-time PCR.

Results. GRBV was detected in 6.7% (2/30) of the individuals collected in 2023, with positive insects only originating from vineyards confirmed as GRBV-positive. In the transmission assays, 53% (9/17) of the insects acquired viral particles after feeding on infected leaves; however, none of the recipient leaves showed detectable infection.

Conclusion. This study demonstrates that the Nearctic treehopper, an insect phylogenetically close to, and morphologically resemblant of the three-cornered alfalfa treehopper (a confirmed GRBV vector), was able to acquire the virus in the field and in laboratory settings, but no transmission to recipient plants was proved under the tested experimental conditions in the laboratory.

Show Figures and/or Tables
Table 1. Taxonomic identification of treehoppers collected at survey sites, and GRBV molecular detection.
Table 2. Results of the transmission assay for GRBV (<em>Grablovirus vitis</em>) by adult Nearctic leafhoppers.
Table 2. Results of the transmission assay for GRBV (Grablovirus vitis) by adult Nearctic leafhoppers.
Figure 1. Schematic representation of the GRBV transmission assay. Insects were first allowed to feed on excised leaves from a GRBV-donor grapevine, then transferred to recipient excised leaves from GRBV-free grapevines to assess potential virus transmission. Individual leaves were maintained in water. Dashed lines indicate the removal of dead insects from inside the cage for GRBV detection at the end of the assay. The schematic diagram was constructed using some elements from BioRender.
Figure 2. Transmission assay. A) Example of adult Nearctic treehoppers manually collected from a vineyard, used in the transmission assay. Photo credit: Kyara Acosta Ramos. B) interior view of a cage during the viral particle acquisition phase. The cage design facilitated insect–leaf interaction. A portion of the petioles were submerged in sterile water inside 2 mL vials sealed with parafilm, keeping the leaf in a vertical position. C) Ringing mark on the petiole of a recipient leaf caused by mechanical damage after feeding by a Nearctic treehopper.
More Papers…

Inicia Sesión