Click on the cite to copy
-
Or Copy link


Article filters
Search Papers:
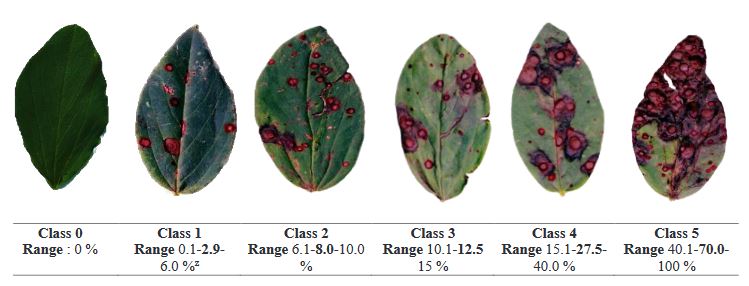
Diagrammatic scale to quantify the severity of Ascochyta blight in broad bean crops
By Ernesto Alonso López Reyes, Álvaro Castañeda Vildózola*, Jesús Ricardo Sánchez Pale, Alejandra Contreras Rendón, Juyma Mayvé Fragoso Benhumea, Rómulo García Velasco
*Corresponding Author.
Received: 15/September/2022 – Published:
26/December/2023
DOI:
https://doi.org/10.18781/R.MEX.FIT.2209-4
-
Or Copy link
Abstract Background/Objective. The objective of this study was to design and validate a diagrammatic severity scale of brown spot on broad bean.
Materials and Methods. We collected 120 leaflets with different level of brown spot damage from commercial crops in the Toluca Valley, which were visually selected based on the expressed symptomology. Sixty leaflets were scanned for evaluation with the software APS PRESS ©Assess 2.0 to determine the real severity value for each leaflet.
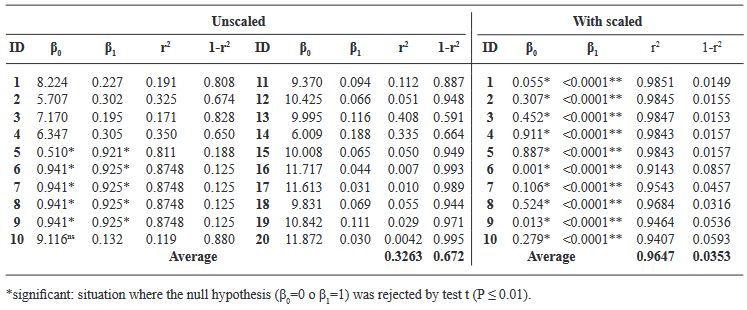
Results. The damage values allowed us to generate a diagrammatic scale consisting of six different classes: 0(0.0), 1(0.1-6.0), 2(6.1-10.0), 3(10.1-15.0), 4(15.1-40.0), 5(> 40.1-100). The leaflets were visually examined by evaluators who had no prior experience. The results from each evaluator were analyzed with a simple linear regression, obtaining r2 values from 0.0042 to 0.8748, β0 de 0.51 a 9.11, y β1 de 0.132 a 0.925. Using a scale, r2 values were obtained 0.9143 to 0.985, β0 de 0.001 a 0.911 y β1<0.001.
Conclusion. The generated diagrammatic severity scale was validated and reproducible, showing high reliability.
Keywords: Symptoms, damage, evaluation, reproducibility