RMF Logo

Article filters

Search Papers:

For searching before 2024 see Archive (2000-2023)
  • Vol. 2025, 43(1)
  • Scientific Article

Estimation of losses caused by Potato virus Y in potato crop in Coahuila

By Joel De Santiago Meza*, Gustavo Alberto Frías Treviño, Luis Alberto Aguirre Uribe, Alberto Flores Olivas

*Corresponding Author.

Received: 05/April/2024 – Published: 30/December/2024
DOI: https://doi.org/10.18781/R.MEX.FIT.2404-2

  • PDF
  • HTML
  • XML

Abstract Background/Objective. The objective was to experimentally evaluate the losses caused by PVY in the Fianna variety potato crop and, consequently, estimate the losses caused by this virus in the potato-producing area of Coahuila.

Materials and Methods. Furrows of an experimental plot planted with potato seedling and seed-tuber, were mechanically inoculated with PVY at 20, 40, 60 and 80 days after emergence. The tubers produced were harvested and losses in each treatment were evaluated. Additionally, in four commercial potato fields in this same state, leaflet samples were taken at 20, 40, 60 and 80 days after the emergence, and the percentage of plants infected with PVY was evaluated by ELISA tests. Loss data from the experimental plot and incidence data from the farms were used to develop a statistical model to estimate losses caused by PVY in the Coahuila region.

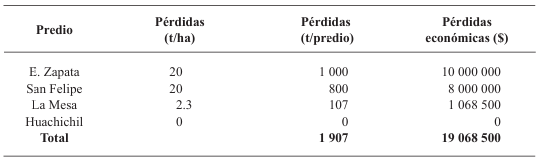
Results. Yield losses due to PVY in the experimental plot were 9.4% to 53%. The percentage of incidence of infected plants in commercial properties varied from 0% to 100%. The model that best fit the data obtained was Berger's Y=1/[1+e (-{ln[yo/(1-y0)]+r*dae})]. The estimated losses in the Coahuila region in the 2022 cycle were 18%, equivalent to $19 068500.

Conclusión: This information highlights the importance of using certified PVY-free seed and protecting the crop from emergence until 60 DAE.

Keywords: Epidemiology, viruses, diagnostic, serology
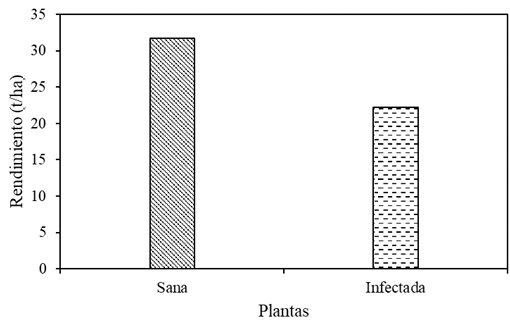
Figure 1. Yield per hectare of Fianna potato plants in Assay 1.
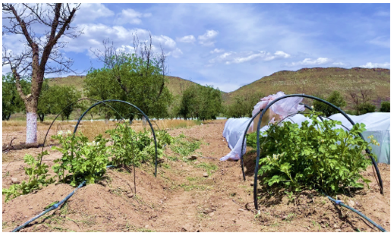
Figure 2. Left: plants grown from tuber seed infected with PVY; right: plants grown from PVY-free tuber seed.
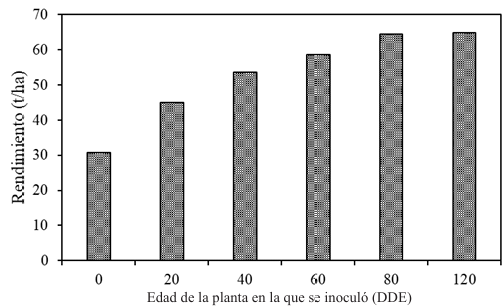
Figure 3. Yield per hectare of plants grown from infected tuber seed (0), plants inoculated at 20, 40, 60, and 80 DAE, and healthy plants (remained healthy throughout the 120-day cycle).
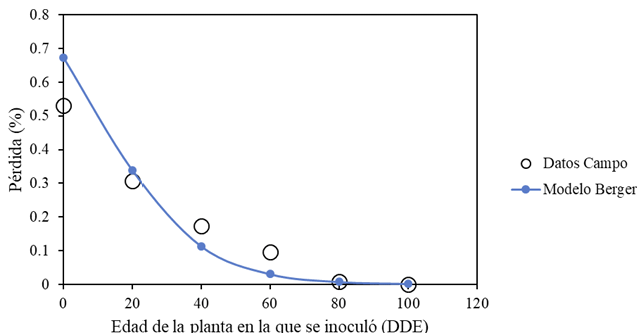
Figure 4. Fit of the Berger model explaining 98% of the variation in losses relative to the date of PVY infection (days after emergence - DAE).
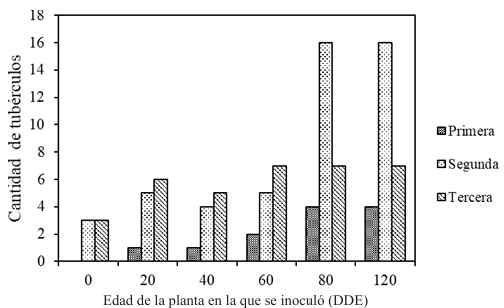
Figure 5. Quantity and quality of tubers produced by plants grown from infected tuber seed (0), plants inoculated at 20, 40, 60, and 80 days after emergence (DAE), and healthy plants.
Figure 6. Tubers produced by: A) plants grown from infected tuber seed; B) plants inoculated at 20 DAE; C) plants inoculated at 40 DAE; D) plants inoculated at 60 DAE; E) plants inoculated at 80 DAE; F) healthy plants (no inoculation).
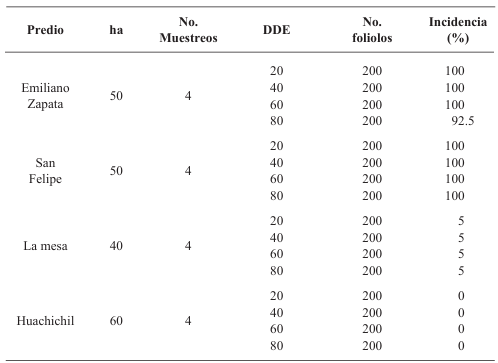
Table 1. Percentage of infected plants in commercial fields; ha = hectares, No. Samples = number of samples per field, DAE = days after emergence, No. Leaflets = number of leaflets.
Table 2. Estimated yield and economic losses in the potato-producing region of Coahuila.