Distribution of Candidatus Liberibacter asiaticus in the canopy and roots of Citrus sinensis under asymptomatic condition
By
Gustavo Mora Aguilera*,
Gerardo Acevedo Sánchez,
Verónica Martínez Bustamante,
Viridiana López Bautista,
Ma. Alejandra Gutiérrez Espinosa,
Pedro Robles García
*Corresponding Author.
Received: 20/June/2025 – Published:
27/December/2025
DOI:
https://doi.org/10.18781/R.MEX.FIT.2506-2
Abstract Background/Objective. This study analyzed for the first time the asymptomatic condition induced by CLas in Citrus sinensis / C. aurantium based on initial reports in the Central Gulf region of Mexico. The objective was to analyze with a mechanistic approach the spatial-temporal concentration of CLas at the plant level in commercial orchards to demonstrate the possible implication of a prolonged incubation period (IP) in the asymptomatic expression of HLB.
Materials and Methods. Two out of three trees (A1-A3) (>30 years old) of asymptomatic Valencia sweet orange trees positive for CLas, identified through official diagnostic protocols in San José Acateno, Puebla, were confined. On trees A2 and A3, 13 and 16 secondary branches were marked, with a total of 112 and 108 foliage/samples per month, respectively (total 1540 samples), obtained from the distal and proximal parts of each branch. Seven monthly samplings of plant material were carried out between May and December. At the root level, three categories were sampled by diameter/function and by a combination of six distal trunk sectors (0 - 280 cm) by 4 in depth (0 x 110 cm) with a total of 111 samples. DNA extraction was performed with 2% CTAB and quantification by qPCR (oligos, HLBp/HLBas).
Results. In canopy, the incidence / branche in A3 was 52.2% (Ct = 22.7 – 34.9), and in A2 47.8% (Ct = 23.4 –35), with no statistical difference (p = 0.48). The inoculum load was 1.6 (±1.3) log-CLas, equivalent to 109 copies/reaction in 100 mL (range in number of copies 6.3 to 68,870.7). CLas did not differ between distal (1.6 log) and proximal (1.5 log) samples (p = 0.33). Significative temporal fluctuation was found between June and October in positive samples (37 – 87, p < 0.0001), but not in CLas concentration (1.6 – 3.5 log-CLas, p > 0.72). The distribution of CLas by branch had a temporal effect (p = 0.0001) and by sector (p = 0.07), showing high mobility and seasonality. The maximum concentration (Ymax) was associated with the middle-upper sector of the canopy, and high mobility towards the lower and upper sectors in Yinitial and Yfinal. In roots, 38.7% positivity was found. The detectability of CLas was homogeneous among root types (p < 0.0001) but variable in concentration (p = 0.04). The 47.6, 15.4, and 38.7% incidence was associated with 38.3, 43.4, and 9.5 average CLas copies for support, conduction, and absorption roots, respectively (p = 0.0001). Two sections with higher CLas intensity-concentration (80 – 144 copies) were associated with roots in the middle drip zone (160 – 240 cm) and medium depth strata (50 – 80 cm).
Conclusion. CLas was significantly and consistently detected in plant and root tissue throughout the experimental period, but at fluctuating, non-incremental concentration, analogous between trees A2 and A3. The wide canopy-root distribution suggests a chronic systemic effect. Consequently, the incubation period does not determine the asymptomatic condition in the sweet orange/sour orange productive system investigated. Other factors, e.g. inherent to pathogen variability, could be involved. These results contribute to optimizing a surveillance-monitoring system considering seasonality, zone-branch, sector-canopy and type of tissue, with a greater probability of detection of CLas even in an eventual asymptomatic condition and generate new insights for Clas management. This is the first work that analyzes PI mechanistically, at canopy and root level, in initial detections in Mexico of asymptomatic-HLB in productive adult trees of Valencia C. sinensis / C. aurantium under field conditions.
Keywords:
CLas, HLB, Inoculum load, Sweet orange, Sour orange
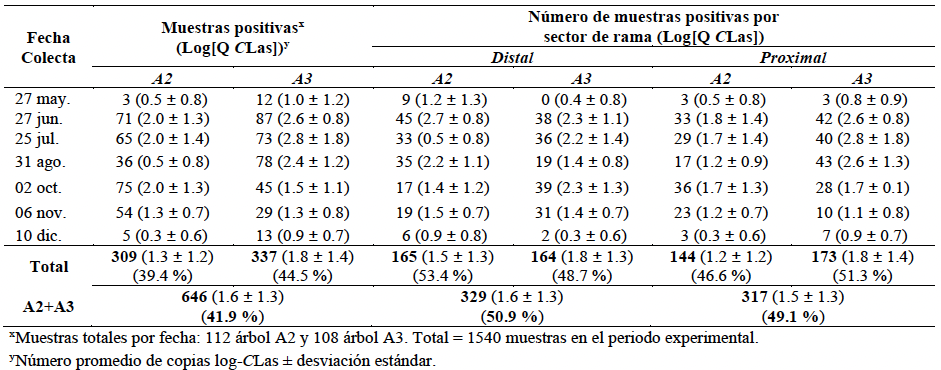
Table 1. Comparison of the number of qPCR positive samples in seven monthly dates carried out on HLB-asymptomatic canopy of Citrus sinensis Valencia trees (A2 and A3) during May–December, and inoculum load distribution (CLas) in proximal and distal sections on selected and marked branches for bacterium monitoring.
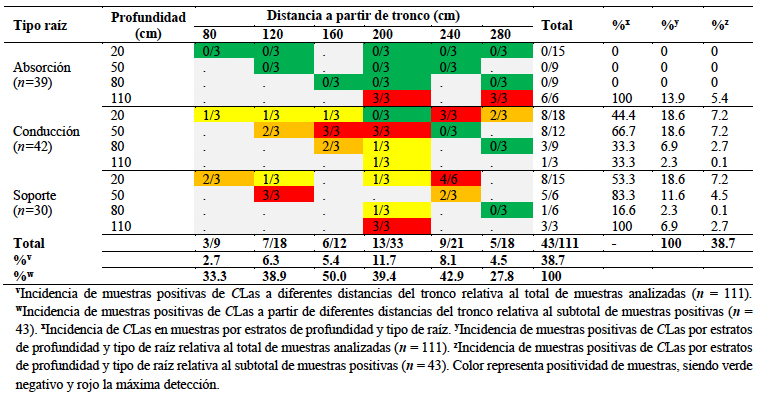
Table 2. Number and percentage of samples qPCR positive for CLas in HLB-asymptomatic C. sinensis / C. aurantium A3-tree with respect to root type, four soil depths and six distances from the trunk.

Figure 1. HLB-asymptomatic qPCR CLas positive Valencia Citrus sinensis / C. aurantium orange tree confinement. A. Metal confinement structure (8 x 8 x 8 m) with aphid-proof netting. The structures included a key-restricted access door; B. HOBO U23 Pro V2 sensor for temperature (°C) and relative humidity (RH), programmed to take measurements at 30-minute intervals withing the confinement area; C. Davis Vantage weather station for measuring complementary climate variables such as precipitation, wind speed and direction, evapotranspiration, etc.

Figure 2. A. Valencia C. sinensis / C. aurantium tree HLB-asymptomatic CLas-positive confined in cages with aphid-proof netting. The red and yellow strips show the selection and marking of primary (red) and secondary (yellow) branches for proximal or distal section monthly sampling from May - December. B. Example of the method for numbering branches in clockwise order. C. Structure of a citrus branch for selection of proximal and distal leaves. A total of 1540 samples were qPCR analyzed / A2 and A3 trees.
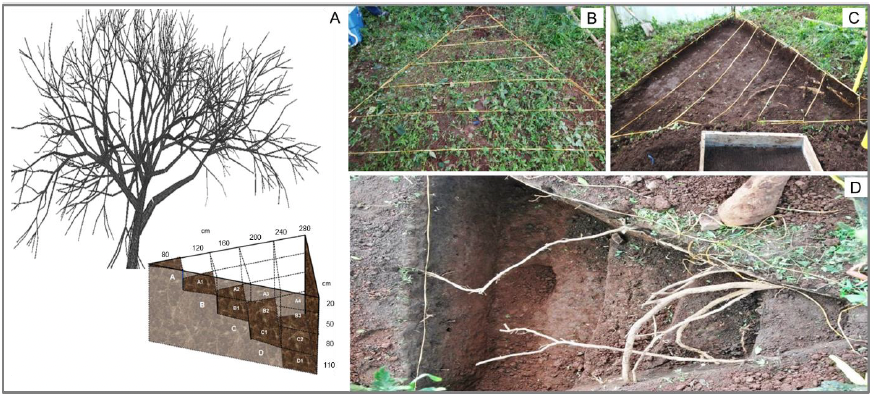
Figure 3. 3D-sectional system used for root sampling of HLB-asymptomatic qPCR positive A3-tree of C. sinensis / C. auranium. A. Design used for root sampling considering the distance proximal to the trunk and up to the drip zone (0 - 280 cm) and four depths (0 - 110 cm). B. Design and marking of the excavation strata. C. Delimitation of the excavation area and soil sifting from different strata. D. Excavated sections for three type-root sampling used in CLas quantification by qPCR. A total of 24 bulk soil sections were sampled (6 x 4) and 111 samples qPCR analyzed.
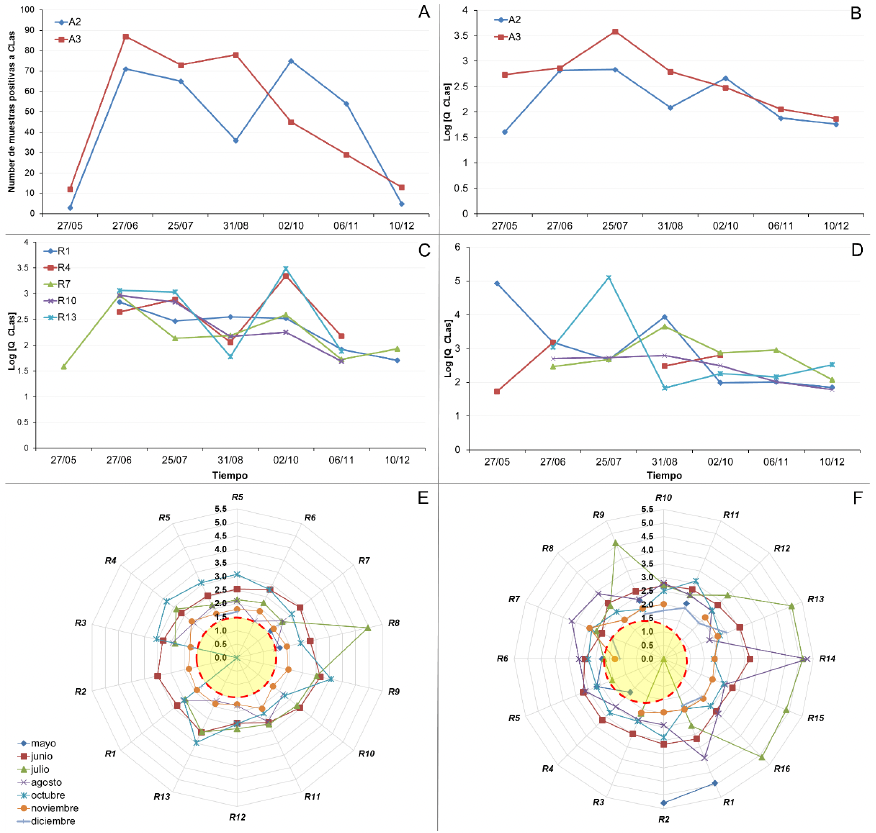
Figure 4. A. Number of qPCR CLas positive samples per tree (A2 and A3) detected on seven monthly sampling dates on Valencia C. sinensis / C. aurantium HLB-asymptomatic. B. Temporal fluctuation of bacterial concentration in 21 total branches of trees A2 and A3. C-D. Temporal fluctuation of CLas at the branch level. The example of 5/13 branches for A2 (C) and 5/16 for A3 (D) is shown. E-F. Temporal fluctuation of CLas per branch and A2-tree (E) y A3 (F). Red dotted circle shows the minimum threshold (log-CLas) for quantification of CLas copies in positive samples.
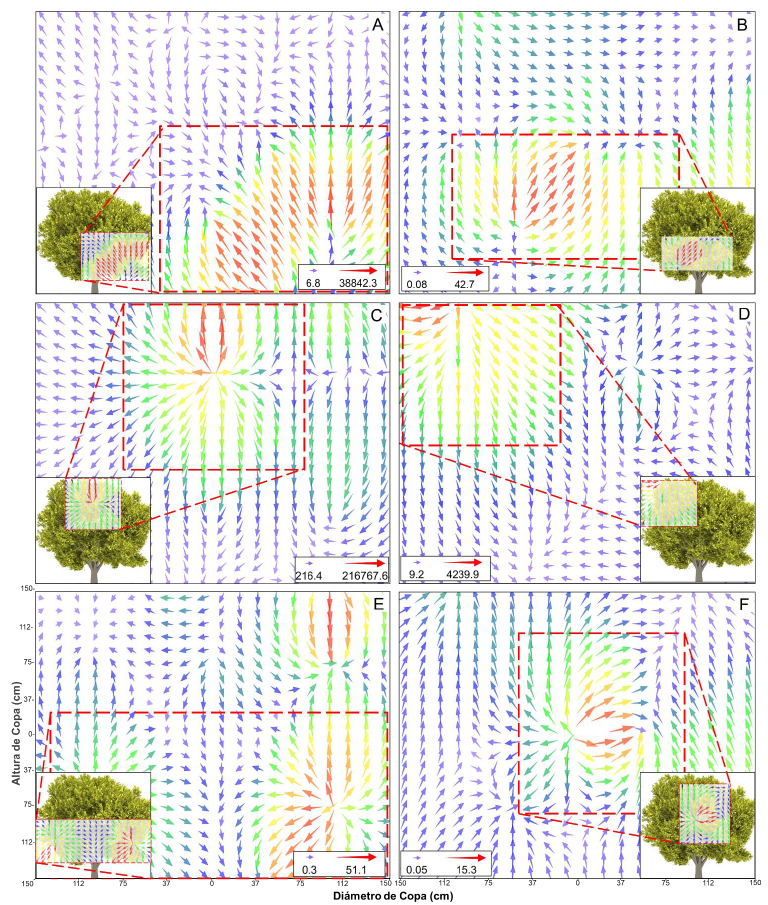
Figure 5. Canopy spatial CLas distribution and movement on HLB asymptomatic trees of Valencia C. sinensis / C. aurantium. A, C, and E. Vector interpolation map representing the bacteria load and directionality for three epidemic moments Yi (May), Ymax (July), and Yf (December), respectively, in A3-tree; and B, D, and F for A2-tree. The size and color of vectors show the inoculum load trend in the canopy. On bottom boxes, the numbers of bacterium copies relate to the arrows size and color as reference measure. The directionality of the vector shows a simulation of the movement of the bacteria at the plant canopy level. Remarqued dotted sections indicate a higher CLas concentration.
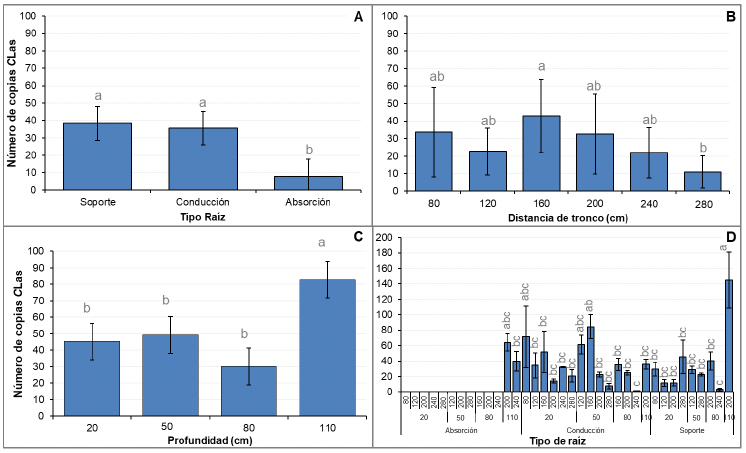
Figure 6. A. Quantification of CLas by root type: support, conduction, and absorption in HLB-asymptomatic C. sinensis / C. aurantium A3-tree. B. Quantification of CLas in six sectional distances from the trunk between 80 and 240 cm. C. Quantification of CLas in four sectional soil depth between 20–110 cm. D. Quantification of CLas integrating the three factors of root type, distance, and depth. Standard deviation bars with different letters were statistically different using ANOVA and Tukey's mean comparison (p = 0.05).
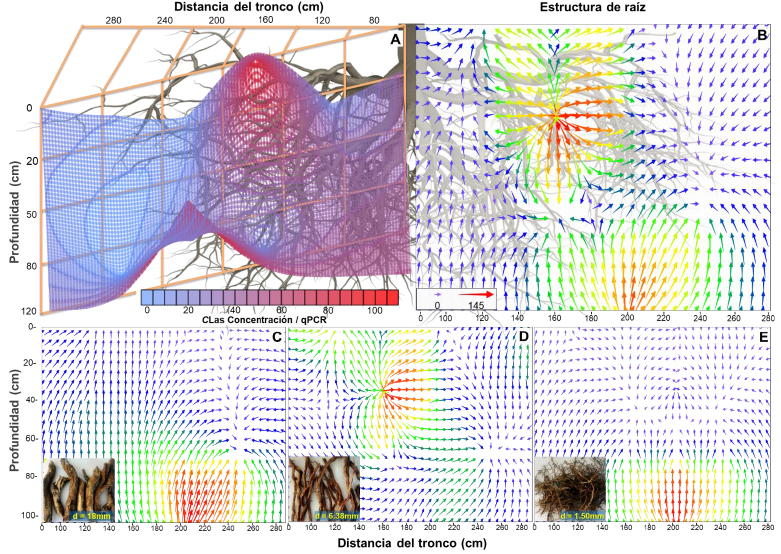
Figure 7. A. 3D wireframe geostatistical interpolative analysis of the quantification of CLas associated to a 3D sectional sampling system in support (d = 18 mm), conduction (d = 6.3 mm), and absorption roots (d = 1.5 mm) in Valencia C. sinensis / C. aurantium A3-tree. B-E. Grid Vector Map geostatistical analysis to represent the concentration and mobility of CLas bacterium load in total root samples (B), support (C), conduction (D), and absorption (E). The vector size and color show the inoculum load by root type and spatial sector. The directionality and magnitude (size) of vectors show the simulation of CLas mobility and concentration on the root structure. On bottom box (B), the numbers of bacterium copies relate to the arrows size and color as reference measure.