RMF Logo

Article filters

Search Papers:

For searching before 2024 see Archive (2000-2023)
  • Vol. 2026, 44(1)
  • Scientific Article

Antifungal activity using ZnO microparticles with different morphologies against Rhizoctonia sp.

By Flor A Macías Mendoza, Laila Muñoz Castellanos, Juan C Pantoja Espinoza, Francisco Paraguay Delgado*

*Corresponding Author.

Received: 08/August/2025 – Published: 13/November/2025
DOI: https://doi.org/10.18781/R.MEX.FIT.2508-1

  • PDF
  • HTML
  • XML

Abstract Background/Objective. The main objective of the study was to synthesize zinc oxide (ZnO) microparticles (MP) with three types of morphologies (prisms, platelets, and rods) in order to assess their antifungal activity against Rhizoctonia sp. It was hypothesized that morphology and concentration were key factors influencing antifungal efficacy. To suggest the potential of customized nanoparticle design in the treatment of fungal diseases.

Materials and Methods. The ZnO MPs were synthesized using the hydrothermal method, designed to obtain three morphologies: prisms, platelets, and rods. They were characterized using scanning electron microscopy (SEM) and X-ray diffraction (XRD). Antifungal activity was evaluated at concentrations of 200, 500, and 1000 ppm against Rhizoctonia sp. Statistical analysis was performed using ANOVA and Fisher's LSD test to evaluate the effects of morphology, concentration and time on fungal growth.

Results. At concentrations of 500 and 1000 ppm of MPs, show significant inhibition of Rhizoctonia sp. was observed. While at 200 ppm, no significant inhibition was observed compared to the negative control. Sclerotia formation was observed at the lowest concentration in all samples, especially in those with lamellar morphology (ZnO-L) up to 500 ppm. Microscopic evaluation at 200 ppm also revealed structural damage to the hyphae and cytoplasmic condensation. However, this was not observed in the 1000 ppm treatments. Among the different morphologies, ZnO rods (ZnO-R) showed the most effective antifungal activity.

Conclusion. Particles with elongated morphology (rods) showed promising antifungal activity against Rhizoctonia sp. The efficacy increased at concentrations of 500 and 1000 ppm, resulting in significant inhibition of fungal growth. The morphology and concentration of the particles are key factors influencing antifungal growth. This result demonstrates that particle morphology plays a crucial role in controlling fungal diseases.

Keywords: Zinc oxide, Pathogenic fungi, Hydrothermal synthesis, SEM, XRD, Mycelial inhibition
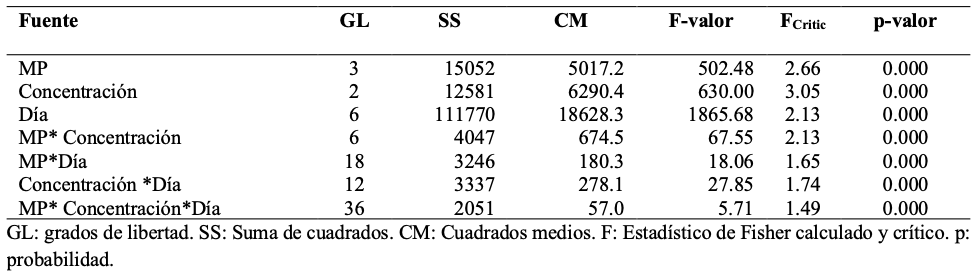
Table 1. ANOVA summary for mycelial growth (mm) as a function of microparticle type, concentration, and incubation days.
Figure 1. Images of the three morphologies of ZnO particles obtained by SEM, ZnO-P (A, D), ZnO-L (B, E), and ZnO-R (C, F). Size distribution: ZnO-P (G), ZnO-L (H), and ZnO-R (I).
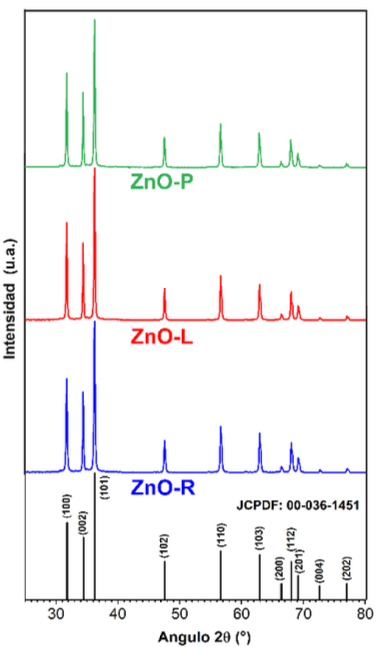
Figure 2. X-ray Diffraction (XRD) patterns of the three zinc oxide samples: ZnO-P (green), ZnO-L (red), and ZnO-R (blue). All diffraction peaks match the hexagonal wurtzite structure of ZnO (reference JCPDF: 00-036-1451).
Figure 3. The growth (mm) of <em>Rhizoctonia</em> sp. over time (days) for the samples. (A) ZnO-P, (B) ZnO-L, (C) ZnO-R in comparison to ICF (D) and the Negative Control (E). The labels (A, B, and C) in the graphics mean A: is at 1000 ppm, B: is at 500 ppm, and C: is at 200 ppm.
Figure 3. The growth (mm) of Rhizoctonia sp. over time (days) for the samples. (A) ZnO-P, (B) ZnO-L, (C) ZnO-R in comparison to ICF (D) and the Negative Control (E). The labels (A, B, and C) in the graphics mean A: is at 1000 ppm, B: is at 500 ppm, and C: is at 200 ppm.
Figure 4. Macroscopic morphology of aerial mycelium. <em>Rhizoctonia</em> sp. on PDA Agar with Nanoparticles – images were acquired at the seventh day inspection, (A) ZnO-P, (B) ZnO-L, (C) ZnO-R in comparison to ICF (D), and the Negative Control (E). The column labels (A, B, and C) in the graphics represent the following concentrations: A, 1000 ppm; B, 500 ppm; and C, 200 ppm. The numbers labelled 1, 2, and 3 mean the number of repetitions.
Figure 4. Macroscopic morphology of aerial mycelium. Rhizoctonia sp. on PDA Agar with Nanoparticles – images were acquired at the seventh day inspection, (A) ZnO-P, (B) ZnO-L, (C) ZnO-R in comparison to ICF (D), and the Negative Control (E). The column labels (A, B, and C) in the graphics represent the following concentrations: A, 1000 ppm; B, 500 ppm; and C, 200 ppm. The numbers labelled 1, 2, and 3 mean the number of repetitions.
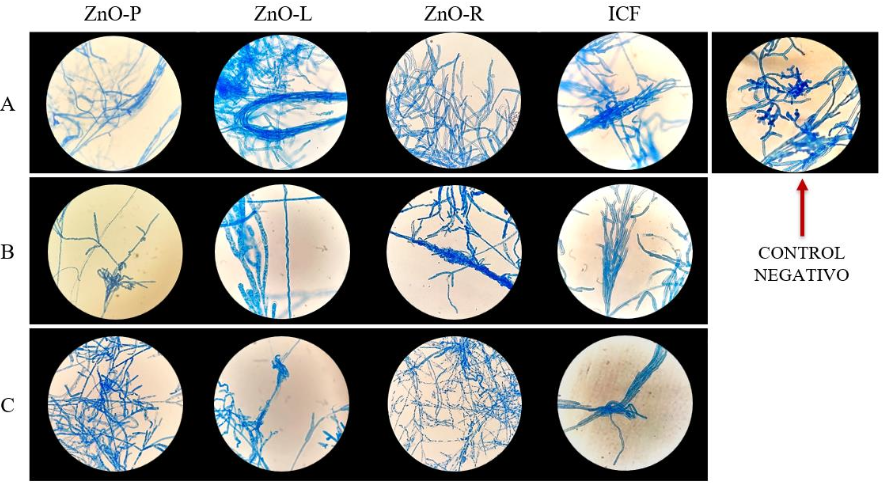
Figure 5. Microscopic Morphology of <em>Rhizoctonia</em> sp. on PDA Agar with Concentrations of A: 1000 ppm, B: 500 ppm, and C: 200 ppm of MPs; ZnO-P, ZnO-L, ZnO-R in comparison to ICF and the Negative Control after 7 days of growth. The optical microscope magnification was 40X. Lactophenol Blue.
Figure 5. Microscopic Morphology of Rhizoctonia sp. on PDA Agar with Concentrations of A: 1000 ppm, B: 500 ppm, and C: 200 ppm of MPs; ZnO-P, ZnO-L, ZnO-R in comparison to ICF and the Negative Control after 7 days of growth. The optical microscope magnification was 40X. Lactophenol Blue.
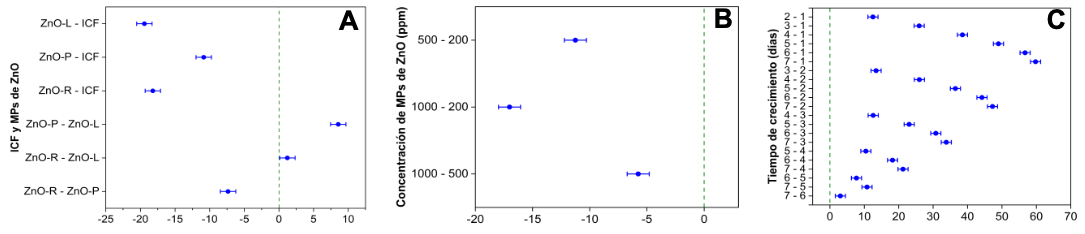
Figure 6. Differences of Means test for Growth (mm) by Fisher´s LSD test comparison of (A) treatments, (B) concentrations, and (C) between days.