RMF Logo

Article filters

Search Papers:

For searching before 2024 see Archive (2000-2023)
  • Vol. 2026, 44(3)
  • Scientific Article

Detection of Closterovirus tristezae in Persian lime using machine learning and drones

By Maribel Reyes García, Remigio Anastacio Guzmán Plazola*, Reyna Isabel Rojas Martínez, Victoria Ayala Escobar, Héctor Flores Magdaleno

*Corresponding Author.

Received: 03/October/2025 – Published: 17/July/2026
DOI: https://doi.org/10.18781/R.MEX.FIT.2510-2

  • PDF
  • HTML
  • XML

Abstract Background/Objective. Persian lime (Citrus latifolia) production in Mexico is threatened by various diseases. Among the most significant is the citrus tristeza virus (Closterovirus tristezae, CTV), which can infect plants asymptomatically. This research aimed to evaluate the use of drone-acquired multispectral imagery and machine learning algorithms to identify diseased plants as a tool for early, non-destructive detection.

Materials and Methods. The study was conducted in three agricultural fields in Campeche, México: Champotón and Castamay (sections 1 and 2). Multispectral images (green, red, red-edge, and near-infrared) were acquired, and spectral signatures, vegetation indices (NDVI, GNDVI, NDRE, SIPI), and principal components (PCA) were extracted. Supervised classifiers—Random Forest (RF), Maximum Likelihood (MAXLIKE), Support Vector Machine (SVM), and Multilayer Perceptron (MLP)—were applied using hard and soft classification schemes.

Results. RF performed the best. In hard classification, it achieved overall accuracies of 64% in Champotón and Castamay Section 1, and 65% in Section 2, with diseased plant detection rates between 65 and 75%. It yielded better results in soft classification. In Champotón, it achieved 94% overall accuracy and detected 79% of diseased plants. In Castamay Section 1, the figures were 91 and 92%, respectively; and in Section 2, it achieved 99% overall accuracy and 100% disease detection.

Conclusion. Random Forest demonstrated the most robust and stable performance across the various scenarios and fields analyzed—in both hard classification (65%) and soft classification (94%)—confirming its ability to handle non-linear relationships and spectral variability in real agricultural environments. The use of multispectral imagery combined with machine learning algorithms—specifically Random Forest (RF) for soft classification—represents an effective tool for early diagnosis of CTV in Persian lime.

Keywords: Citrus latifolia, CTV, Machine learning, Early detection
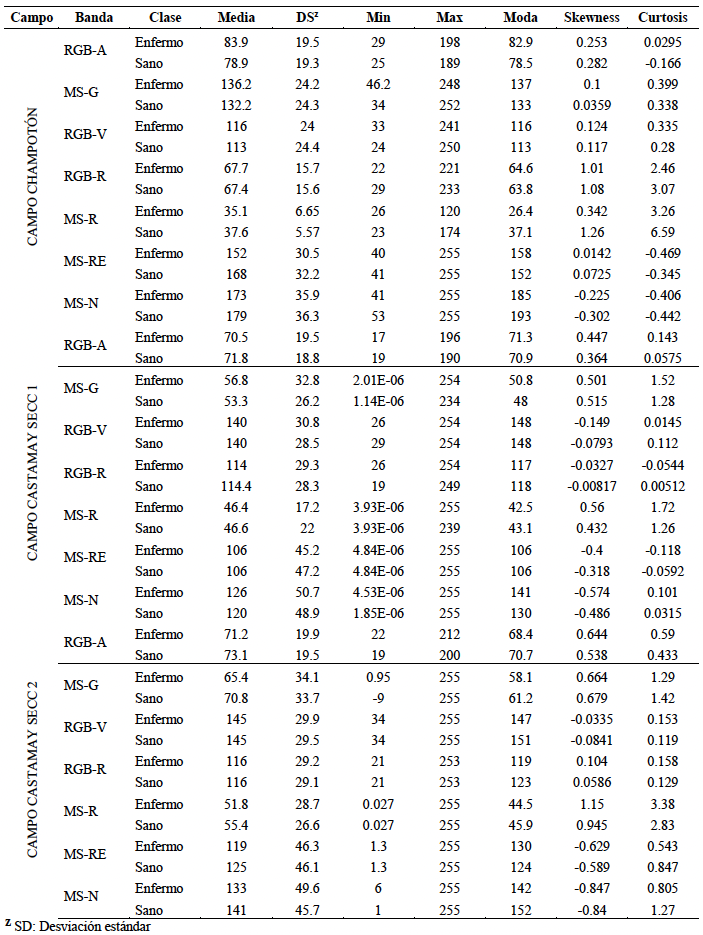
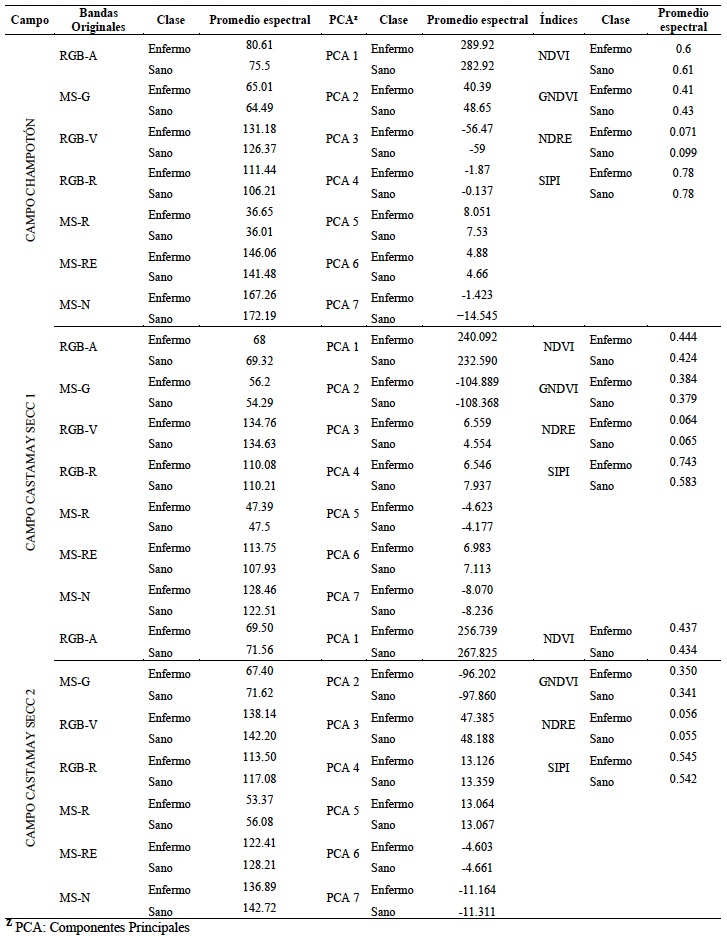
Table 1. Statistical summary of spectral values by band and class across the three fields evaluated in commercial Persian lime plantations.
Table 2. Mean values of variables derived from the images (original bands, principal components, and vegetation indices) in the three fields analyzed in commercial Persian lime plantations.
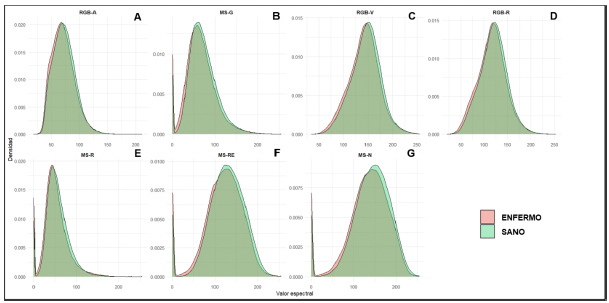
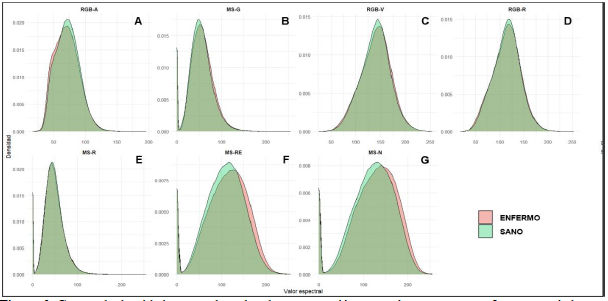
Figure 1. Spectral density curves by band: comparison between healthy plants and those infected with <em>Closterovirus tristezae</em> (CTV) in the Champotón, Campeche field.
Figure 1. Spectral density curves by band: comparison between healthy plants and those infected with Closterovirus tristezae (CTV) in the Champotón, Campeche field.
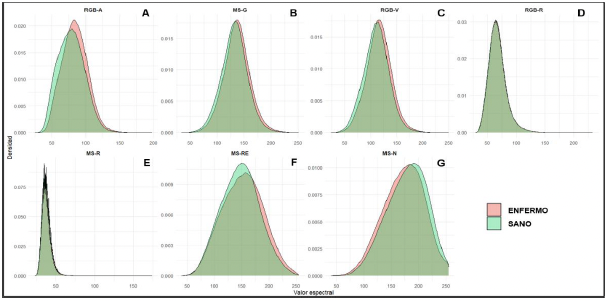
Figure 2. Spectral density curves by band: comparison between healthy plants and those infected with <em>Closterovirus tristezae</em> (CTV) in the Castamay Section 1 field, Campeche.
Figure 2. Spectral density curves by band: comparison between healthy plants and those infected with Closterovirus tristezae (CTV) in the Castamay Section 1 field, Campeche.
Figure 3. Spectral density curves by band: comparison between healthy plants and those infected with <em>Closterovirus tristezae</em> (CTV) in the Castamay Section 2 field, Campeche.
Figure 3. Spectral density curves by band: comparison between healthy plants and those infected with Closterovirus tristezae (CTV) in the Castamay Section 2 field, Campeche.
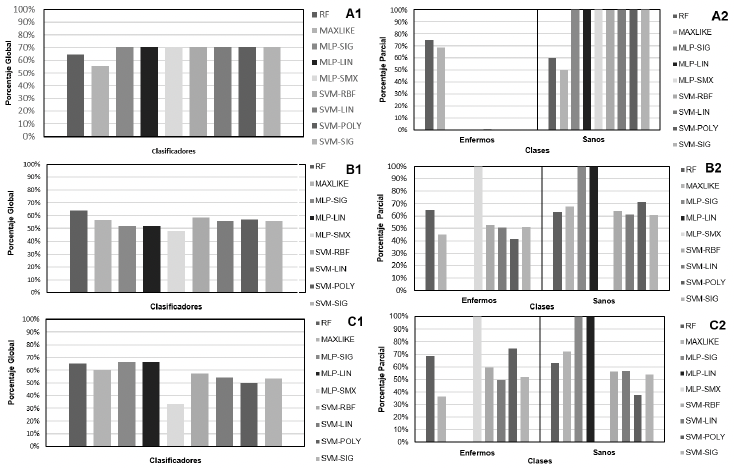
Figure 4. Hard classification for the three crop fields. Champotón field: A1) Overall accuracy considering all correctly classified pixels; A2) Percentage distribution of pixels by class (healthy and diseased plants). Castamay Section 1: B1) Overall accuracy considering all correctly classified pixels; B2) Percentage distribution of pixels by class (healthy and diseased plants). Castamay Section 2: C1) Overall accuracy considering all correctly classified pixels; C2) Percentage distribution of pixels by class (healthy and diseased plants).
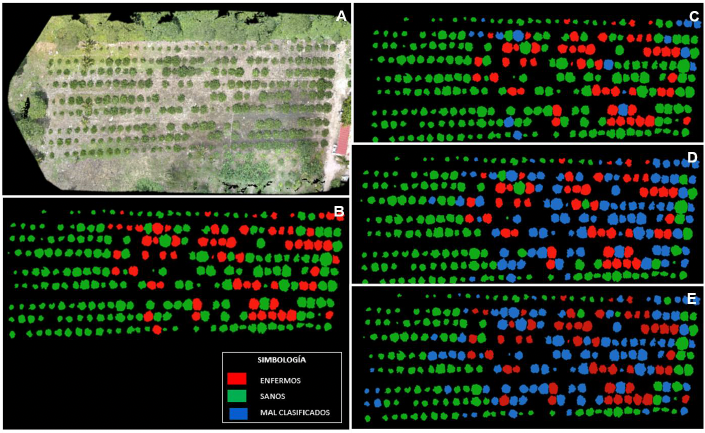
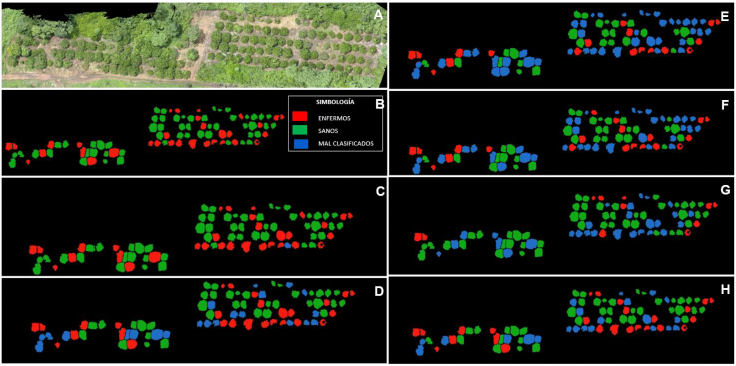
Figure 5. Champotón field in Campeche, Mexico, with a Persian lime crop. Soft classification of the best results on probability scales by algorithm. A) RGB drone image of the Persian lime field; B) Training site, data obtained from field analyses using immunostrips; C) RF with a 56% threshold; D) MAXLIKE with a 50% threshold; E) SVM-RBF with a 29% threshold.
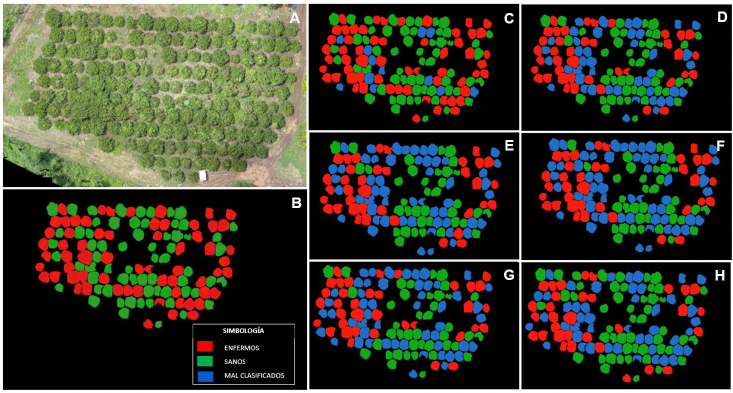
Figure 6. Castamay Section 1 in Campeche, Mexico, with a Persian lime crop. Soft classification of the best results based on the algorithm probability scales. A) RGB drone image of the Persian lime crop; B) Training site, data obtained from field analyses using immunostrips; C) RF with 50% threshold; D) SVM-RBF with 50% threshold; E) SVM-LIN with 50% threshold; F) SVM-SIG with 50% threshold; G) MAXLIKE with 50% threshold; H) SVM-POLY with 50% threshold.
Figure 7. Castamay Section 2, Campeche, Mexico, with a Persian lime crop. Soft classification of the best results based on algorithmic probability scales. A) Drone-captured RGB image of the Persian lime field; B) Training site, with data obtained from field analyses using immunostrips; C) Random Forest results at a 50% membership threshold (MT); D) SVM-RBF with 50% MT; E) SVM-SIG with 50% MT; F) SVM-LIN with 50% MT; G) MAXLIKE with 50% MT; H) SVM-POLY with 51% MT.