RMF Logo

Article filters

Search Papers:

For searching before 2024 see Archive (2000-2023)
  • Vol. 2026, 44(2)
  • Phytopathological Note

Development and validation of a diagrammatic scale to assess the severity of cucumber downy mildew

By Juan Carlos Gonzalez Acevedo, Santiago Domínguez Monge*, Dagoberto Guillen Sánchez, Víctor López Martínez, Porfirio Juárez López, Irán Alia Tejacal, Julio David Mendoza García

*Corresponding Author.

Received: 05/January/2026 – Published: 06/March/2026
DOI: https://doi.org/10.18781/R.MEX.FIT.2601-1

  • PDF
  • HTML
  • XML

Abstract Background/Objective. Cucumber downy mildew (Cucumis sativus), caused by Pseudoperonospora cubensis, is one of the major foliar diseases affecting cucumber production in Morelos, Mexico. Due to the lack of standardized and validated methods for quantifying disease severity, the objective of this study was to develop and validate a diagrammatic scale for its assessment.

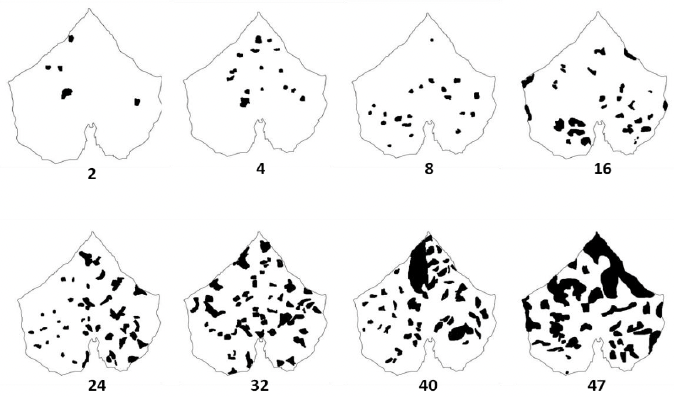
Experimental development. A diagrammatic scale composed of eight severity levels (2, 4, 8, 16, 24, 32, 40, and 47% affected leaf area) was developed using naturally infected leaves whose actual severity was determined through digital image analysis with Assess®️ software. Validation of the scale was conducted with the participation of 20 raters, who visually estimated the severity of 50 leaves with different damage levels in three successive evaluations: one without the aid of the scale (WO) and two with the aid of the scale conducted two (A1) and four weeks (A2) after the initial evaluation.

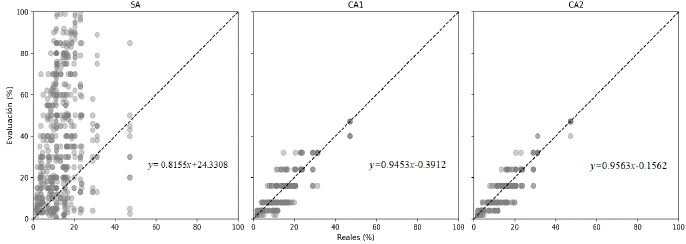
Results. The use of the diagrammatic scale significantly increased the accuracy of severity estimates, with Pearson´s correlation coefficients of r = 0.91 and r = 0.93 in A1 and A2, respectively, compared to the evaluation without the scale (r = 0.34). Likewise, generalized bias was lower when the scale was used (Cb > 0.9), which was reflected in greater overall agreement between visual estimates and real severity values (ρc > 0.9).

Conclusion. The developed diagrammatic scale is a reliable, accurate, and reproducible tool for estimating cucumber downy mildew severity under field conditions.

Keywords: Cucumis sativus, Downy mildew, Foliar disease, Phytopathometry, Severity
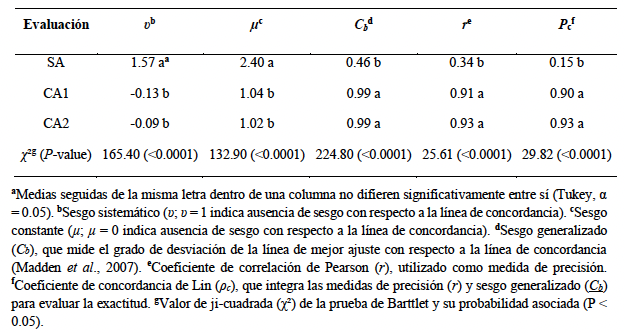
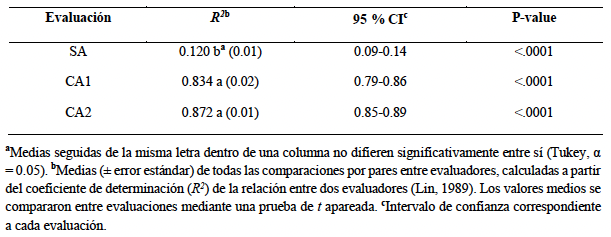
Table 1. Analysis of the generalized linear model and separation of means of the statistics of Lin’s concordance analysis used to evaluate accuracy (systematic and constant bias), precision (Pearson’s correlation coefficient, <em>r</em>) and overall concordance (Lin’s concordance coefficient, <em>ρ<sub>c</sub></em>) of the estimated percentages of the severity of downy mildew (<em>Pseudoperonospora cubensis</em>) in the cucumber, performed by 20 unexperienced raters in three successive assessments: without the aid of the diagrammatic scale (WO) and with the aid of the scale two weeks (A1) and four weeks (A2) after the initial assessment.
Table 1. Analysis of the generalized linear model and separation of means of the statistics of Lin’s concordance analysis used to evaluate accuracy (systematic and constant bias), precision (Pearson’s correlation coefficient, r) and overall concordance (Lin’s concordance coefficient, ρc) of the estimated percentages of the severity of downy mildew (Pseudoperonospora cubensis) in the cucumber, performed by 20 unexperienced raters in three successive assessments: without the aid of the diagrammatic scale (WO) and with the aid of the scale two weeks (A1) and four weeks (A2) after the initial assessment.
Table 2. Measures of reliability between raters of the estimations of the severity of downy mildew (<em>Pseudoperonospora cubensis</em>) carried out by 20 unexperienced raters in three successive assessments: without the aid of the diagrammatic scale (WO) and with the aid of the diagrammatic scale two (A1) and four weeks (A2) after the initial assessment.
Table 2. Measures of reliability between raters of the estimations of the severity of downy mildew (Pseudoperonospora cubensis) carried out by 20 unexperienced raters in three successive assessments: without the aid of the diagrammatic scale (WO) and with the aid of the diagrammatic scale two (A1) and four weeks (A2) after the initial assessment.
Figure 1. Scale developed for the severity of downy mildew from <em>Pseudoperonospora cubensis</em> in cucumber leaves. Numbers in the diagrams represent the percentage (%) of the area of the leaf with necrotic symptoms of the disease.
Figure 1. Scale developed for the severity of downy mildew from Pseudoperonospora cubensis in cucumber leaves. Numbers in the diagrams represent the percentage (%) of the area of the leaf with necrotic symptoms of the disease.
Figure 2. Relationship between estimates and real severity of the downy mildew (<em>Pseudoperonospora cubensis</em>) by 20 inexperienced raters for a set of 50 evaluated leaves (n=1000). The first assessment was carried out without the diagrammatic scale (WO), followed by two additional assessments performed two (A1) and four weeks (A2) later, using a diagrammatic scale that represents levels of severity between 2 and 47% of the leaf area affected. Dotted lines indicate the concordance line (<em>y</em> = <em>x</em>).
Figure 2. Relationship between estimates and real severity of the downy mildew (Pseudoperonospora cubensis) by 20 inexperienced raters for a set of 50 evaluated leaves (n=1000). The first assessment was carried out without the diagrammatic scale (WO), followed by two additional assessments performed two (A1) and four weeks (A2) later, using a diagrammatic scale that represents levels of severity between 2 and 47% of the leaf area affected. Dotted lines indicate the concordance line (y = x).
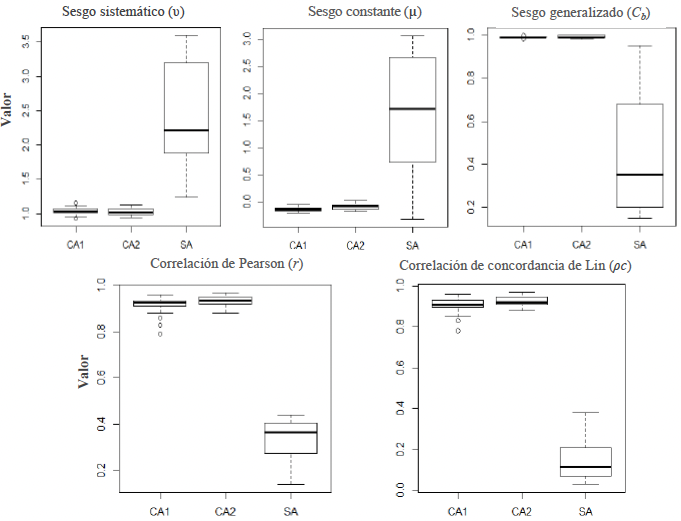
Figure 3. Distribution, mean and standard deviation of the statistics from Lin’s concordance analysis used to evaluate accuracy (systematic and constant bias), precision (Pearson’s correlation coefficient, <em>r</em>) and concordance (Lin’s concordance correlation coefficient, <em>ρ<sub>c</sub></em>) of the estimations of severity of downy mildew (<em>Pseudoperonospora cubensis</em>) carried out by 20 unexperienced raters in the successive assessments, The first assessment was performed without the aid of the scale (WO), followed by two assessments with the scale two (A1) and four weeks (A2) after the initial assessment.
Figure 3. Distribution, mean and standard deviation of the statistics from Lin’s concordance analysis used to evaluate accuracy (systematic and constant bias), precision (Pearson’s correlation coefficient, r) and concordance (Lin’s concordance correlation coefficient, ρc) of the estimations of severity of downy mildew (Pseudoperonospora cubensis) carried out by 20 unexperienced raters in the successive assessments, The first assessment was performed without the aid of the scale (WO), followed by two assessments with the scale two (A1) and four weeks (A2) after the initial assessment.