Click on the cite to copy
-
Or Copy link



Article filters
Search Papers:
Resistance of Triticale (× Triticosecale) varieties to Fusarium spp.
By Gloria Sánches Jiménez, Santos Gerardo Leyva Mir, Mateo Vargas Hernández, María Florencia Rodríguez García*, Héctor Eduardo Villaseñor Mir
*Corresponding Author.
Received: 24/November/2024 – Published:
14/April/2025
DOI:
https://doi.org/10.18781/R.MEX.FIT.2305-3
-
Or Copy link
Abstract Background/Objective. Fusarium head blight (FHB) is mainly caused by Fusarium spp. species, and is a disease that affects the yield and quality of cereal grain. The objective was to evaluate the resistance in adult plants of seven triticale varieties to Fusarium boothii, F. camptoceras and F. graminearum.
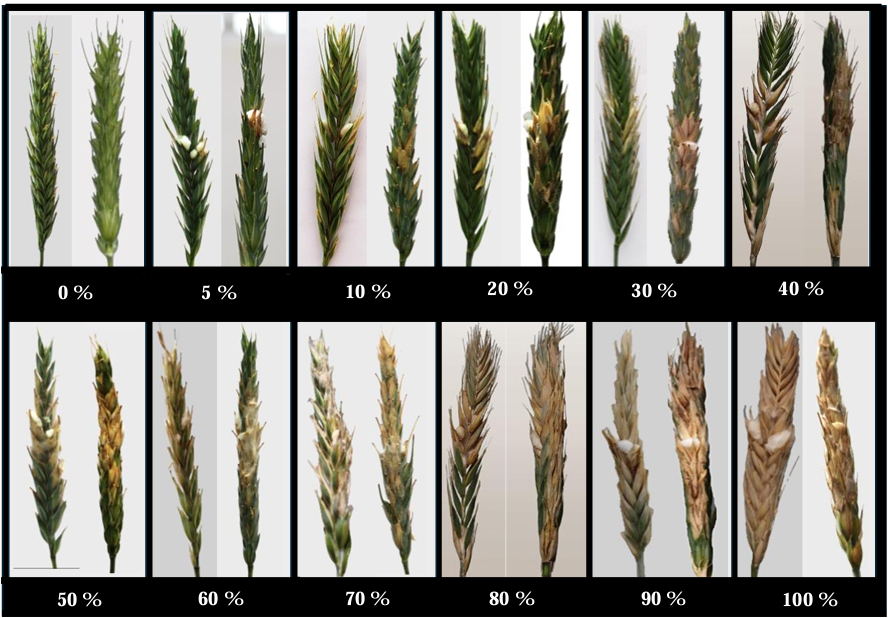
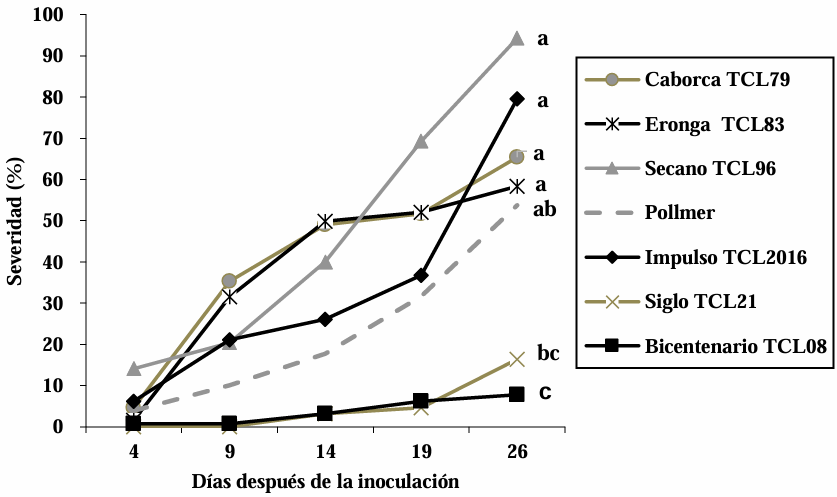
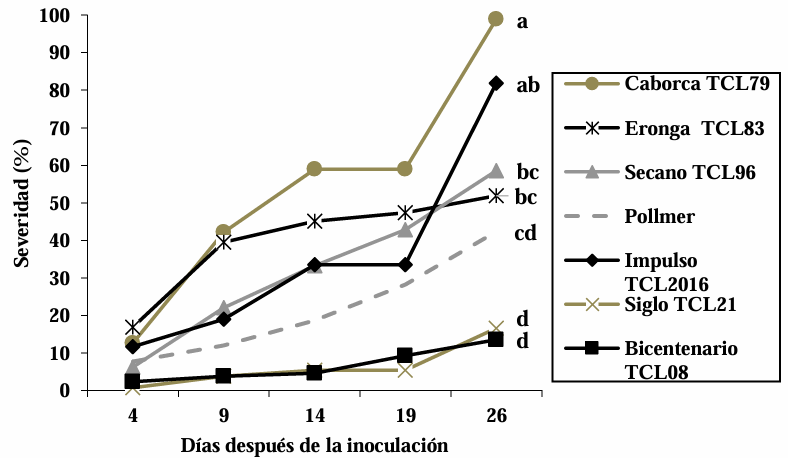
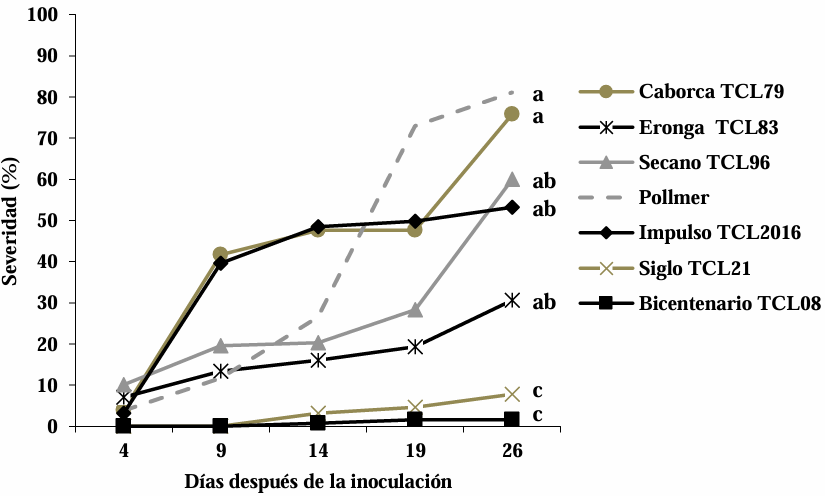
Materials and Methods. The experiment was established under greenhouse conditions at INIFAP-CEVAMEX. The pathogenicity tests were carried out during the flowering stage, by means of spot inoculation by the cotton method. The severity of the disease in the spikes was assessed at 4, 9, 14, 19 and 26 days after inoculation.
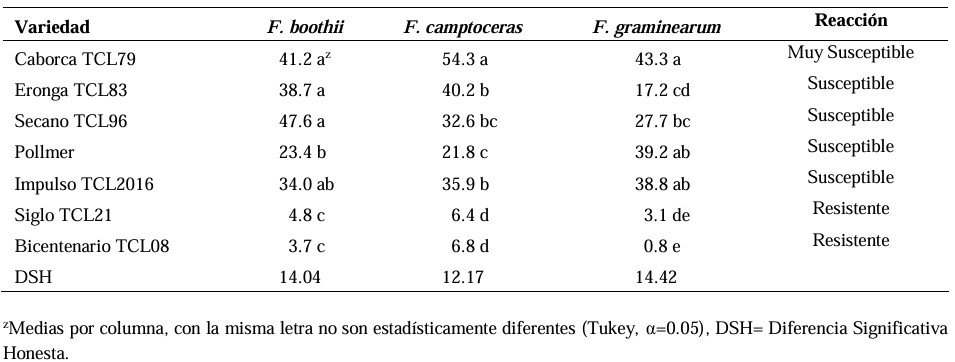
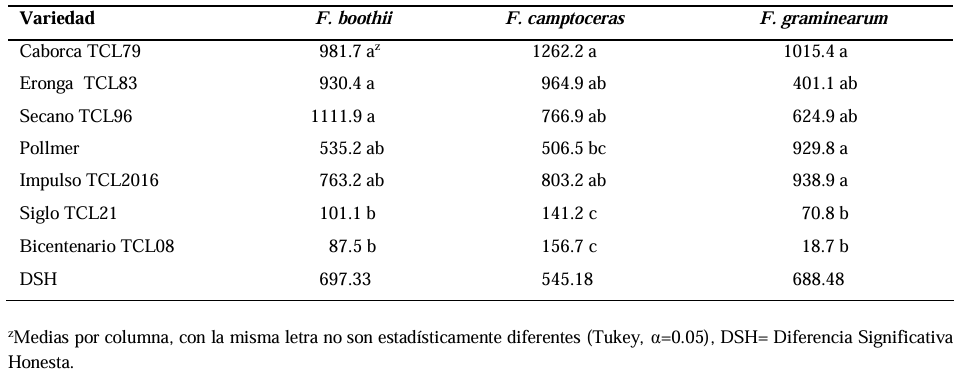
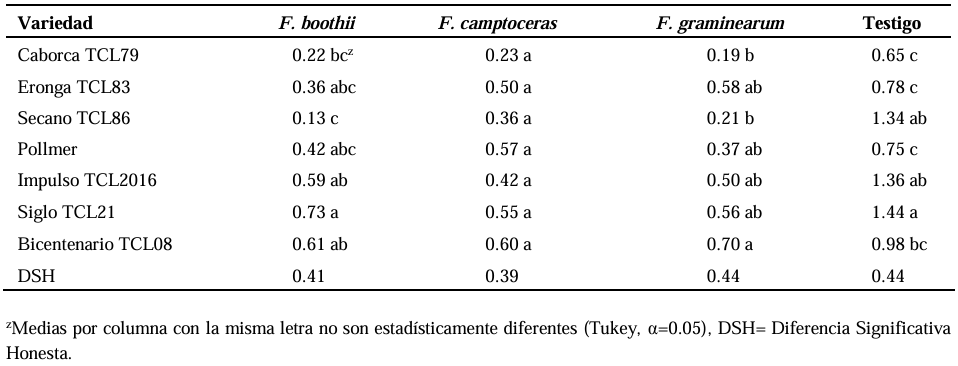
Results. The analysis of variance showed significant differences (p≤0.01) between varieties where variation in resistance was observed. The varieties Siglo TCL21 (3.1 to 6.4%) and Bicentenario TCL08 (0.8 to 6.8%) showed the lowest severities and were resistant to the three species of Fusarium, while Secano TCL96 was the most susceptible variety to F. boothii, presenting 47.6% severity; for F. camptoceras and F. graminearum, the most susceptible variety was Caborca TCL79, with severity percentages of 54.3 and 43.3%, respectively. Grain weight per spike was affected up to 90% in susceptible varieties.
Conclusion. It is important to consider in triticale breeding programs the incorporation of resistance to several Fusarium species, standing out in the present study Siglo TCL21 and Bicentenario TCL08.
Keywords: Severity, Blight, Spikes