Click on the cite to copy
-
Or Copy link


Article filters
Search Papers:
Genetic diversity of Fusarium oxysporum associated to the banana Fusarium wilt
By Gilberto Manzo Sánchez*, Carlos Luis Leopardi Verde, Marco Tulio Buenrostro Nava, Mario Orozco Santos, Blondy Canto Canché
*Corresponding Author.
Received: 12/May/2024 – Published:
26/August/2025
DOI:
https://doi.org/10.18781/R.MEX.FIT.2405-7
-
Or Copy link
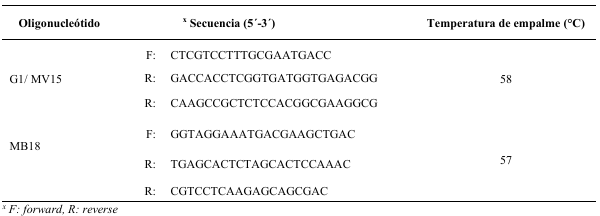
Abstract Background/Objective. The research objective was to analyze Fusarium oxysporum (Fo) isolates from different banana regions from México using SSR markers.
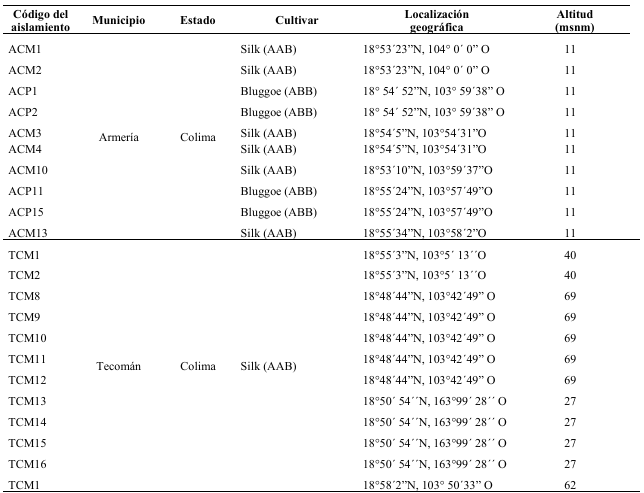
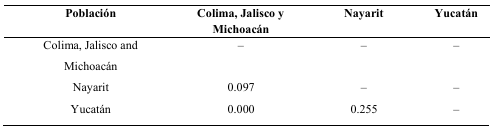
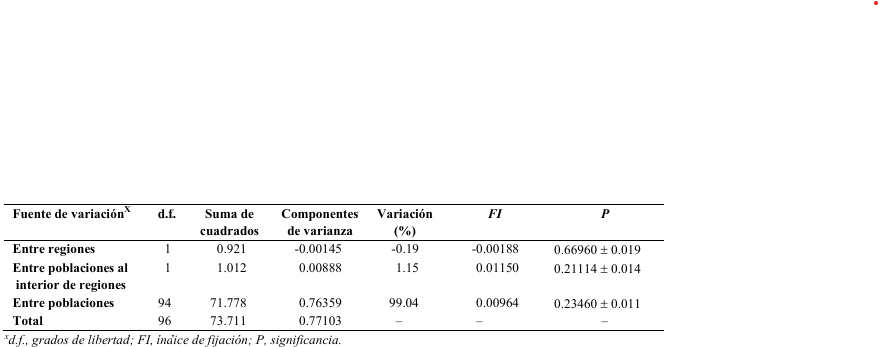
Materials and Methods. Pseudostems of Musa plants exhibiting wilt-disease were sampled from ‘Pisang Awak’ (ABB), ‘Silk’ (AAB), and ‘Bluggoe’ (ABB) varieties collected on commercial orchards of five banana-producing areas of México: Colima, Michoacán, Jalisco, Nayarit, and Yucatán states. Six SSR loci were analyzed for population structure based on 96 Fusarium oxysporum isolates. The number and frequency of haplotypes were calculated in POPGENE. With this data, using the dissimilarity index of Morisita in the R package vegan, the genetic similarity of the populations was estimated. With the haplotype data, we also conducted a molecular analysis of variance (AMOVA) to evaluate the genetic differentiation between regions (FCT), among populations in each region (FSC), and among all populations included in the analysis (FST). Additionally, to illustrate the relations among haplotypes, and their distribution and frequency among sampled populations we generate a minimum spanning network.
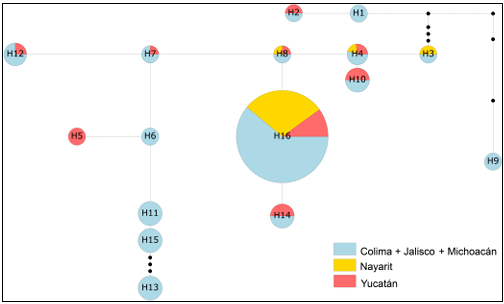
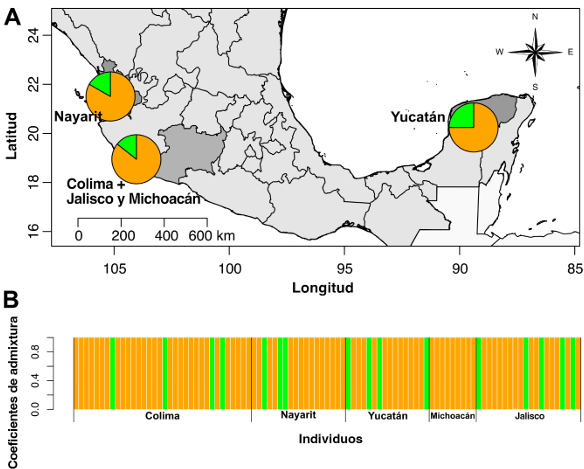
Results. After seven days of PDA culture, all isolates had cottony white mycelia, which can be flat to aerial, and can be colored on the upper surfaces from light violet to dark violet. But on the bottom surfaces, the colony can have colorations from orange to dark red. We observed short monophialides, unicellular or bicellular with oval microconidia. Macroconidia were falciform, and with three to four septa. Putatively, these characteristics fit the F. oxysporum taxonomic criteria. All tested loci were polymorphic across the 96 Foc. We detect 16 haplotypes, of which the most frequent and common was the H16; the others were rare and could be widely dispersed or restricted to one or two populations. Also, we did not find genetic differences among the three analyzed populations, as well as we did not find genetic structure or differentiation at any level. These findings are related to Foc isolates as a complex not necessarily to those related to Foc races.
Conclusion. Our analyses did not detect significant genetic differences between the Fo populations studied, nor did we find genetic structure or differentiation at any level. Therefore, our data suggests that the analyzed populations constitute a single metapopulation, despite the presence of infrequent or unique haplotypes.
Keywords: Foc R4T, Banana genotypes, SSR markers