RMF Logo

Article filters

Search Papers:

For searching before 2024 see Archive (2000-2023)
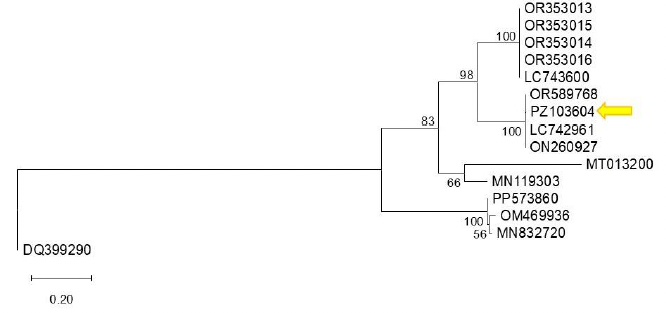
First detection of bell pepper endornavirus infecting bell pepper in Guanajuato, Mexico. Figure 1 - Phylogenetic tree constructed using the Maximum Likelihood method based on the bell pepper endornavirus (BPEV, <em>Alphaendornavirus capsici</em>) polyprotein sequence and other Alphaendornavirus sequences available in GenBank. Reference sequences were selected from GenBank based on their annotation as BPEV isolates and sequence availability. The analysis was performed using the corresponding nucleotide substitution model. Bootstrap support values (1,000 replicates) are indicated at the nodes, showing only those greater than 50%. Sequence PZ103604 (indicated by an arrow) clusters with closely related sequences with high bootstrap support, suggesting a close phylogenetic relationship. Sequence DQ399290 (<em>Betaendornavirus</em>) was used as the outgroup. The scale bar represents 0.20 substitutions per site.

All the Articles

  • Vol. 2024, 42(3)
  • Scientific Article

Fusarium solani associated with Cedrela odorata and Swietenia macrophylla and their sensitivity to conventional fungicides

byAlejo Jairo Cristóbal*, José María Tun Suárez, Arturo Reyes Ramírez, Alberto Uc Várguez, Silvia Edith García Díaz

Received: 01/May/2024 – Published: 12/July/2024
DOI: https://doi.org/10.18781/R.MEX.FIT.2405-5

Abstract Background/Objective. In the state of Yucatan, Mexico, 10 million forest plants were produced in the last five years for various conservation and restoration actions. The main limitations in the production of these plants in nursery are disease induced by the genus Fusarium spp., that cause stem and root rots and plant production losses of up to 50%. The objective of the work was to identify the causal agent associated with stem and root rot and necrosis of cedar (Cedrela odorata) and mahogany (Swietenia macrophylla) and their in vitro sensitivity to conventional fungicides.

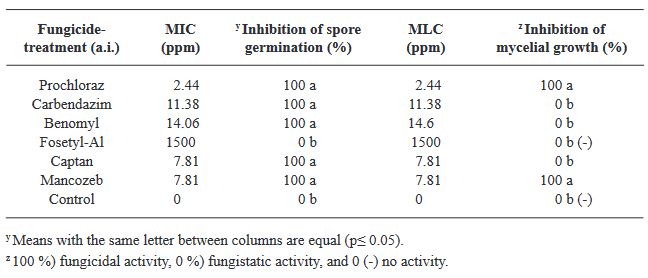
Materials and Methods. C. odorata and S. macrophylla plants were collected at three and six weeks of germination, respectively, with symptoms of necrosis and rot indicated; from where five fungal isolates were obtained and morphologically and molecularly identified. The Minimum Inhibitory Concentration (MIC) of spores and the Minimum Lethal Concentration (MLC) of six conventional fungicides of recurrent application in the region (Prochloraz, Carbendazim, Benomyl, Fosetyl Al, Captan and Mancozeb) were determined in vitro by the microdilution method and validate their effectiveness and viability in the management of this problematic.

Results. The morphology and molecular sequences of the isolates were similar to the reported for Fusarium solani. The MIC of F. solani spores for Prochloraz, Carbendazim, Benomyl, Captan and Mancozeb were 2.44. 11.38, 14.06, 7.81 and 7.81 ppm, respectively; Fosetyl Al, did not inhibit spore germination normal mycelial growth of the fungus was observed at the concentration evaluated.

Conclusion. Prochloraz and Mancozeb had the lowest MLC with 2.44 and 7.81 ppm, respectively.

Show Figures and/or Tables
Figure 1. Plants with symptoms of necrosis and rot in the stem and root. A, B, and C) <em>Cedrela odorata</em> plants. D, E, and F) <em>Swietenia macrophylla</em> plants
Figure 1. Plants with symptoms of necrosis and rot in the stem and root. A, B, and C) Cedrela odorata plants. D, E, and F) Swietenia macrophylla plants
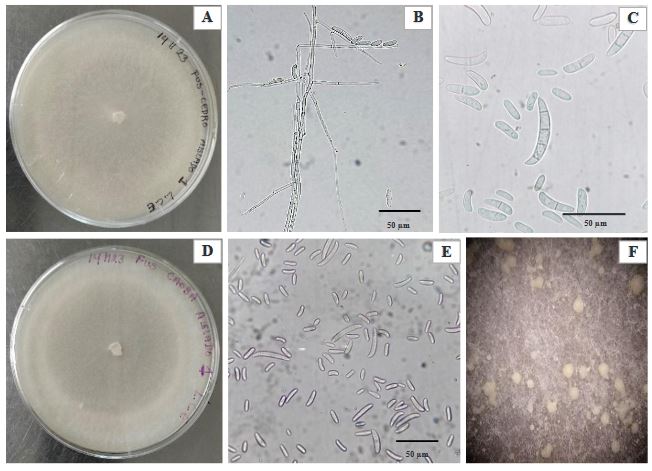
Figure 2. A and D) View of 14-day-old <em>Fusarium solani</em> isolated from <em>Cedrela odorata</em> and <em>Swietenia macrophylla</em>, B) Septate mycelium and microconidia of <em>F. solani</em>, C) Macroconidia (3-4 septa) and microconidia (0-1 septum) of <em>F. solani</em> observed at 100X magnification, E) Macroconidia and microconidia observed at 40X magnification, and F) Sporodochia
Figure 2. A and D) View of 14-day-old Fusarium solani isolated from Cedrela odorata and Swietenia macrophylla, B) Septate mycelium and microconidia of F. solani, C) Macroconidia (3-4 septa) and microconidia (0-1 septum) of F. solani observed at 100X magnification, E) Macroconidia and microconidia observed at 40X magnification, and F) Sporodochia
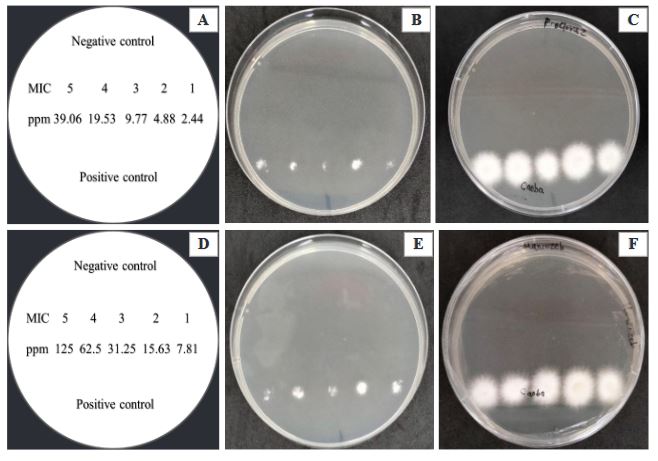
Figure 3. Fungicidal effect of Prochloraz and Mancozeb on the spore solution of <em>Fusarium solani</em> obtained from the microdilution plate after two days of evaluation. A) Distribution in Petri dishes with PDA medium of five MIC obtained from Prochloraz, B and C) No mycelial growth of <em>F. solani</em> in the MIC of Prochloraz evaluated after 24 and 48 h, D) Distribution in Petri dishes with PDA medium of five MIC obtained from Mancozeb, E and F) No mycelial growth of <em>F. solani</em> in the MIC of Mancozeb evaluated after 24 and 48 h
Figure 3. Fungicidal effect of Prochloraz and Mancozeb on the spore solution of Fusarium solani obtained from the microdilution plate after two days of evaluation. A) Distribution in Petri dishes with PDA medium of five MIC obtained from Prochloraz, B and C) No mycelial growth of F. solani in the MIC of Prochloraz evaluated after 24 and 48 h, D) Distribution in Petri dishes with PDA medium of five MIC obtained from Mancozeb, E and F) No mycelial growth of F. solani in the MIC of Mancozeb evaluated after 24 and 48 h
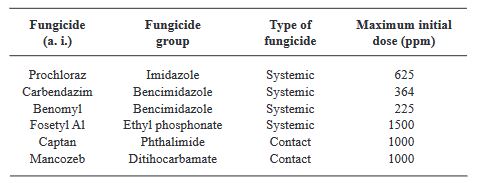
Table 1. Conventional fungicides evaluated for their effect on spore germination and mycelial growth of <em>Fusarium solani</em> isolated from <em>Cedrela odorata</em> and <em>Swietenia macrophylla</em>.
Table 1. Conventional fungicides evaluated for their effect on spore germination and mycelial growth of Fusarium solani isolated from Cedrela odorata and Swietenia macrophylla.
Table 2. Minimum inhibitory concentration (MIC) and minimum lethal concentration (MLC) of conventional fungicides against <em>Fusarium solani</em> isolated from <em>Cedrela odorata</em> and <em>Swietenia macrophylla</em>
Table 2. Minimum inhibitory concentration (MIC) and minimum lethal concentration (MLC) of conventional fungicides against Fusarium solani isolated from Cedrela odorata and Swietenia macrophylla
  • Vol. 2024, 42(3)
  • Scientific Article

Chemical composition of Tagetes hydrolates and in vitro and in vivo evaluation against disease associated fungi in strawberry (Fragaria x ananassa)

byMiguel Ángel Ruíz González, Miguel Ángel Serrato Cruz*, Ernestina Valadez Moctezuma, Roney Solano Vidal

Received: 28/January/2024 – Published: 09/July/2024
DOI: https://doi.org/10.18781/R.MEX.FIT.2401-5

Abstract Background/Objective. Aromatic plants contain chemical compounds with potential to formulate antifungal products. The objective of this study was to characterize the chemical composition in hydrolates of Tagetes species and to evaluate their effect in vitro and in vivo against disease-associated fungi in strawberry.

Materials and Methods. The hydrolates of T. coronopifolia, T. minuta, T. parryi and T. terniflora were analyzed by gas chromatography coupled to a mass spectrometry. Hydrolates at 100, 75, 50 and 25 % and Promyl commercial fungicides were evaluated in vitro against Botrytis cinerea, Fusarium oxysporum, Rhizoctonia solani and Ridomil Gold against Phytophthora capsici. In the in vivo evaluation, strawberry plants sprayed with the hydrolates and 24 h later the plants were inoculated with 1 x 10⁶ spore suspension. Data were analyzed by analysis of variance and Turkey’s means test (p ≤ 0.05).

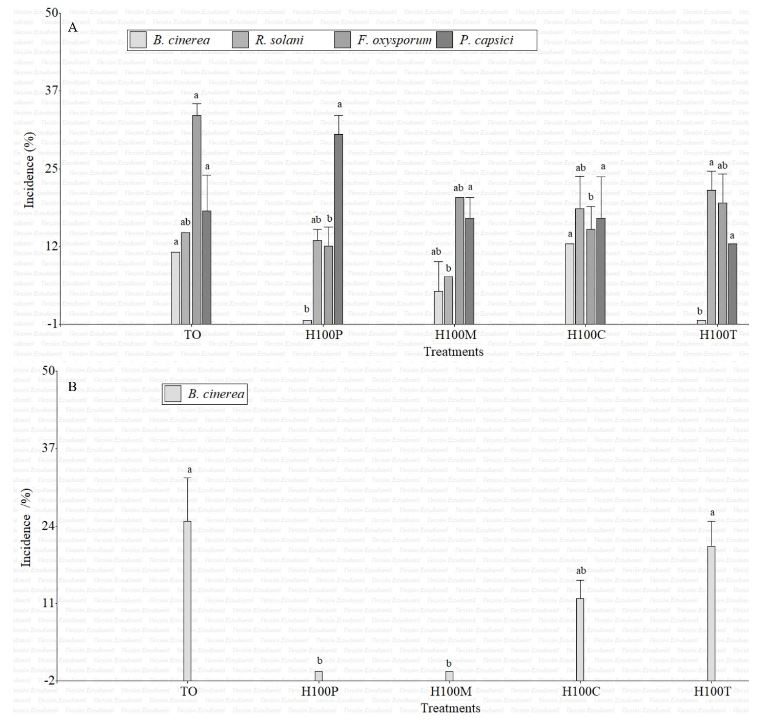
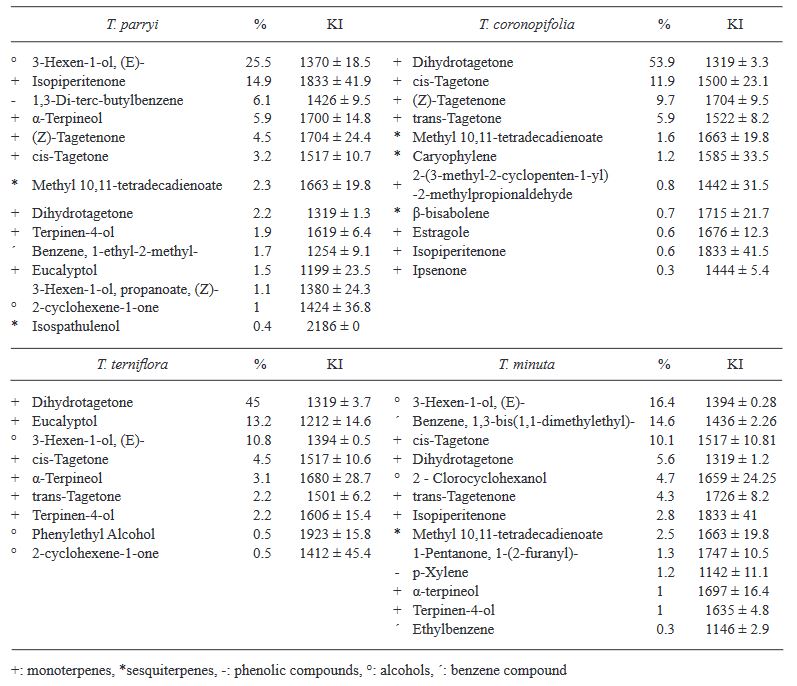
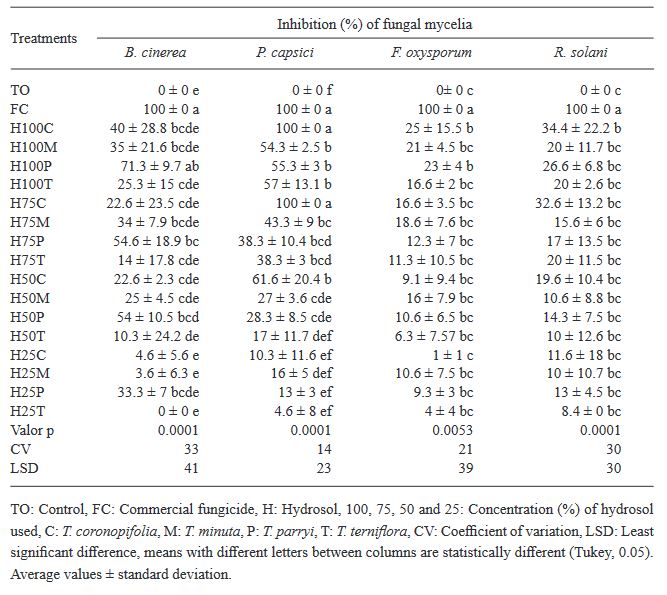
Results. Monoterpenes were the major compounds in the four Tagetes species. T. parryi hydrolate in vitro totally inhibited the growth of B. cinerea being effective as a preventive treatment in the in vivo evaluation. F. oxysporum, P. capsici and R. solani were less susceptible to all the hydrolats.

Conclusion. T. parryi hydrolate can be applied as a preventative against B. cinerea on strawberry plants

Show Figures and/or Tables
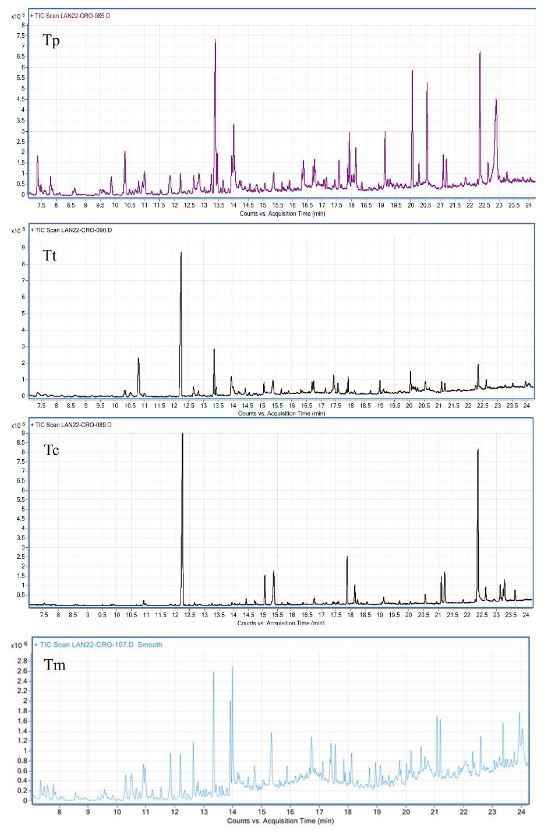
Figure 1. <em>Tagetes</em> parryi (Tp), <em>T. terniflora</em> (Tt), <em>T. coronopifolia</em>, (Tc) and <em>T. minuta</em> (Tm) hydrosol chromatograms, showing the peaks of the compounds identified
Figure 1. Tagetes parryi (Tp), T. terniflora (Tt), T. coronopifolia, (Tc) and T. minuta (Tm) hydrosol chromatograms, showing the peaks of the compounds identified
Figure 2. Incidence of <em>B. cinerea</em>, R. solani, <em>F. oxysporum</em> and <em>P. capsici</em> in strawberry fruits (A) and flowers (B) three days after their inoculation in control (TO) plants and treated with 100% <em>Tagetes</em> coronopifolia (H100C), <em>T. minuta</em> (H100M), <em>T. parryi</em> (H100P) <em>T. terniflora</em> hydrolates (H100T)
Figure 2. Incidence of B. cinerea, R. solani, F. oxysporum and P. capsici in strawberry fruits (A) and flowers (B) three days after their inoculation in control (TO) plants and treated with 100% Tagetes coronopifolia (H100C), T. minuta (H100M), T. parryi (H100P) T. terniflora hydrolates (H100T)
Table 1. Relative abundance (%) and Kovats indices (KI) ± standard deviation of chemical compounds found in <em>Tagetes</em> coronopifolia, <em>T. minuta</em>, <em>T. parryi</em> and <em>T. terniflora</em> hydrolates analyzed using GC/MSD
Table 1. Relative abundance (%) and Kovats indices (KI) ± standard deviation of chemical compounds found in Tagetes coronopifolia, T. minuta, T. parryi and T. terniflora hydrolates analyzed using GC/MSD
Table 2. Percentage of <em>in vitro</em> inhibition of fungus mycelia after applying <em>Tagetes</em> species hydrolates
Table 2. Percentage of in vitro inhibition of fungus mycelia after applying Tagetes species hydrolates
  • Vol. 2024, 42(2)
  • Phytopathological Note

Fungal causal agents of the Black Spot of the cactus (Opuntia ficus-indica) in Colima, Mexico

byZoila Lizbeth Chavarría Cervera, Andrés Quezada Salinas, Pedro Valadez Ramírez, Wilberth Chan Cupul, Jesús Enrique Castrejón Antonio, Juan Carlos Sánchez Rangel*

Received: 16/January/2024 – Published: 02/April/2024
DOI: https://doi.org/10.18781/R.MEX.FIT.2401-2

Abstract Background/Objective. The prickly pear cactus (Opuntia ficus-indica) holds significant economic, social, and cultural importance in Mexico. However, it is recurrently affected by Black Spot disease (BS), caused by various phytopathogenic fungi. Identifying the causal agents of BS in commercial prickly pear crops is crucial for efficient agronomic management of the disease. The objective of this study was to identify the phytopathogenic fungi responsible for BS in prickly pear plantations in the Colima state, Mexico.

Materials and Methods. Fifty cladodes from 50 plants exhibiting BS symptoms were collected from commercial plantations in Colima. The pathogenicity of the isolated fungi was verified using Koch’s postulates, and those causing the most severe BS symptoms were molecularly identified.

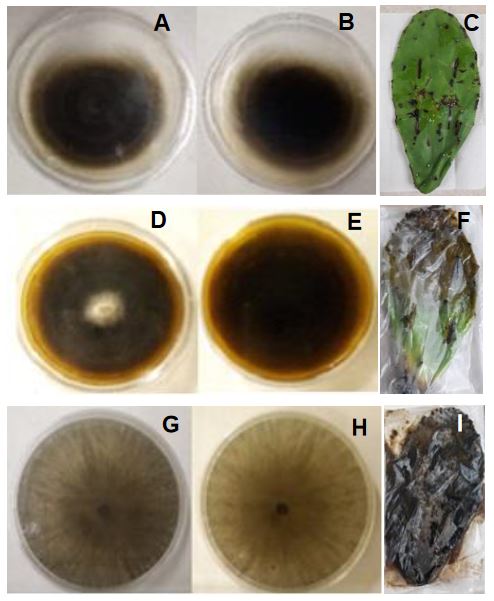
Results. Thirty-five fungi were isolated from plants with BS symptoms, of which 20 exhibited distinct mycelial growth. Only six fungi induced BS symptoms; three of them were responsible for severe symptoms in cladodes: Alternaria alternata, Corynespora cassiicola, and Neoscytalidium dimidiatum.

Conclusion. BS is caused by various phytopathogenic fungi, but this is the first report of C. cassiicola and N. dimidiatum as causal agents of BS in prickly pear cactus

Show Figures and/or Tables
Figure 1. Plants and cladodes with symptoms of Black Spot in vegetable prickly pear cactus (O. ficus-indica) crops in various plantations in Colima state, Mexico. A) El Espinal, B) Agua Dulce, C) Las Guásimas, D) Juluapan
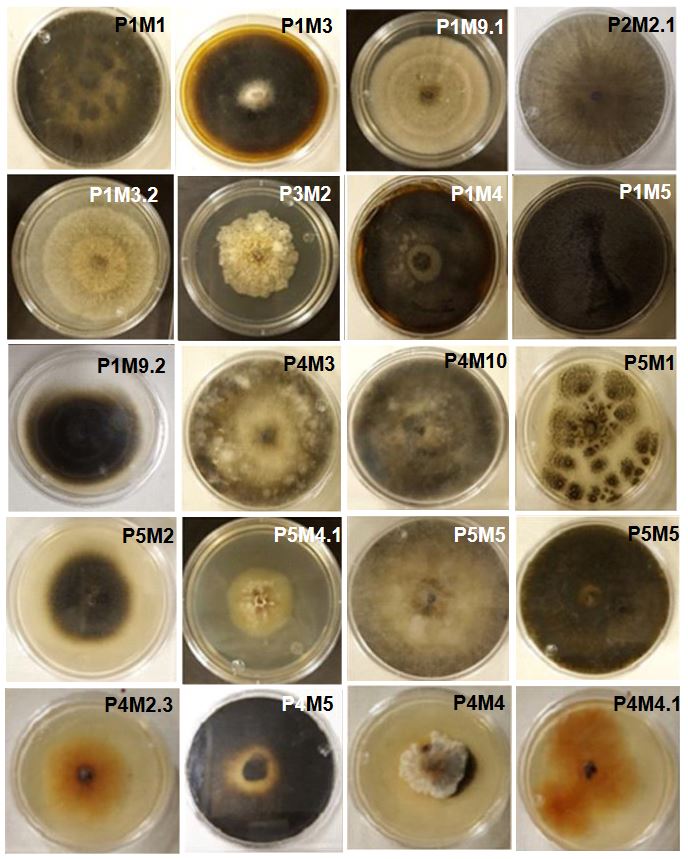
Figure 2. Fungi isolated from prickly pear cactus cladodes showing symptoms of Black Spot. The isolates are deposited in the mycological collection of the Faculty of Biological and Agricultural Sciences at the University of Colima for subsequent morphological and molecular characterization.
Figure 3. Fungi isolated from cladodes with Black Spot symptoms that induced severe lesions in the pathogenicity test. Growth on PDA of <em>Alternaria alternata</em> (obverse, A; reverse B) and symptoms induced on the cladode (E), <em>Corynespora cassiicola</em> (D, E, F), and <em>Neoscytalidium dimidiatum</em> (G, H, I).
Figure 3. Fungi isolated from cladodes with Black Spot symptoms that induced severe lesions in the pathogenicity test. Growth on PDA of Alternaria alternata (obverse, A; reverse B) and symptoms induced on the cladode (E), Corynespora cassiicola (D, E, F), and Neoscytalidium dimidiatum (G, H, I).
  • Vol. 2024, 42(2)
  • Phytopathological Note

Armillaria gallica associated with avocado root rot in Michoacán

byJeny Michua Cedillo*, Daniel Téliz Cedillo, Salvador Ochoa Ascencio, María del Pilar Rodríguez, Alejandro Alarcón, Carlos de León, Gerardo Vázquez Marrufo

Received: 30/July/2023 – Published: 21/March/2024
DOI: https://doi.org/10.18781/R.MEX.FIT.2307-7

Abstract Aims and background. Root rot and the death of avocado trees related to Armillaria is an emerging disease with a high economic impact in orchards established in previously forested areas of Michoacán. Nowadays, the species related with typical symptoms of wilting, yellowing, excessive fruit production and subcortical mycelia in the roots is unknown. The aim of this investigation was to molecularly characterize the species of Armillaria associated to avocado root rot.

Materials and Methods. For the morphological and molecular characterization, 60 root simples from trees found in three commercial orchards with a putative presence of Armillaria were processed in a malt-agar extract. The DNA of purified isolations were amplified by PCR with genes RPB2 and TEF α-1. The sequences were aligned using MAFFT and the phylogenies were constructed using the maximum likelihood algorithm in IQ-TREE.

Results. Two species were consistently identified: A. gallica (20%) with a 100% homology, and A. mexicana (25%), with 98%. Another species that represented 55% of the isolations was not aligned with any group. Morphologically, the A. gallica basidiocarps coincide with the characteristics of this species.

Conclusion. This is the first report on A. gallica associated to avocado root rot in Michoacán

Show Figures and/or Tables
Figure 1. <em>Armillaria</em> morphotypes taken from avocado orchards in different municipal areas of the avocado belt in Michoacán. A. Front, B. Reverse.
Figure 1. Armillaria morphotypes taken from avocado orchards in different municipal areas of the avocado belt in Michoacán. A. Front, B. Reverse.
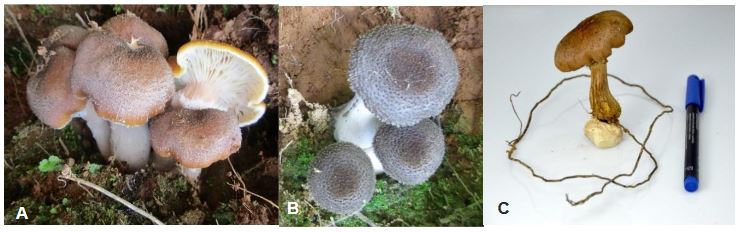
Figure 2. <em>Armillaria gallica</em> basidiocarps gathered in Charapan, Michoacán. A. Mature <em>Armillaria gallica</em> basidiocarps (yellow cap with scales); B. Immature gray <em>A. gallica</em> basidiocarps with scales; C. Single basidiocarp with a single rhizomorph on the base.
Figure 2. Armillaria gallica basidiocarps gathered in Charapan, Michoacán. A. Mature Armillaria gallica basidiocarps (yellow cap with scales); B. Immature gray A. gallica basidiocarps with scales; C. Single basidiocarp with a single rhizomorph on the base.
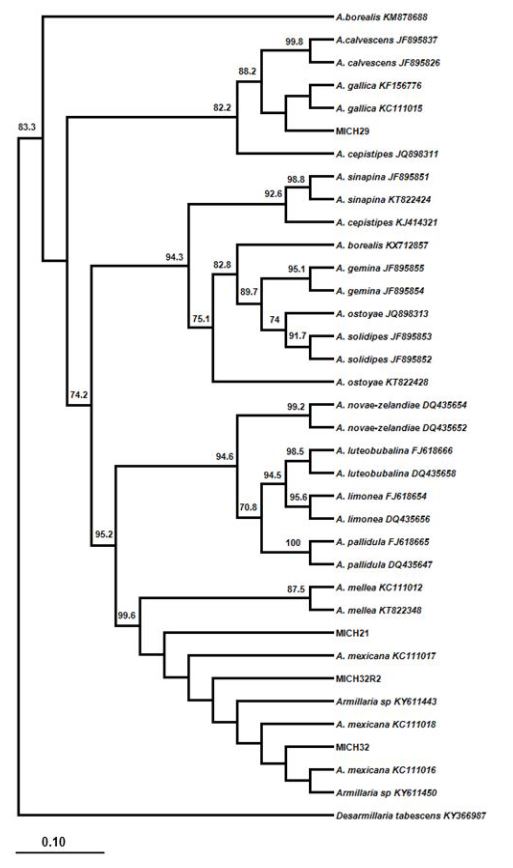
Figure 3. Phylogenetic analysis with <em>Armillaria</em> species sequences from avocado and from the GenBank amplified with the gene TEF α-1. Isolate MICH29 was directly grouped with the species <em>Armillaria gallica</em>. Strains MICH32 and MICH32R are broadly related to <em>Armillaria</em> mexicana, whereas MICH21 was grouped between the clade of A. mellea and <em>A. mexicana</em>
Figure 3. Phylogenetic analysis with Armillaria species sequences from avocado and from the GenBank amplified with the gene TEF α-1. Isolate MICH29 was directly grouped with the species Armillaria gallica. Strains MICH32 and MICH32R are broadly related to Armillaria mexicana, whereas MICH21 was grouped between the clade of A. mellea and A. mexicana
Figure 4. Phylogenetic analysis of sequences of <em>Armillaria</em> species from avocado and the GenBank amplified with gene RPB2. Strain MICH29 and MICH29R are grouped directly with the species <em>Armillaria gallica</em>, while MICH21 is related to A. mellea.
Figure 4. Phylogenetic analysis of sequences of Armillaria species from avocado and the GenBank amplified with gene RPB2. Strain MICH29 and MICH29R are grouped directly with the species Armillaria gallica, while MICH21 is related to A. mellea.
  • Vol. 2024, 42(2)
  • Review Article

Conservation of natural enemies of Diaphorina citri and their impact on Huanglongbing: Analysis and perspectives

byHipolito Cortez Madrigal*

Received: 30/July/2023 – Published: 11/April/2024
DOI: https://doi.org/10.18781/R.MEX.FIT.2307-3

Abstract Diaphorina citri is the main vector of Candidatus Liberibacter asiaticus (CLas), the causative agent of HLB, the most devastating citrus disease. Although the importance of biological control is recognized, insecticides are the main control tool used. Its use in citrus should be cautious, as it could interfere with the biocontrol of exotic pests already present. Diaphorina citri has a wide range of natural enemies; however, only the parasitoid Tamarixia radiata and some species of entomopathogenic fungi are used inundatively. Although the main predators of the vector occur naturally, few studies address their conservation in situ. This review supports the idea that the conservation of natural enemies should be the basis of the integrated management of D. citri and CLas. The conservation of alternate hosts, the inclusion of nectar plants, in situ conservation of parasitoids, and the autodissemination of entomopathogenic fungi are proposed. Studies carried out on conservation of natural enemies of D. citri and related pests, their probable impact on the disease, and prospects for implementation in Mexico are analyzed and discussed. The proposed strategies could enhance not only the biological control of D. citri-CLas, but also the autoregulation of citrus pests in general.

Show Figures and/or Tables
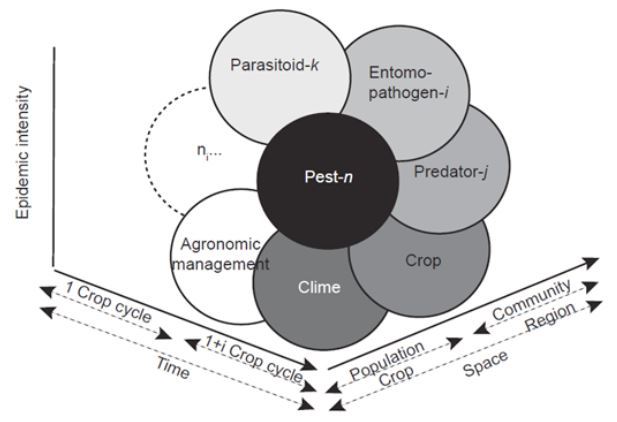
Figure 1. Epidemiological System defined by the interaction of factors that determine an epidemic process: pest species, entomopathogen, predator, and parasitoid, crop, agronomic management, climate, and any other specific factor (ni), all of which operate at different spatial-temporal levels (Adapted from Mora-Aguilera <em>et al.,</em> 2017).
Figure 1. Epidemiological System defined by the interaction of factors that determine an epidemic process: pest species, entomopathogen, predator, and parasitoid, crop, agronomic management, climate, and any other specific factor (ni), all of which operate at different spatial-temporal levels (Adapted from Mora-Aguilera et al., 2017).
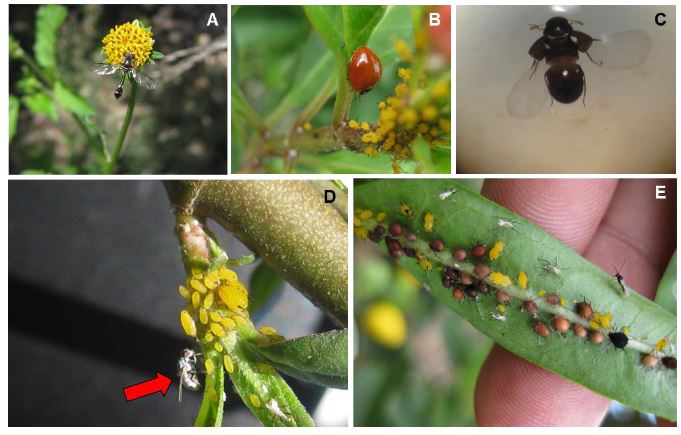
Figure 2. Aphis nerii on Asclepias curassavica and some associated natural enemies. A) Pseudodorus clavatus, B)Cycloneda sanguinea, C) Adult of Oligota sp., D) Adult of Chamaemyiidae, E) Mummies and adults ofLyciphlebus testaceipes
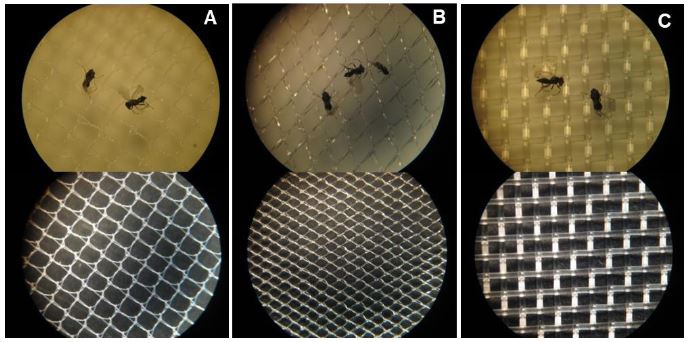
Figure 3. Different types of mesh evaluated in the selective emergence of Tamarixia triozae, parasitoid of Bactericera cockerelli as a model to be implemented with D. citri and its parasitoid. A) 700 x 700 μm, B) 700 x 900 μm, and C) 500 μm mesh.
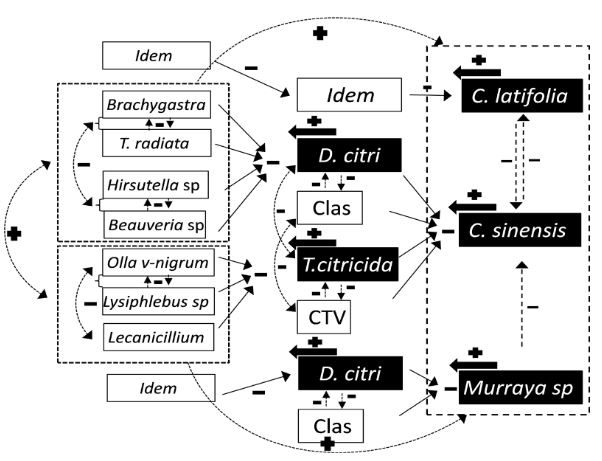
Figure 4. Phytosanitary trophic system in two citrus species (Persian lime and sweet orange) and the lemon grass M. paniculata, which are differentially infested with two pest-vector species (D.citri and T. citricida) and two pathogens (Citrus tristeza virus and Candidatus Liberibacterasiaticus). Taken from Mora et al. (2017).
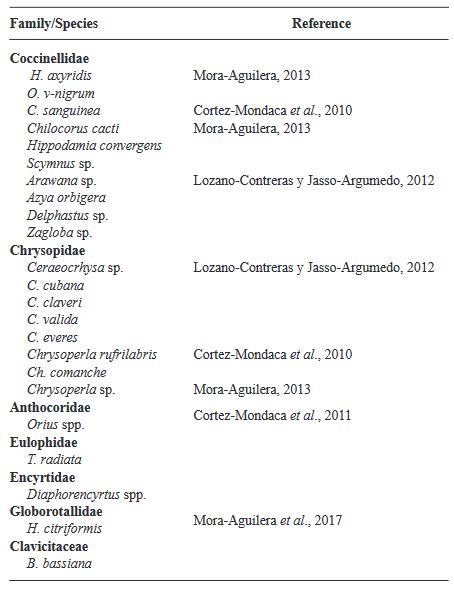
Table 1. Natural enemies associated with D. citri in citrus orchards in Mexico
  • Vol. 2024, 42(2)
  • Review Article

Iris yellow spot orthotospovirus pathosystem, virus host and vector (Thrips tabaci)

byNorma Ávila Alistac*, Erika J Zamora Macorra, Héctor Lozoya Saldaña

Received: 30/October/2023 – Published: 10/March/2024
DOI: https://doi.org/10.18781/R.MEX.FIT.2310-8

Abstract Iris yellow spot Orthotospovirus (IYSV) causes serious problems in the onion (Allium cepa) crop and is widely distributed in the producing areas of the country. In Mexico it was reported in 2010 as “yellow spot” on onion and other members of the genus Allium. Its main vector is Thrips tabaci, which causes direct damage by feeding and by being a vector of other viruses such as Tomato spotted wilt Orthotospovirus and Impatiens necrotic spot Orthotospovirus. Knowledge of the pathosystem of IYSV - Thrips tabaci - Allium cepa - weeds can contribute to an integrated management and awareness of pesticide use. The versatility of IYSV to infect more than 60 plant species (>20 families), most of which are present in Mexico, coupled with the wide host range of the vector, makes the interaction complex and leads to a better understanding of the diversity of alternate hosts of the vector and/or IYSV. At present, information on weed hosts of IYSV and the vector is limited, but their knowledge will provide a greater understanding of the disease. It is important to have a comprehensive knowledge of the virus, main host, alternate hosts, and vector in the country, in order to channel future research to counteract this problem and minimize losses caused by IYSV in the onion crop mainly

Show Figures and/or Tables
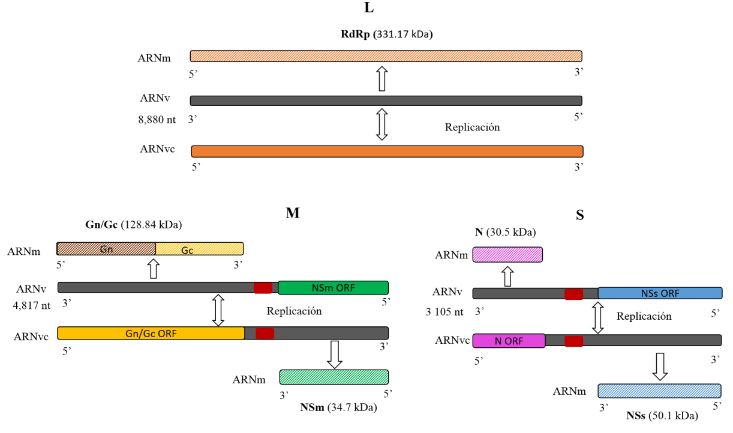
Figure 1. Representation of the segmented organization of the <em>Iris yellow spot Orthotospovirus</em> RNA genome (L, M and S). Modified from Bag et al. (2015)
Figure 1. Representation of the segmented organization of the Iris yellow spot Orthotospovirus RNA genome (L, M and S). Modified from Bag et al. (2015)
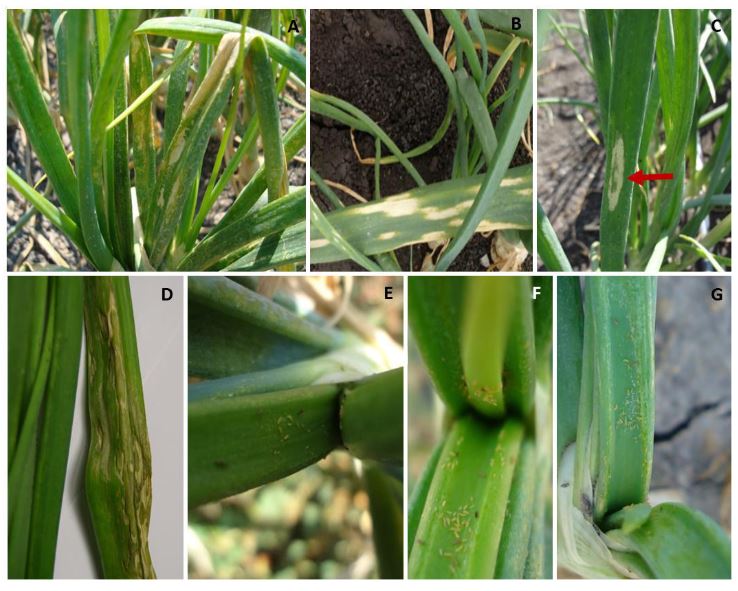
Figure 2. A and B) symptoms associated with the <em>Iris yellow spot Orthotospovirus</em> infection, consisting of pale straw- colored chlorotic lesions with an elongated shape. C and D) pale straw-colored chlorotic lesions with a green island in the center of the lesion E-G) presence of large T. tabaci populations (immature and adult) in the onion crop.
Figure 2. A and B) symptoms associated with the Iris yellow spot Orthotospovirus infection, consisting of pale straw- colored chlorotic lesions with an elongated shape. C and D) pale straw-colored chlorotic lesions with a green island in the center of the lesion E-G) presence of large T. tabaci populations (immature and adult) in the onion crop.
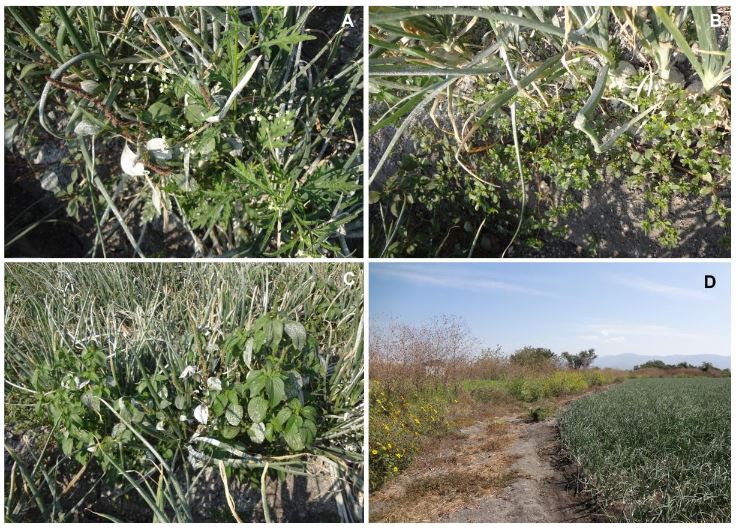
Figure 3. Weeds interacting inside and outside of the onion (<em>Allium cepa</em>) crop. A) Parthenium weed (Parthenium hysterophorus); B) Purslane (Portulaca oleracea); C) Pineland threesed mercury (Acalypha ostryifolia); D) Mexican sunflower (Tithonia tubiformis) on the edge of an onion crop.
Figure 3. Weeds interacting inside and outside of the onion (Allium cepa) crop. A) Parthenium weed (Parthenium hysterophorus); B) Purslane (Portulaca oleracea); C) Pineland threesed mercury (Acalypha ostryifolia); D) Mexican sunflower (Tithonia tubiformis) on the edge of an onion crop.
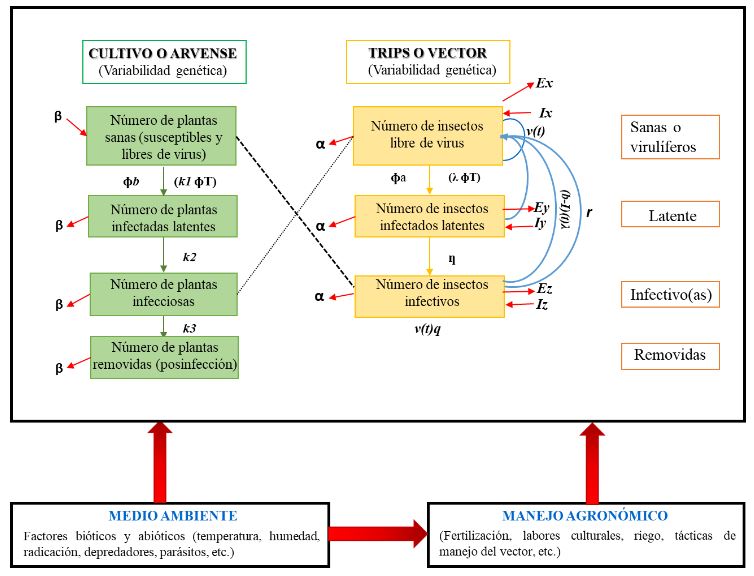
Figure 4. Epidemiological system of a viral pathosystem focused on <em>Iris yellow spot Orthotospovirus</em> (based on and modified from Madden <em>et al.,</em> 2000). Notes used: v(t)= Total fertility rate of the insect population per day within the crop. Ґ= Virus incubation time within the vector. q= Probability that the offspring of the vector will be viruliferous. β= Plant mortality and recovery rate (replanting). α= Insect mortality and birth rate. ɸb= (Plants visited by insects per day) (Probability that the viruliferous insect inoculates the virus in a plant per visit). 1/k1= Time taken for the vector to inoculate the plant. 1/k2= Virus latency period in the plant. 1/k3= Infectious period of the virus in the plant. ɸT= (Plants visited by insects per day) (Time taken for the insect to sample the plant in one visit). Ex= Rate of emigration of virus-free insects. Ix= Rate of emigration of virus-free insects. Ey= Rate of emigration of latent insects. Ez= Rate of emigration of infective insects. Iy= Rate of emigration of latent insects. Iz= Rate of immigration of infective insects. 1/λ = Vector acquisition time. ɸa= (Plants visited by insects per day) (Probability that an insect will acquire the virus with a single visit to the infected plant). 1/ƞ= Time taken for the virus to transition from latent to infective within the vector (latency period). For further information, refer to Madden et al. (2000)
Figure 4. Epidemiological system of a viral pathosystem focused on Iris yellow spot Orthotospovirus (based on and modified from Madden et al., 2000). Notes used: v(t)= Total fertility rate of the insect population per day within the crop. Ґ= Virus incubation time within the vector. q= Probability that the offspring of the vector will be viruliferous. β= Plant mortality and recovery rate (replanting). α= Insect mortality and birth rate. ɸb= (Plants visited by insects per day) (Probability that the viruliferous insect inoculates the virus in a plant per visit). 1/k1= Time taken for the vector to inoculate the plant. 1/k2= Virus latency period in the plant. 1/k3= Infectious period of the virus in the plant. ɸT= (Plants visited by insects per day) (Time taken for the insect to sample the plant in one visit). Ex= Rate of emigration of virus-free insects. Ix= Rate of emigration of virus-free insects. Ey= Rate of emigration of latent insects. Ez= Rate of emigration of infective insects. Iy= Rate of emigration of latent insects. Iz= Rate of immigration of infective insects. 1/λ = Vector acquisition time. ɸa= (Plants visited by insects per day) (Probability that an insect will acquire the virus with a single visit to the infected plant). 1/ƞ= Time taken for the virus to transition from latent to infective within the vector (latency period). For further information, refer to Madden et al. (2000)
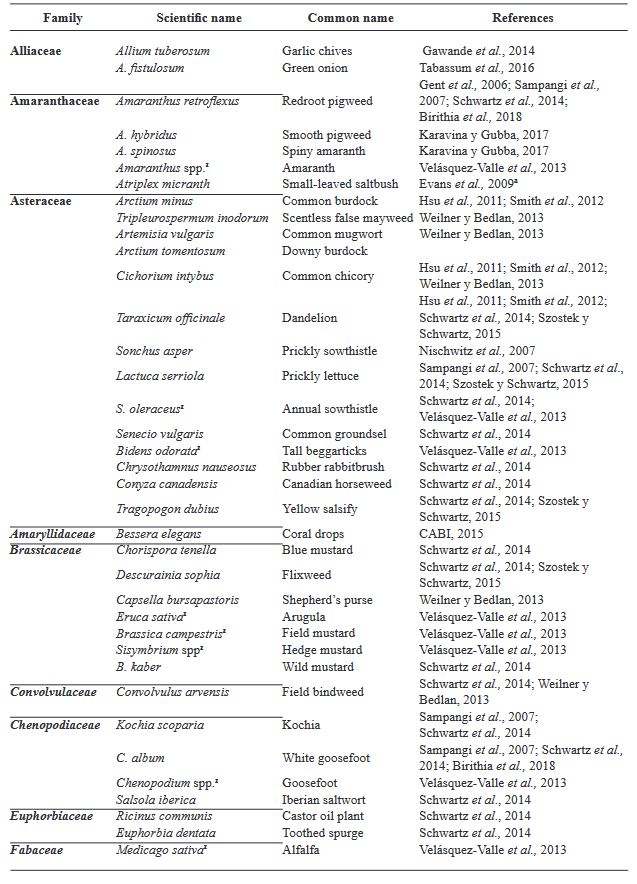
Table 1. Range of <em>Iris yellow spot Orthotospovirus</em> hosts
Table 1. Range of Iris yellow spot Orthotospovirus hosts
  • Vol. 2024, 42(2)
  • Scientific Article

Phylogenomic diversity and genome mining of type Bacillus species: Searching for genes associated with biological control of phytopathogens

byJosé Jesús Márquez Diego, Andrea Denisse Martinez Vidales, Errikka Patricia Cervantes Enríquez, Abraham Ruiz Castrejón, José Humberto Romero Silva, Maria Edith Ortega Urquieta, Fannie Isela Parra Cota, Sergio de los Santos Villalobos*

Received: 18/July/2023 – Published: 06/March/2024
DOI: https://doi.org/10.18781/R.MEX.FIT.2402-9

Abstract Background/Objective. Bacillus is a cosmopolitan bacterial genus with a great genome diversity. Thus, by exploring its genome background, it is possible to understand more about the physiological and biochemical traits involved in its biological control against phytopathogens. The objective of this work was to correlate the phylogenomic relationships of the type species of the genus Bacillus with the presence of gene clusters associated with biological control of plant pathogens, through genome mining.

Materials and Methods. Based on the literature, 336 species belonging to the genus Bacillus have been reported; however, after re-classification, a total of 123 type species have been recognized, and curated genomes were found in the EzBioCloud platform (http://www.ezbiocloud.net/). The overall genome relatedness indices (OGRIs) were used for this work, which indicate how similar two sequences of a genome are. Then, the Realphy platform was used to create the phylogenomic tree 1.13 (Action-based phylogeny constructor reference). Finally, the prediction of biosynthetic gene clusters (BGC) associated with the biological control of phytopathogens was carried out using antiSMASH v6.0 (https://antismash. secondarymetabolites.org/).

Results. The present strategy allowed us to correlate and predict the biological control capacity of the Bacillus species under study based on their taxonomic affiliation since at a shorter evolutionary distance from Bacillus subtilis a high potential capacity to produce biological control compounds was observed. However, the possibility that they acquire the ability to produce new biocontrol compounds during their evolutionary separation is not ruled out.

Conclusion. This work validates the correlation between the taxonomic affiliation of the studied Bacillus species and their biological control capacity, which is useful in the bioprospecting stage to design promising biopesticides.

Show Figures and/or Tables
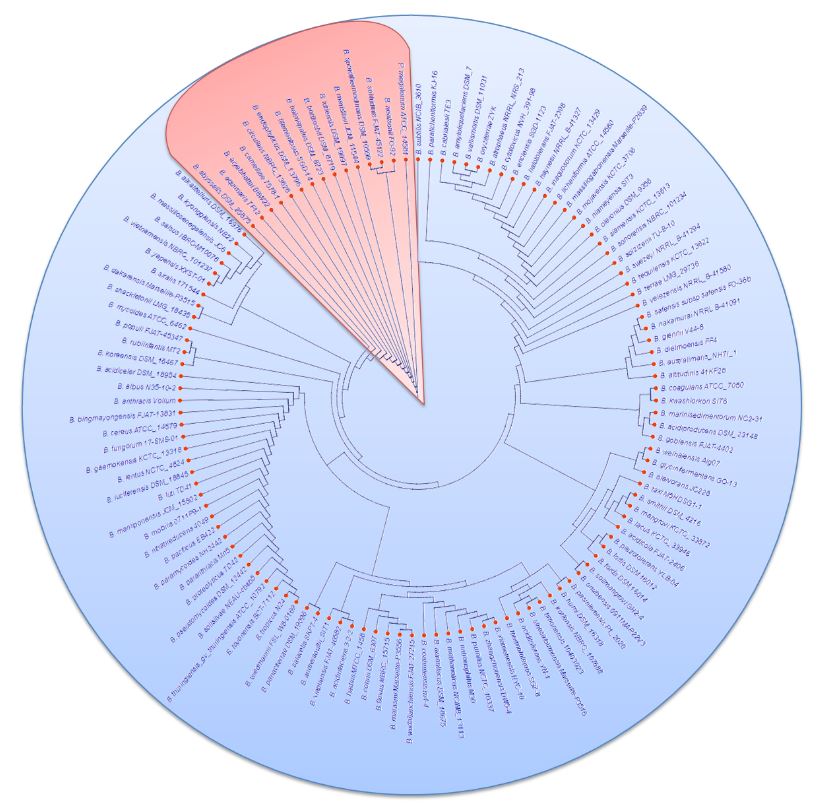
Figure 1. Phylogenomic tree with the 123 studied type <em>Bacillus</em> species, where two main groups were identified: i) B. megaterium (pink color) and ii) B. subtilis (blue color)
Figure 1. Phylogenomic tree with the 123 studied type Bacillus species, where two main groups were identified: i) B. megaterium (pink color) and ii) B. subtilis (blue color)
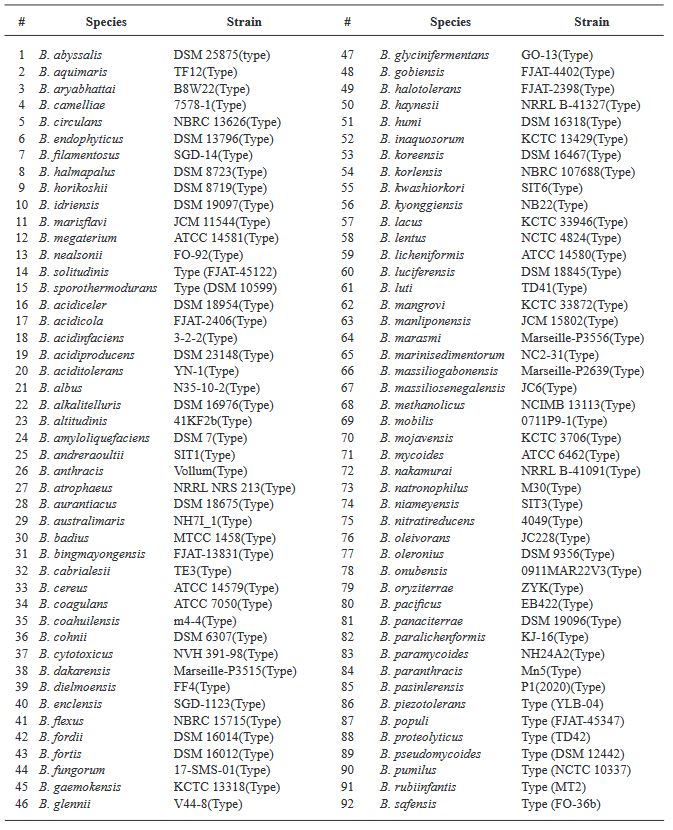
Table 1. Type strain species belonging to the genus <em>Bacillus</em> downloaded from the EzBioCloud platform, which were used in this study
Table 1. Type strain species belonging to the genus Bacillus downloaded from the EzBioCloud platform, which were used in this study
  • Vol. 2024, 42(2)
  • Scientific Article

Aerial and terrestrial digital images for quantification of powdery mildew severity in Ayocote bean (Phaseolus coccineus)

byAlfonso Muñoz Alcalá, Gerardo Acevedo Sánchez, Diana Gutiérrez Esquivel, Oscar Bibiano Nava, Ivonne García González, Norma Ávila Alistac, María José Armenta Cárdenas, María del Carmen Zúñiga Romano, Juan José Coria Contreras, Serafín Cruz Contreras, Gustavo Mora Aguilera*

Received: 18/July/2023 – Published: 06/March/2024
DOI: https://doi.org/10.18781/R.MEX.FIT.2312-1

Abstract Background/Objective. Epidemiological research on Phaseolus coccineus is lacking. The aim was to develop and validate digital methods to quantify the severity associated with powdery mildew in ayocote bean.

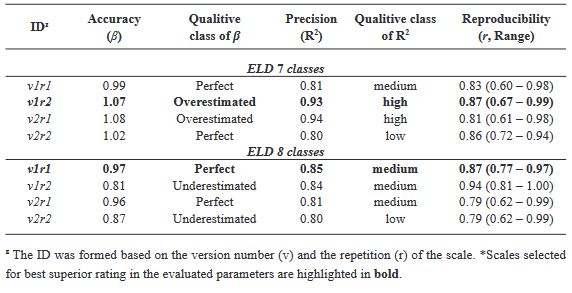
Materials and Methods. An ayocote bean plot with 65.3 % incidence and 22.7 % average powdery mildew foliar severity was selected. Based on 250 leaves collected in field with varying severity degrees, eight 7- and 8-class logarithmic-diagrammatic scales (ELD) were designed and validated in a controlled environment (CEV) and field (FV). In Rstudio®, accuracy (β), precision (R2), reproducibility (r), and agreement level were determined with Cohen’s kappa index (κw) and Lin’s concordance coefficient (LCC). Additionally, a Hierarchical Cluster Analysis (HCA) was performed by scale and assessment environment for clustering by similarity evaluation. In ArcMap® v10.3, in a 15-quadrant block, an ‘image segmentation’ analysis was performed using supervised classification and maximum likelihood to estimate powdery mildew severity and an indicator of canopy coverage index (VCI).

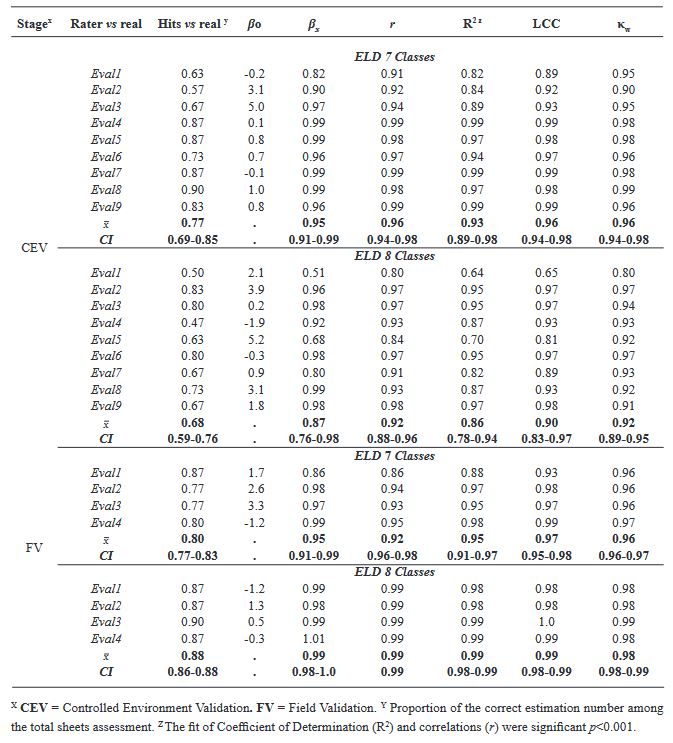
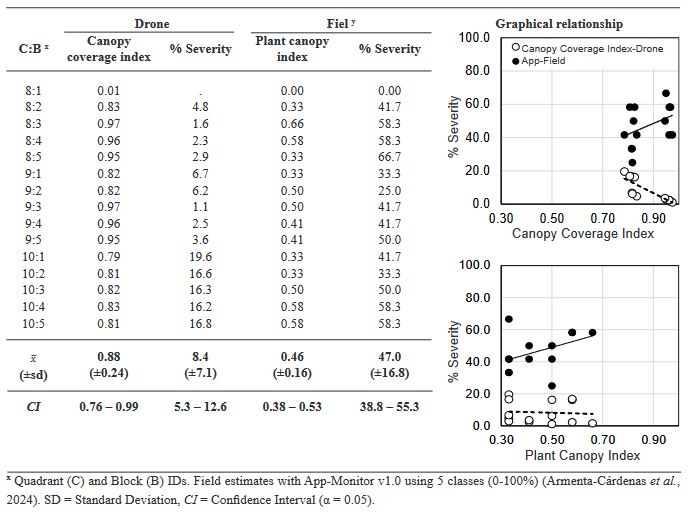
Results. In VEC-1, v1r2 (ELD-7c; β=1.07, R2=0.93, r=0.87) and v1r1 (ELD-8c; β=0.97, R2=0.85, r=0.87) scales were best evaluated. In VEC-2, comparing clusters conformed in the HCA, the ELD-7c was the best scored with perfect accuracy (β>0.96), very high precision (R2>0.94), very high reproducibility (r=0.97-0.99) and very high agreement (κw>0.96; LCC>0.97); and in ELD-8c reproducibility and agreement decreased. In VCa, ELD-7c maintained optimal metrics, but ELD-8c reached ideal parameters for preventive ELD in early stages of powdery mildew (β>0.98, R2>0.98, r=0.99, κw=0.99-0.999, LCC=0.98-0.999). Image analysis estimated severity = 8.4 % (CI = 5.3 - 12.6 %) and ICV = 0.88 (CI = 0.76 - 0.99), contrasting with field assessment 47 % (CI = 38.8 - 55.3 %) and 0.46 (CI = 0.76 - 0.99), respectively, mainly with ICV > 0.94 due to less symptomatic leaf exposure. Suggests applicability for canopy estimation with restrictions for severity based on pathogen expression.

Conclusion. A methodology for ELD development is proposed, comprising: image acquisition, processing and quantification; controlled validation and field validation. Validation statistics included precision (R2); accuracy (β); reproducibility (Pearson’s coefficient and Hierarchical Cluster Analysis); and agreement (Lin’s Coefficient and Kappa Index), proposed in a comprehensive approach for first time. RGB-drone images are proposed to estimate a comprehensive vigor and severity coverage index.

Show Figures and/or Tables
Figure 1. Final versions of logarithmic-diagrammatic severity scales for powdery mildew in Ayocote bean (<em>Phaseolus coccineus</em>), selected for field validation. A) 7-class logarithmic-diagrammatic scales; B) 8-class logarithmic-diagrammatic scales.
Figure 1. Final versions of logarithmic-diagrammatic severity scales for powdery mildew in Ayocote bean (Phaseolus coccineus), selected for field validation. A) 7-class logarithmic-diagrammatic scales; B) 8-class logarithmic-diagrammatic scales.
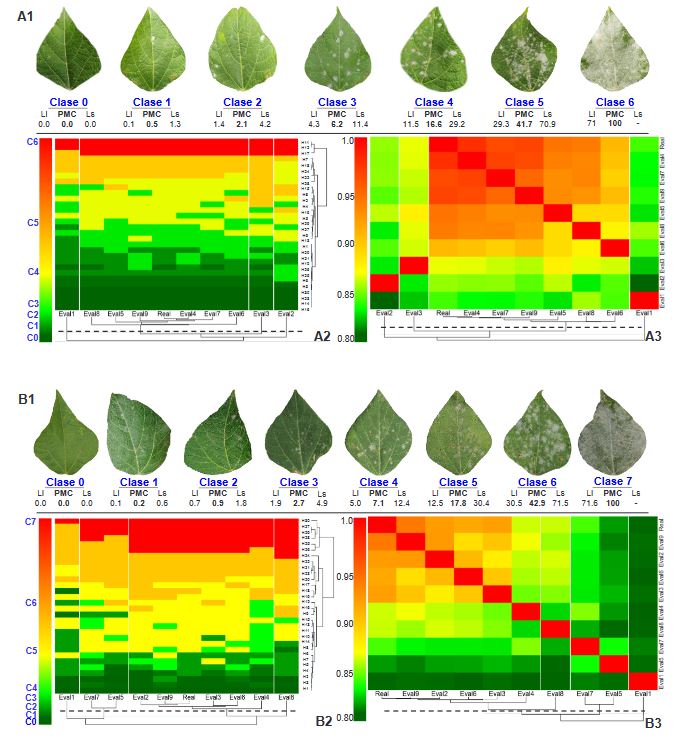
Figure 2. A1 and B1. Logarithmic-diagrammatic scales of 7 and 8 classes for assessment of powdery mildew severity on Ayocote bean (<em>P. coccineus</em>) leaves, during the Controlled Environment Validation (CEV) process of 30 leaves by nine raters. A2 and B2. Heatmap of Pearson correlation coefficient (r) among nine raters by severity scale. Values of r = 0.8 – 1 indicate the reproducibility of each scale among raters. A3 and B3. Heatmap of severity class in 30 leaves evaluated by scale and rater. The color represents the class value assigned by the rater for each leaf. For rater and leaves, a Hierarchical cluster analysis is plotted, grouped by the complete method and Euclidean distance.
Figure 2. A1 and B1. Logarithmic-diagrammatic scales of 7 and 8 classes for assessment of powdery mildew severity on Ayocote bean (P. coccineus) leaves, during the Controlled Environment Validation (CEV) process of 30 leaves by nine raters. A2 and B2. Heatmap of Pearson correlation coefficient (r) among nine raters by severity scale. Values of r = 0.8 – 1 indicate the reproducibility of each scale among raters. A3 and B3. Heatmap of severity class in 30 leaves evaluated by scale and rater. The color represents the class value assigned by the rater for each leaf. For rater and leaves, a Hierarchical cluster analysis is plotted, grouped by the complete method and Euclidean distance.
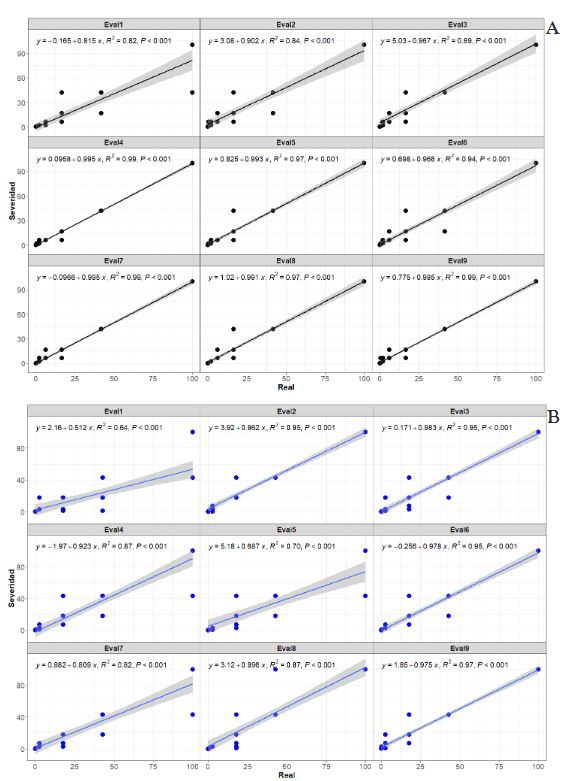
Figure 3. Correlation graphs between severity (y) assessed using the scale and real values (x) by nine raters during the Controlled Environment Validation (CEV) with 30 <em>Phaseolus coccineus</em> leaves. The linear regression equation (y = βo + βx + e) is fitted to determine β, R2, and p-value parameters using the stat_poly_eq function. A. LDS-7 classes. B. LDS-8 classes.
Figure 3. Correlation graphs between severity (y) assessed using the scale and real values (x) by nine raters during the Controlled Environment Validation (CEV) with 30 Phaseolus coccineus leaves. The linear regression equation (y = βo + βx + e) is fitted to determine β, R2, and p-value parameters using the stat_poly_eq function. A. LDS-7 classes. B. LDS-8 classes.
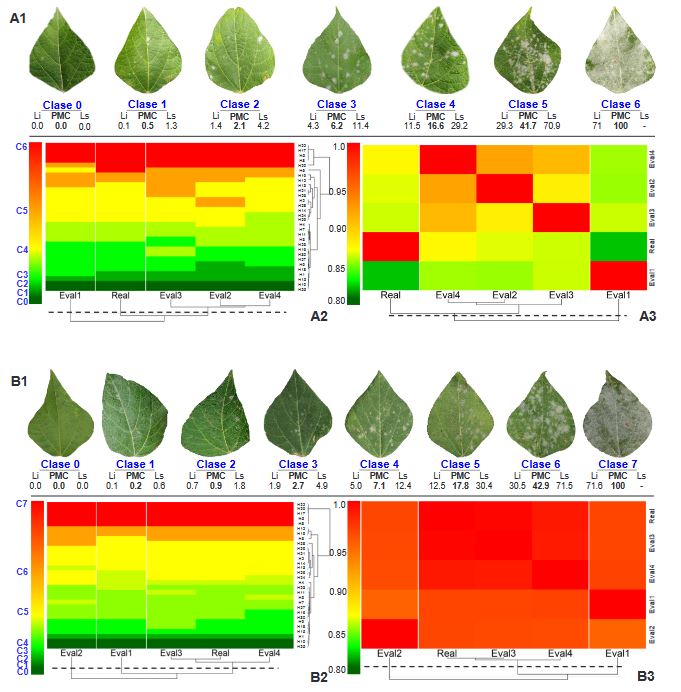
Figure 4. A1 and B1. Logarithmic-diagrammatic scale of 7 and 8 classes for assessing powdery mildew severity on Ayocote bean (<em>P. coccineus</em>) leaves during the validation process of 30 leaves in the field by four selected raters. A2 and B2. Heatmap of Pearson correlation coefficient (r) among nine raters based on severity scale. Values of r = 0.8 – 1 indicate the reproducibility level of each scale among raters. A3 and B3. Heatmap of severity class on 30 leaves assessed by scale and rater. The color represents the class value assigned by the rater to each leaf. Hierarchical cluster analysis is performed by grouping raters and leaves using the ‘complete’ method and Euclidean distance
Figure 4. A1 and B1. Logarithmic-diagrammatic scale of 7 and 8 classes for assessing powdery mildew severity on Ayocote bean (P. coccineus) leaves during the validation process of 30 leaves in the field by four selected raters. A2 and B2. Heatmap of Pearson correlation coefficient (r) among nine raters based on severity scale. Values of r = 0.8 – 1 indicate the reproducibility level of each scale among raters. A3 and B3. Heatmap of severity class on 30 leaves assessed by scale and rater. The color represents the class value assigned by the rater to each leaf. Hierarchical cluster analysis is performed by grouping raters and leaves using the ‘complete’ method and Euclidean distance
Figure 5. Correlation plots between severity (y) assessed by scale and actual values (x) from four raters during Field Validation (VCa) with 30 <em>Phaseolus coccineus</em> leaves. The linear regression equation (y = βo + βx + e) is fitted to determine parameters β, R2, and p-value using the stat_poly_eq function. A. LDS-7classes. B. LDS-8classes.
Figure 5. Correlation plots between severity (y) assessed by scale and actual values (x) from four raters during Field Validation (VCa) with 30 Phaseolus coccineus leaves. The linear regression equation (y = βo + βx + e) is fitted to determine parameters β, R2, and p-value using the stat_poly_eq function. A. LDS-7classes. B. LDS-8classes.
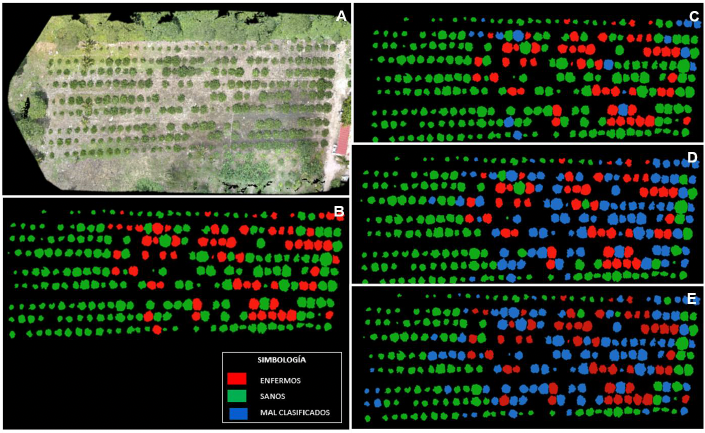
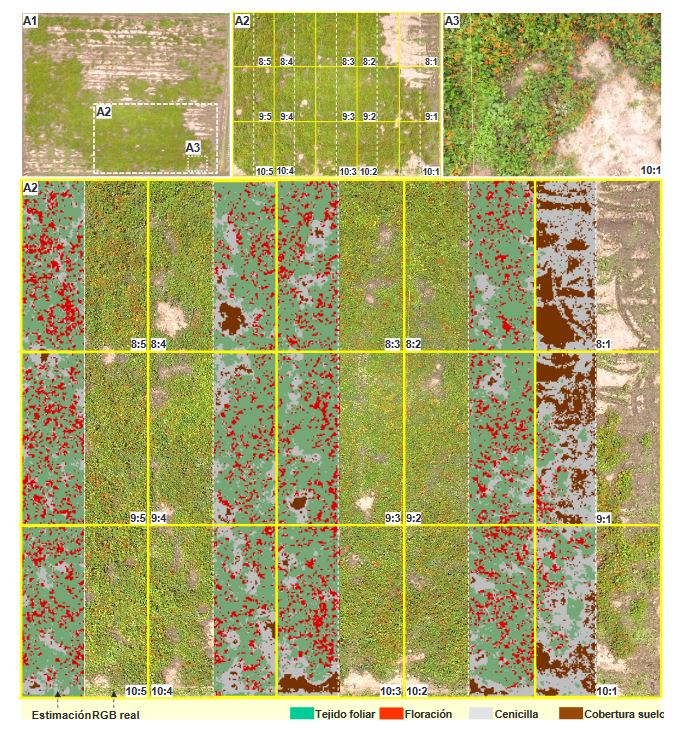
Figure 6. Estimation of canopy and severity indicators using RGB imagery (13 mpx) from Phantom 3 processed through supervised segmentation algorithm in ArcMap® v10.3. A1. Image of the total experimental area (40 x 52 m). Captured at 50 m altitude. A2. Block of 15 selected quadrants based on uniformity in host continuity, canopy, and maximum inductivity. Continuous yellow lines depict quadrant divisions. Dashed white lines represent selected blocks for algorithm versus real image estimation. Captured at 27 m. A3. Image at 5 m of a selected sector for designing ‘RGB signature’ with crop categories (foliar tissue, flowering, powdery mildew, and soil coverage).
Table 1. Average accuracy (β), precision (R2), and reproducibility (r) of eight logarithmic-diagrammatic severity scales for evaluating powdery mildew in <em>Phaseolus coccineus</em>.
Table 1. Average accuracy (β), precision (R2), and reproducibility (r) of eight logarithmic-diagrammatic severity scales for evaluating powdery mildew in Phaseolus coccineus.
Table 2. Parametric comparison of nine raters relative to the real value, to determine accuracy (βx), precision (R2), and agreement (LCC, κw) by severity class assessed during the validation process in a controlled environment (CEV) and in the field (FV)
Table 3. Comparison of canopy coverage index (VCI), plant canopy (PVI), and powdery mildew severity percentage estimated using RGB-drone image and field assessments.
  • Vol. 2024, 42(2)
  • Phytopathological Note

Genetic variability of two Mexican Tomato brown rugose fruit virus isolates and expression of symptoms in tomato and pepper

byNorma Ávila Alistac, Gustavo Mora Aguilera, Héctor Lozoya Saldaña*, Erika J Zamora Macorra, Camilo Hernández Juárez

Received: 18/July/2023 – Published: 06/March/2024
DOI: https://doi.org/10.18781/R.MEX.FIT.2311-2

Abstract Background/Objective. The objective was to analyze the variability of two Mexican isolates of ToBRFV after a process of inoculation and multiplication in different commercial and Mexican landraces of tomato (Solanum lycopersicum) (15 materials) and pepper (Capsicum annuum) (20 materials), and to evaluate the expression of symptoms under greenhouse conditions.

Materials and Methods. In greenhouses, the post-infection variability of two isolates was analyzed: EM-JI2021 (State of Mexico) and C-JI2021 (Colima) in 15 genotypes of tomato and 20 of pepper. Each isolate was mechanically inoculated on five plants per genotype with a total of 150 plants (56 days old) of tomato and 200 of pepper. Three plants per genotype were used as controls. Sixty-one days after inoculation, one leaf per plant was collected for RT-PCR. Incidence and symptom expression were recorded. RNA extraction was by 2% CTAB. ToBRFV-F/ ToBRFV-R primers amplifying 475 bpb of the RpRd gene were used (SENASICA-CNRF). 24 RT-PCR products were sequenced, cleaned and aligned with NCBI Genbank records using MEGAv11.0.13. Based on epidemiological criteria, 34 sequences were selected from GenBank for variability analysis.

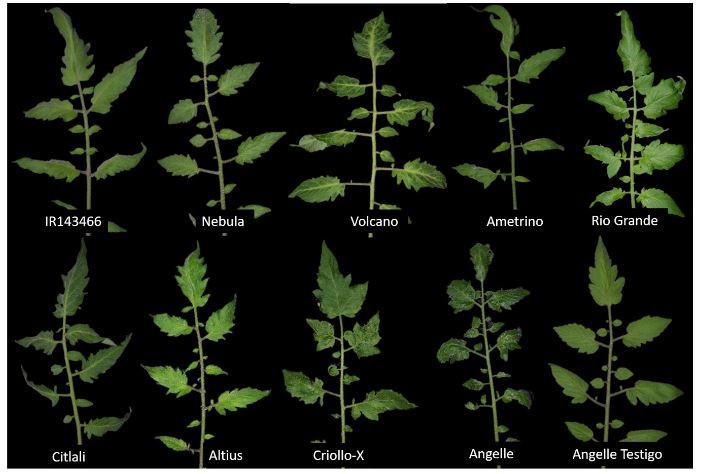
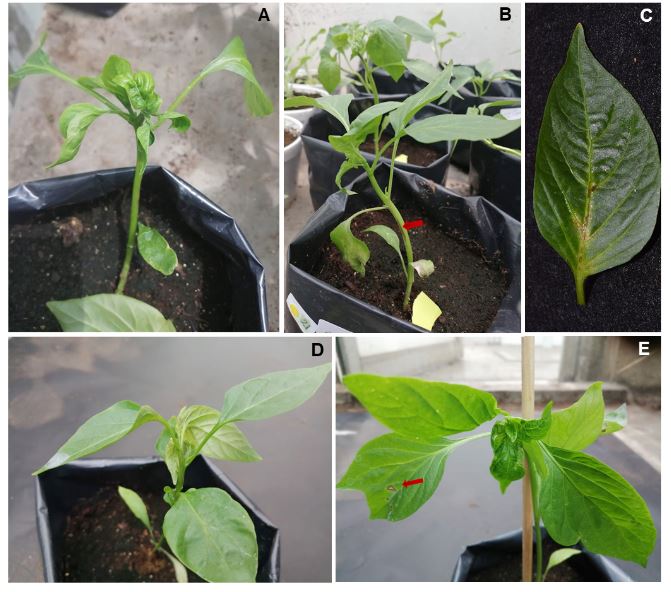
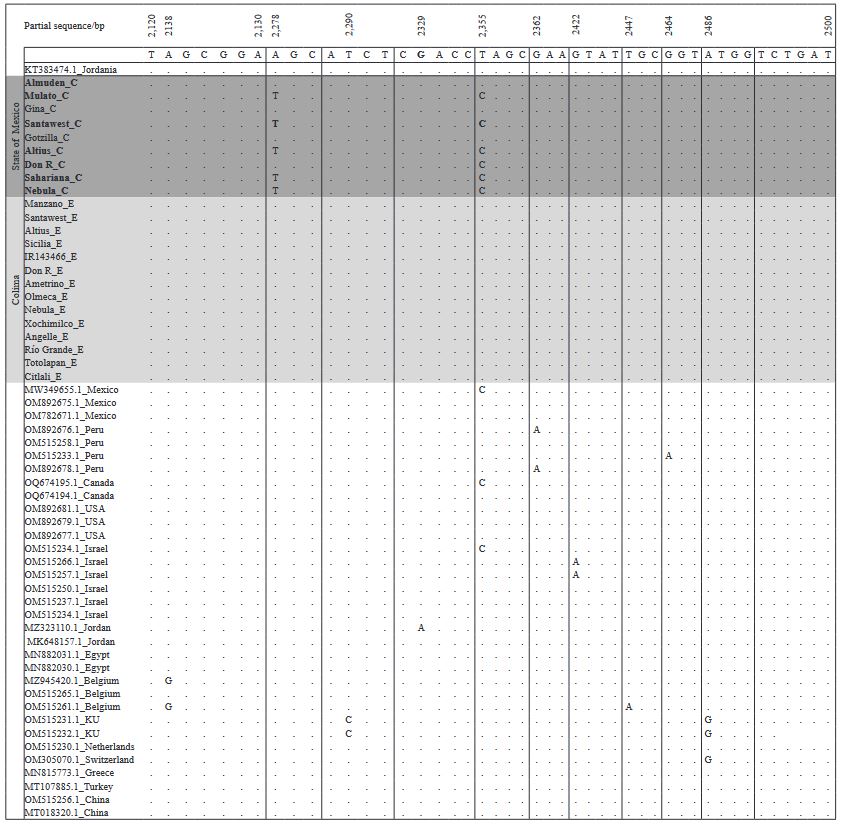
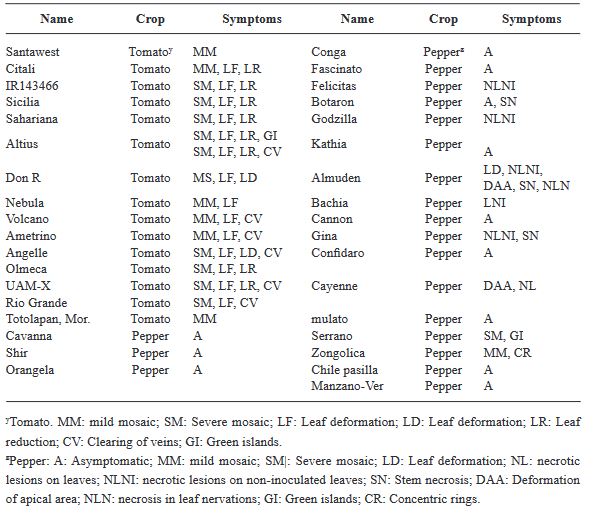
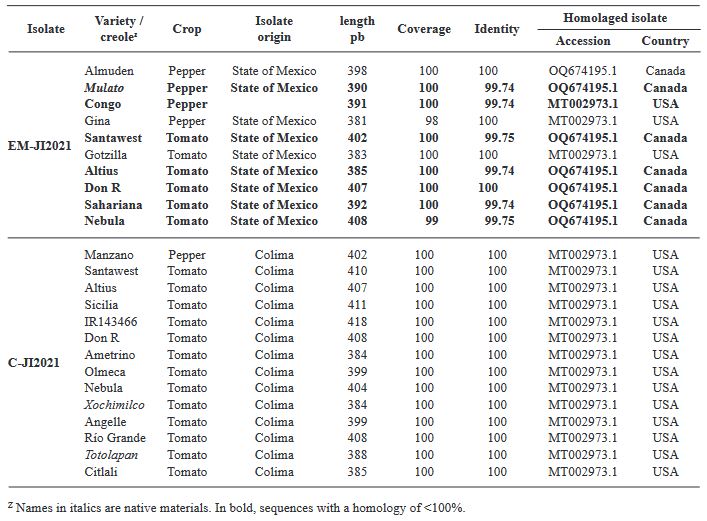
Results. Ten days after inoculation, tomato genotypes exhibited severe mosaic, mild mosaic, and reduced leaf area. In pepper, symptoms differentiated by genotype were observed, including hypersensitivity reaction, leaf deformation, stem necrosis, mosaic, yellowing, necrotic lesions, and asymptomatic condition. Between position 2,124 to 2,500 bp there was 99.74 % homology with the first report of ToBRFV in Jordan (KT383474.1). Homology >99.74 % was found with isolates from USA (MT002973.1) and Canada (OQ674195.1). C-JI2021 exhibited no variability, while EM-JI2021 generated three haplotypes: One nucleotide change (c.2,355T>C) was detected in Mulato (pepper) and Don R (tomato), while two substitutions (c.2,278A>T; c.2,355T>C) were detected in Santawest, Altius, Sahariana and Nebula (tomato).

Conclusion. The pathogenic intensity of ToBRFV varied from asymptomatic to severe depending on the combination of host, genotype, and haplotype. In short periods of infection, three haplotypes were detected, suggesting host-dependent mutagenic capacity of the virus.

Show Figures and/or Tables
Figure 1. Symptoms in commercial and native tomato material inoculated with Tomato brown rugose fruit virus. Symptoms of mild mosaic (IR143466, Nebula, Ametrino, Rio Grande, Citlali, Altius); severe mosaic, deformation and clearing of main leaf nervations (Volcano, Criollo-X and Angelle); healthy plant (Angelle control)
Figure 2. Symptoms in chili (Capsicum annumm) inoculated with Tomato brown rugose fruit virus. A-C) Symptoms of apical deformation, necrosis in stem and nervations of Almuden leaves; D) Symptoms of apical deformation, slight necrosis in Cayenne nervations; E) Symptoms of apical deformation, mosaic, necrotic lesions in non inoculated Felicitas leaves
Figure 3. Alignment of the partial sequence of the tomato brown rugose fruit virus replicase gene from 24 sequences of isolates obtained from 35 genotypes inoculates with isolates EM-JI2021 and C-JI2021, and from 34 sequences from different tomato and chili-producing countries. The alignment was performed using Geneious
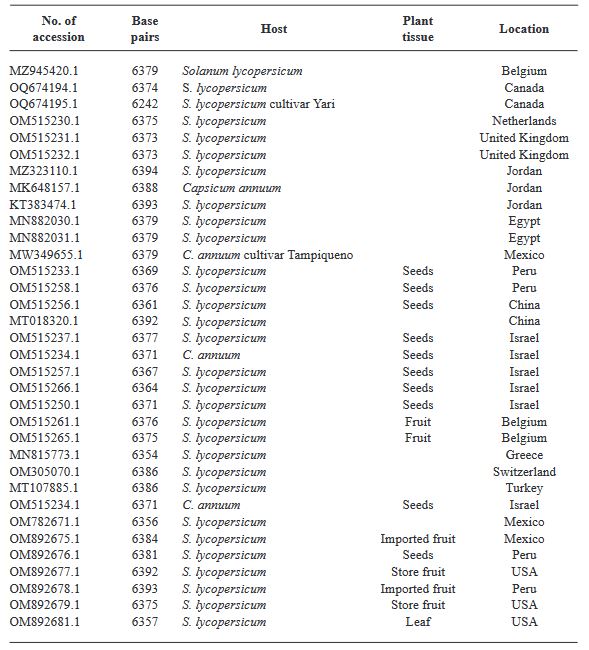
Table 1. Complete Tomato brown rugose fruit virus sequences obtained from the GenBank (NCBI) used for the alignment and compares with ToBRFV sequences from the study
Table 2. Symptoms pf Tomato brown rugose fruit virus in commercial and native tomato and pepper materials expressed under greenhouse conditions
Table 3. Percentage of coverage and identity of two ToBRFV isolations inoculated in a total of 35 tomato and pepper genotypes under greenhouse conditions
  • Vol. 2024, 42(2)
  • Phytopathological Note

Expression of the RPM1-RIN4-RPS2 complex in two citrus species with contrasting response to Huanglongbing

byEric Ángel Mendoza Pérez, Ricardo Santillán Mendoza, Humberto Estrella Maldonado, Cristian Matilde Hernández, Felipe Roberto Flores de la Rosa*, Jacel Adame García

Received: 18/July/2023 – Published: 06/March/2024
DOI: https://doi.org/10.18781/R.MEX.FIT.2307-6

Abstract Objective/Antecedents. Persian lime (Citrus latifolia) shows a very high level of tolerance to Huanglongbing (HLB). A recent study suggests that genes from the RPM1-RIN4-RPS2 complex could be partly responsible for HLB tolerance in Persian lime, unlike other highly susceptible species such as orange (C. sinensis). The objective of this study was to compare the expression of this gene complex between orange, highly susceptible to HLB, and Persian lime, a tolerant species.

Materials and Methods. Sequences of the three genes of the complex for orange and Persian lime were obtained from databases of previously published works, alignments and primer design for gene expression were performed using various bioinformatics tools. Subsequently, tissue samples from symptomatic HLB-infected orange and Persian lime were obtained and infection was confirmed. The expression of the RPM1-RIN4-RPS2 genes was compared using endpoint RT-PCR.

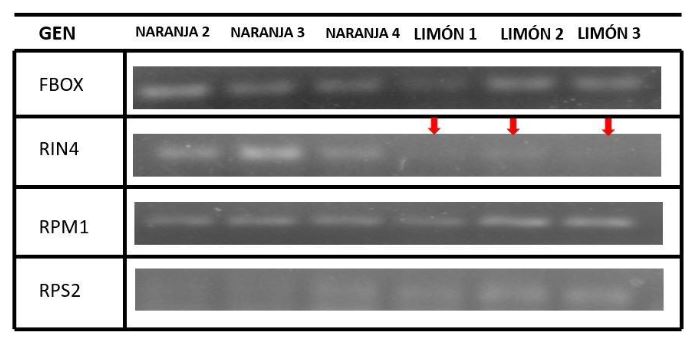
Results. The presence of all three genes of the complex was determined in both orange and Persian lime, and it was also determined that they are highly conserved between both species. Additionally, it was observed that there is no differential expression for the RPM1 gene in symptomatic HLB tissue; however, there is a difference in the expression of the RPS2 and RIN4 genes.

Conclusion. The results suggest that the contrasting response to HLB could be associated with the activity of the interaction of the RIN4 and RPS2 genes, thus, this could be of interest for citrus genetic improvement aiming at HLB control.

Show Figures and/or Tables
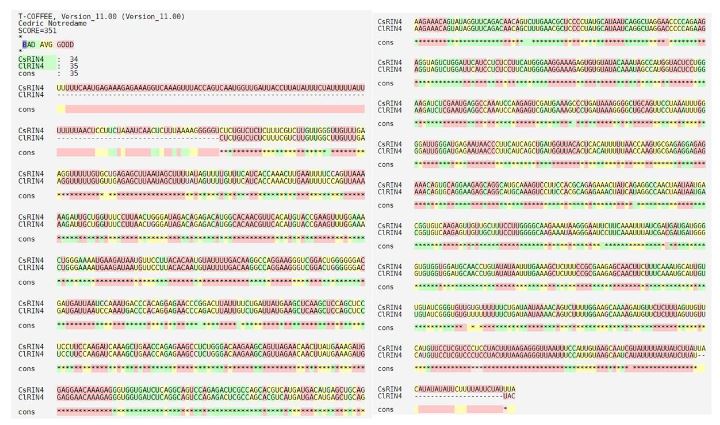
Figure 1. Alignment of CsRIN4 and ClRIN4 genes sequences.
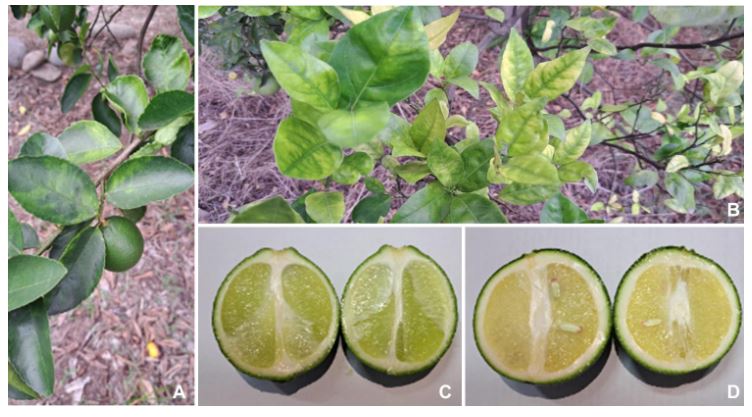
Figure 2. Symptoms of HLB present in Persian lime leaves (A), Valencia orange (B), Persian lemon (C) and Valencia orange (D) fruits
Figure 3. Expression of the RPM1-RIN4-RPS2 complex by RT-PCR in Valencia orange, a species highly susceptible to HLB, and Persian lime, a species with a high level of tolerance to HLB

Page 12 of 16