RMF Logo

Article filters

Search Papers:

For searching before 2024 see Archive (2000-2023)
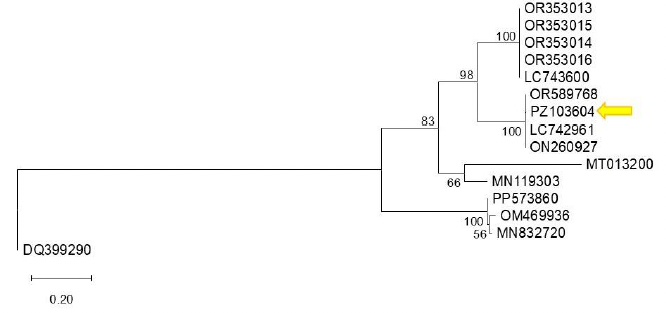
First detection of bell pepper endornavirus infecting bell pepper in Guanajuato, Mexico. Figure 1 - Phylogenetic tree constructed using the Maximum Likelihood method based on the bell pepper endornavirus (BPEV, <em>Alphaendornavirus capsici</em>) polyprotein sequence and other Alphaendornavirus sequences available in GenBank. Reference sequences were selected from GenBank based on their annotation as BPEV isolates and sequence availability. The analysis was performed using the corresponding nucleotide substitution model. Bootstrap support values (1,000 replicates) are indicated at the nodes, showing only those greater than 50%. Sequence PZ103604 (indicated by an arrow) clusters with closely related sequences with high bootstrap support, suggesting a close phylogenetic relationship. Sequence DQ399290 (<em>Betaendornavirus</em>) was used as the outgroup. The scale bar represents 0.20 substitutions per site.

All the Articles

  • Vol. 2026, 44(1)
  • Phytopathological Note

Comparative in vitro and in vivo study of anthracnose in papaya (Carica papaya) caused by Colletotrichum gloeosporioides and Colletotrichum truncatum

byYuridia Rodríguez González, Ernesto Castañeda Hidalgo*, Celerino Robles, Gisela Margarita Santiago Martínez, Verónica Martínez Gallegos, Salvador Lozano Trejo

Received: 23/September/2025 – Published: 16/December/2025
DOI: https://doi.org/10.18781/R.MEX.FIT.2509-3

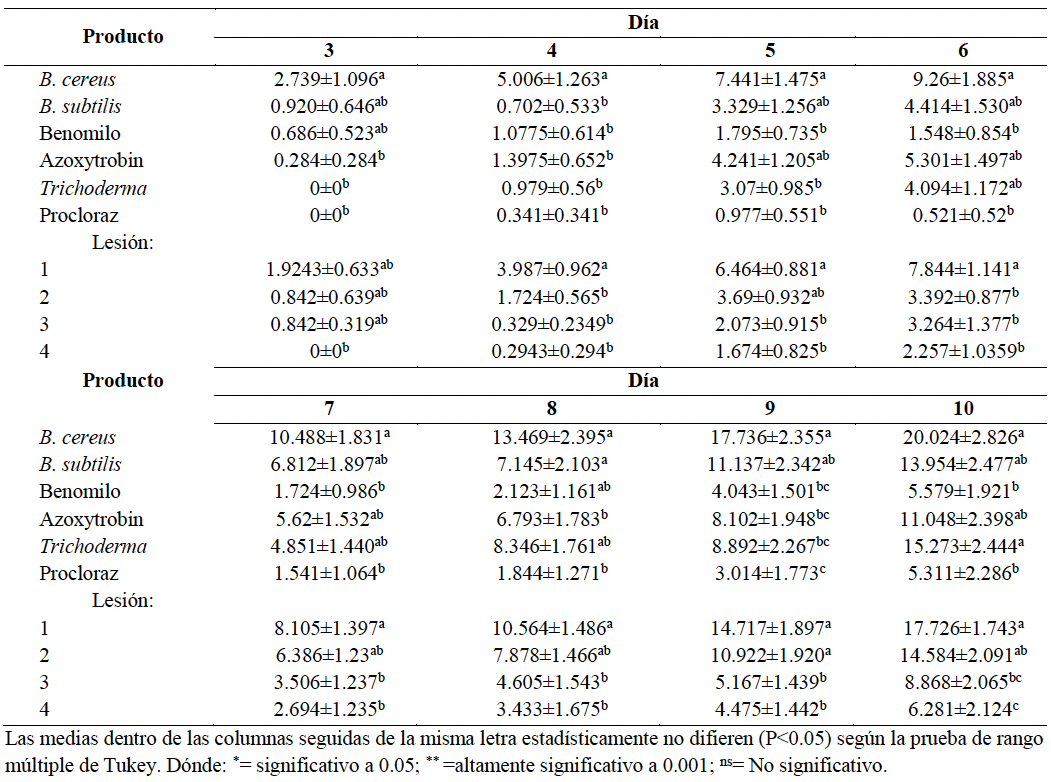
Abstract Background/Objective. Globally, Mexico is the leading exporter of fresh papaya, with Oaxaca being the largest national producer. However, anthracnose, a disease caused by species of the Colletotrichum spp. complex, can affect up to 40% of production. The objective of the research was to identify the causal agent of anthracnose in producing localities of Oaxaca and to evaluate the effectiveness of different products (chemical and biological) in reducing the severity of this disease under in vitro and in vivo conditions.

Experimental Development. A sampling of fruits with anthracnose lesions was carried out at 12 sites in the municipalities of Villa de Tututepec de Melchor Ocampo and Santa María Huazolotitlán, Costa de Oaxaca. The isolates were identified by morphological analysis and microcultures. Three chemical fungicides (prochloraz, benomyl and azoxystrobin) and three biological fungicides (Bacillus subtilis, Trichoderma sp. and Bacillus cereus) were evaluated in vitro and in vivo, with a completely randomized design, with Duncan's mean comparison (p ≤ 0.005).

Results. Colletotrichum gloeosporioides and C. truncatum were identified as being associated with anthracnose. In in vitro tests, prochloraz was the most effective treatment, with inhibition values of 86.42% against C. truncatum and 48.66% against C. gloeosporioides, achieving an overall effectiveness of 75%. Likewise, B. subtilis and Trichoderma sp. showed high in vitro efficacy (≥ 70%), demonstrating a potential for biological control under laboratory conditions.

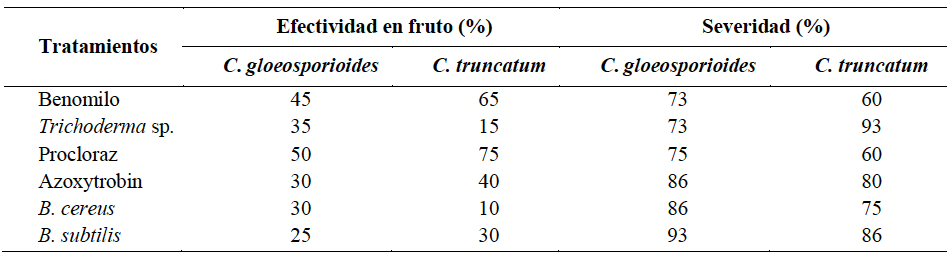
Conclusions. Colletotrichum gloeosporioides (in 66.7% of the sampled sites) and C. truncatum (in 33.3% of the sampled sites) were confirmed as the cause of anthracnose in papaya in the Costa region of Oaxaca. In in vivo tests, prochloraz was the most effective treatment with 75% effectiveness against C. truncatum and 50% against C. gloeosporioides. Benomyl showed intermediate effectiveness, with 65% against C. truncatum and 45% against C. gloeosporioides, with severities of 60-73%. Biological treatments showed low effectiveness: Trichoderma sp. (35 and 15%) and B. subtilis (25 and 30%) for C. gloeosporioides and C. truncatum, respectively, with high severities between 73 and 93%. B. cereus and azoxystrobin showed intermediate behavior, with 30-40% effectiveness and severities of 75-86%. Overall, the results indicate that systemic fungicides outperformed biological agents by more than 30-40% in effectiveness, while biological agents showed less than 35% control and greater than 80% severity, confirming their limited performance in post-harvest.

Show Figures and/or Tables
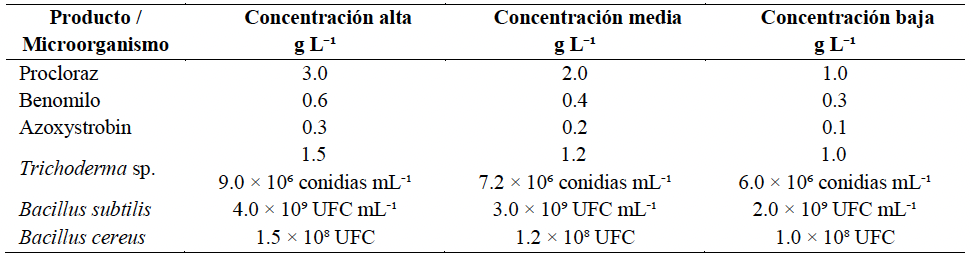
Table 1. Evaluated concentrations of chemical fungicides and biological agents used against <em>Colletotrichum gloeosporioides</em> and <em>C. truncatum</em> in papaya fruits.
Table 1. Evaluated concentrations of chemical fungicides and biological agents used against Colletotrichum gloeosporioides and C. truncatum in papaya fruits.
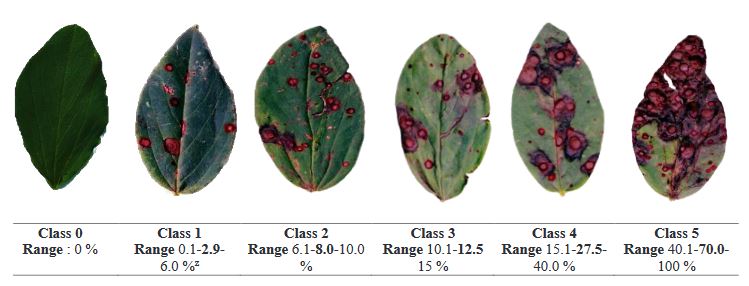
Table 2. Visual and quantitative scale for classifying anthracnose damage in papaya fruits according to lesion area.
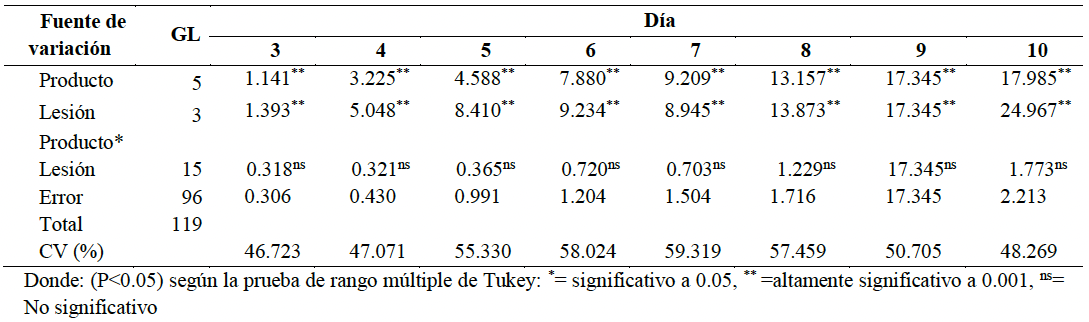
Table 3. Analysis of variance of the effect of different products on lesions in <em>Carica papaya</em> var. Maradol fruits caused by <em>C. truncatum</em> 10 days after inoculation.
Table 3. Analysis of variance of the effect of different products on lesions in Carica papaya var. Maradol fruits caused by C. truncatum 10 days after inoculation.
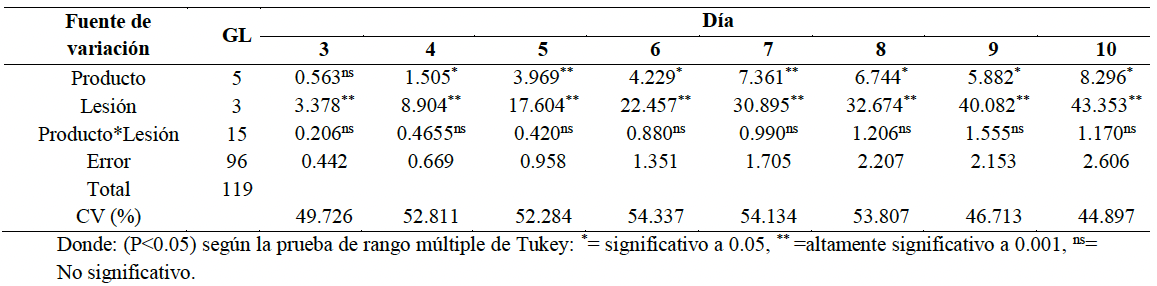
Table 4. Analysis of variance of the effect of different chemical and biological products on lesions in <em>Carica papaya</em> var. Maradol fruits caused by <em>C. gloeosporioides</em>, 10 days after inoculation.
Table 4. Analysis of variance of the effect of different chemical and biological products on lesions in Carica papaya var. Maradol fruits caused by C. gloeosporioides, 10 days after inoculation.
Table 5. Effect of different chemical and biological products on lesions in <em>Carica papaya</em> var. Maradol fruits caused by <em>C. truncatum,</em> 10 days after inoculation.
Table 5. Effect of different chemical and biological products on lesions in Carica papaya var. Maradol fruits caused by C. truncatum, 10 days after inoculation.
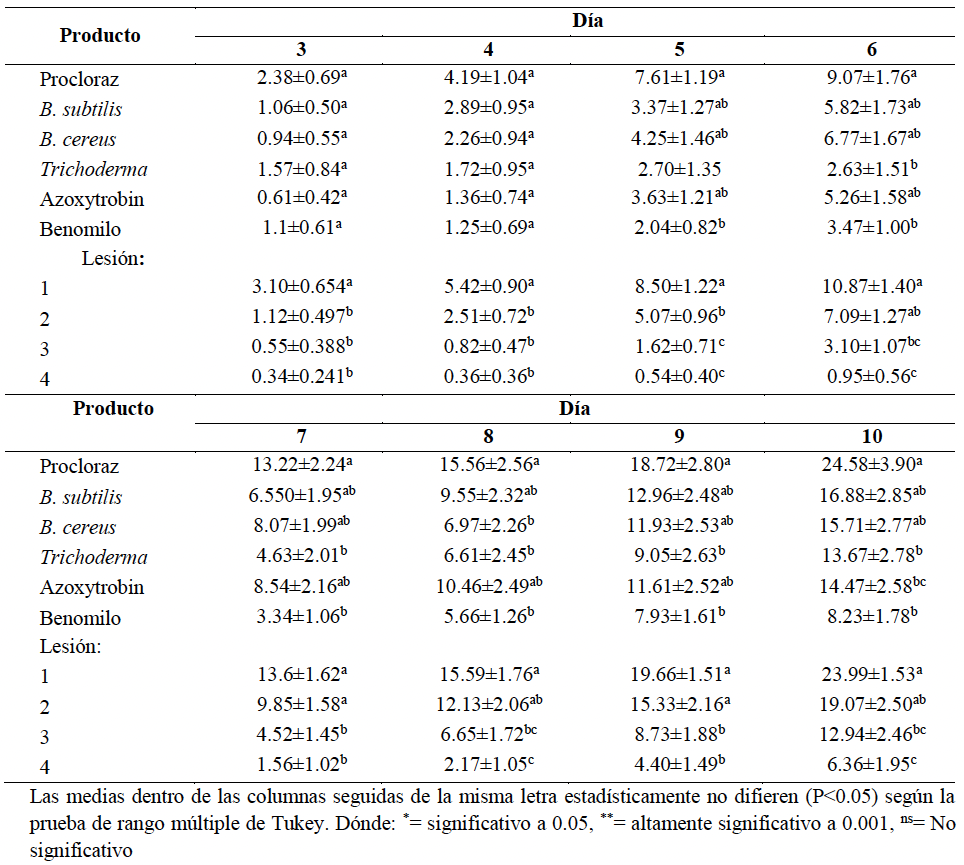
Table 6. Effect of different products on lesions in <em>Carica papaya</em> var. Maradol fruits caused by <em>C. gloeosporioides</em>, 10 days after inoculation.
Table 6. Effect of different products on lesions in Carica papaya var. Maradol fruits caused by C. gloeosporioides, 10 days after inoculation.
Table 7. Effectiveness and severity in Carica papaya var. Maradol fruits of six fungicides seven days after inoculation with <em>C. truncatum</em> and <em>C. gloeosporioides</em> species.
Table 7. Effectiveness and severity in Carica papaya var. Maradol fruits of six fungicides seven days after inoculation with C. truncatum and C. gloeosporioides species.
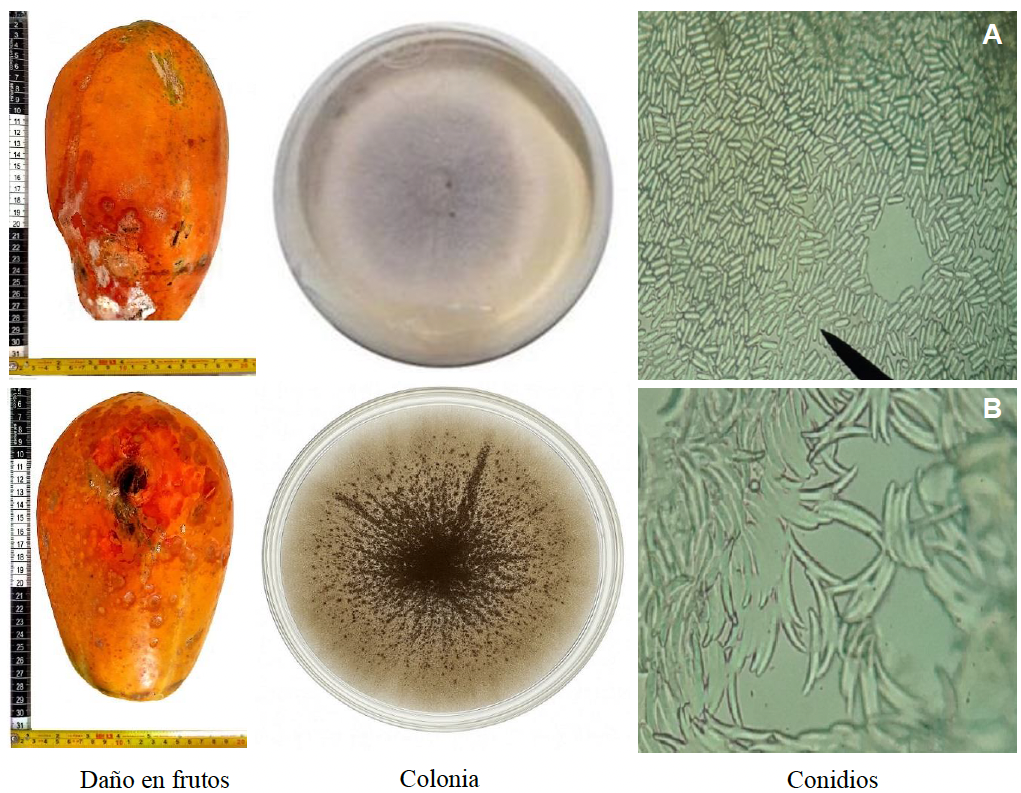
Figure 1. Morphological characteristics of <em>Colletotrichum gloeosporioides</em> (1A) and <em>C. truncatum</em> (1B) isolated from papaya fruits.
Figure 1. Morphological characteristics of Colletotrichum gloeosporioides (1A) and C. truncatum (1B) isolated from papaya fruits.
Figure 2. Inhibition diameter after seven days of growth for <em>C. gloeosporioides</em> (A) and <em>C. truncatum</em> (B) with three doses and six fungicides using the disk diffusion technique. Evaluated doses: prochloraz, H = high 3 g L⁻¹; M = medium 2 g L⁻¹; L = low 1 g L⁻¹; benomyl, H = high 0.6 g L⁻¹; M = medium 0.4 g L⁻¹; L = low 0.3 g L⁻¹; azoxystrobin, H = high 0.3 g L⁻¹; M = medium 0.2 g L⁻¹; L = low 0.1 g L⁻¹; B. subtilis, H = high 4 g L⁻¹; M = medium 3 g L⁻¹; L = low 2 g L⁻¹; <em>Trichoderma</em> spp., H = high 1.5 g L⁻¹; M = medium 1.2 g L⁻¹; L = low 1 g L⁻¹; <em>B. cereus</em> 1.5 × 10⁸ CFU mL⁻¹. Means followed by the same letter within each species are not significantly different (Duncan, 0.05).
Figure 2. Inhibition diameter after seven days of growth for C. gloeosporioides (A) and C. truncatum (B) with three doses and six fungicides using the disk diffusion technique. Evaluated doses: prochloraz, H = high 3 g L⁻¹; M = medium 2 g L⁻¹; L = low 1 g L⁻¹; benomyl, H = high 0.6 g L⁻¹; M = medium 0.4 g L⁻¹; L = low 0.3 g L⁻¹; azoxystrobin, H = high 0.3 g L⁻¹; M = medium 0.2 g L⁻¹; L = low 0.1 g L⁻¹; B. subtilis, H = high 4 g L⁻¹; M = medium 3 g L⁻¹; L = low 2 g L⁻¹; Trichoderma spp., H = high 1.5 g L⁻¹; M = medium 1.2 g L⁻¹; L = low 1 g L⁻¹; B. cereus 1.5 × 10⁸ CFU mL⁻¹. Means followed by the same letter within each species are not significantly different (Duncan, 0.05).
  • Vol. 2026, 44(1)
  • Scientific Article

Etiology of trunk rot in the Enano Verde del Brasil coconut and in vitro efficacy of fungicides in Tabasco, Mexico

byNitzarindany Acencio Castillo, Magdiel Torres-de la Cruz*, Carlos F Ortiz García, Cristian Nava Díaz, Ángel F Huamán Pilco, Manuel Pérez-de la Cruz, Lenin Arias Rodríguez, Ramón A Castillo González

Received: 16/December/2024 – Published: 11/December/2025
DOI: https://doi.org/10.18781/R.MEX.FIT.2412-1

Abstract Background/Objective. Coconut palm (Cocos nucifera) is an important crop in Mexico. In Tabasco, the “Enano Verde del Brasil” (CEVB) variety has been introduced to produce green fruit for coconut water; however, pathological problems of unknown etiology have been observed. The objective of this study was to identify the fungi associated with trunk rot of CEVB coconut in Tabasco, Mexico, and to conduct a comparative in vitro evaluation of the efficacy of systemic and contact fungicides.

Materials and Methods. Fungal isolation in PDA medium was carried out from trunk, spear, and inflorescence samples showing necrosis. The isolates were initially characterized by morphological analysis. Two of them were selected for pathogenicity tests on CEVB seedlings and identified molecularly through the analysis of partial sequences of the ITS gene (ITS1-5.8S-ITS2 of nuclear rDNA). In addition, in vitro bioassays were conducted to compare the efficacy of 10 systemic and contact fungicides. Each fungicide was evaluated at three concentrations (high, recommended, and low), estimating their effect on spore germination (SG) and mycelial growth (MG).

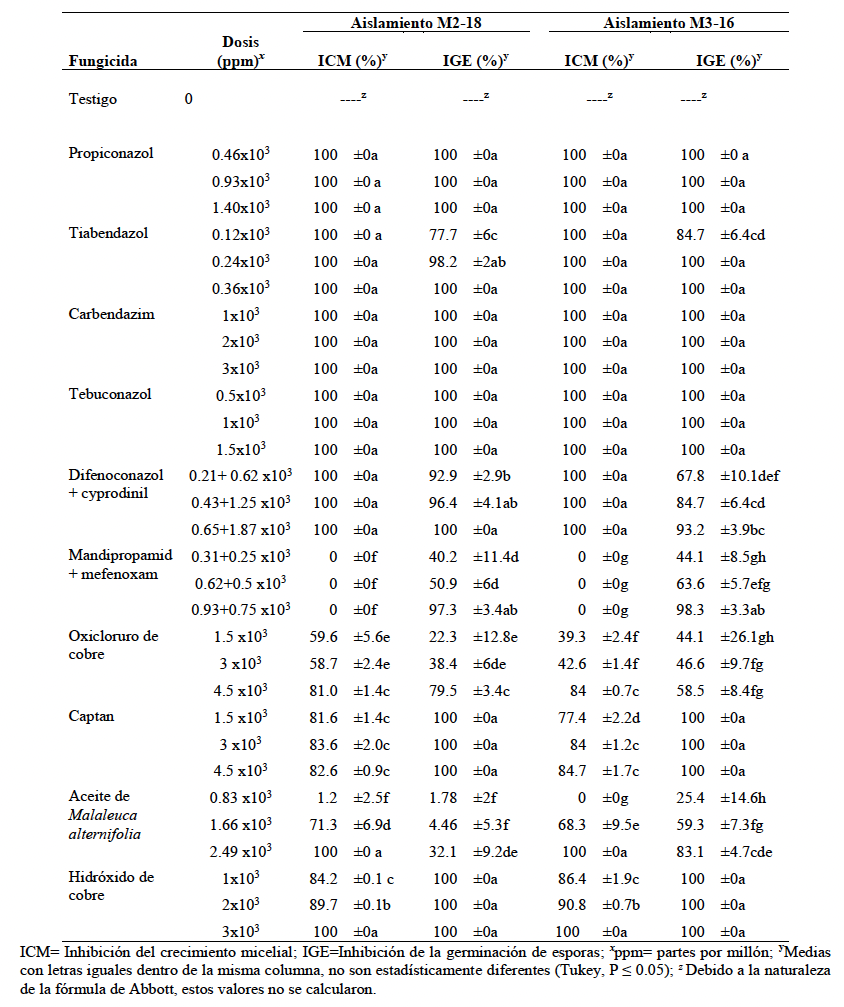
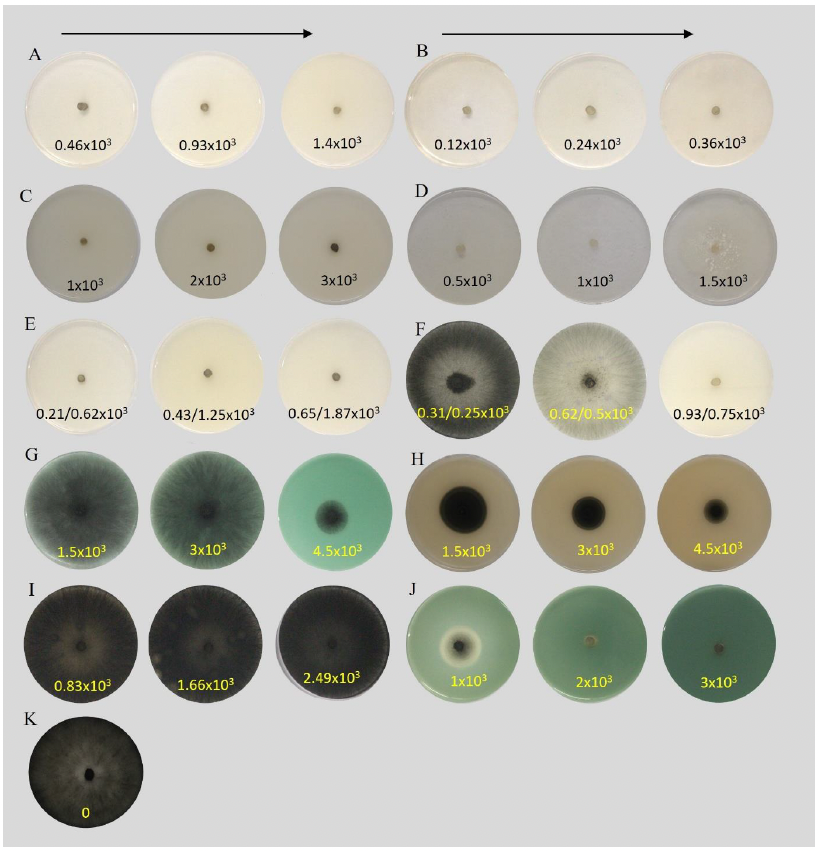
Results. The isolates were identified as Thielaviopsis paradoxa. The pathogenicity tests confirmed T. paradoxa as the causal agent of necrosis in seedlings. The systemic fungicides propiconazole, carbendazim, and tebuconazole showed complete inhibition of MG and SG starting from the lowest dose evaluated (0.45×10³, 1×10³, and 0.5×10³ ppm, respectively). The protectant fungicides copper hydroxide and captan completely inhibited SG at the lowest dose (1×10³ and 1.5×10³ ppm, respectively), although they only reached 80% inhibition of MG.

Conclusion. T. paradoxa is reported for the first time on CEVB in Mexico. This study expands the knowledge on fungi affecting CEVB in Tabasco and provides a basis for the selection of promising fungicides, whose efficacy should be validated in subsequent field studies.

Show Figures and/or Tables
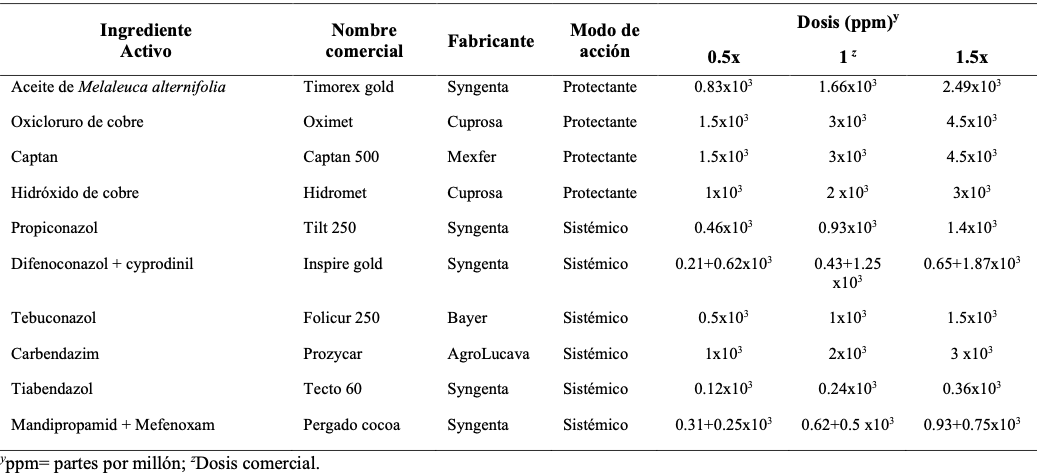
Table 1. Fungicides and doses evaluated <em>in vitro</em> against <em>Thielaviopsis paradoxa.</em>
Table 1. Fungicides and doses evaluated in vitro against Thielaviopsis paradoxa.
Table 2. Effectiveness of systemic and contact fungicides on mycelial growth and conidial germination of two <em>Thielaviopsis paradoxa</em> strains (M2-18 and M3-16) isolated from <em>Cocos nucifera</em>, var. Enano Verde del Brasil, on the coast of Tabasco, Mexico.
Table 2. Effectiveness of systemic and contact fungicides on mycelial growth and conidial germination of two Thielaviopsis paradoxa strains (M2-18 and M3-16) isolated from Cocos nucifera, var. Enano Verde del Brasil, on the coast of Tabasco, Mexico.
Figure 1. Symptoms associated with trunk rot of <em>Cocos nucifera</em> “Enano Verde del Brasil” on the coast of Tabasco, Mexico. <strong>A</strong>) Necrosis on the sheath of basal leaves at the point of attachment to the trunk; <strong>B</strong>) Necrosis at the leaf insertion point on the stipe; <strong>C</strong>) Progression of necrosis toward the interior of the trunk; <strong>D</strong>) Necrosis of the spear leaf; <strong>E</strong>) Necrosis on spathes and inflorescences; <strong>F</strong>) Wilted leaves and “skirt” of leaves attached to the trunk; <strong>G</strong>) Crown collapse with terminal leaves still green; <strong>H</strong>) Downward trunk rot.
Figure 1. Symptoms associated with trunk rot of Cocos nucifera “Enano Verde del Brasil” on the coast of Tabasco, Mexico. A) Necrosis on the sheath of basal leaves at the point of attachment to the trunk; B) Necrosis at the leaf insertion point on the stipe; C) Progression of necrosis toward the interior of the trunk; D) Necrosis of the spear leaf; E) Necrosis on spathes and inflorescences; F) Wilted leaves and “skirt” of leaves attached to the trunk; G) Crown collapse with terminal leaves still green; H) Downward trunk rot.
Figure 2. Morphological characteristics of <em>Thielaviopsis paradoxa</em>. <strong>A</strong>) Fifteen-day-old colony grown on PDA medium; <strong>B</strong>) Conidiophores; <strong>C</strong>) Primary phialoconidia in chains; <strong>D</strong>, <strong>E</strong>) Primary and secondary phialoconidia in chains; <strong>F</strong>, <strong>G</strong>) Aleuroconidia. Scale bars: <strong>B</strong> = 20 μm; <strong>C</strong>, <strong>D</strong>, <strong>E</strong>, <strong>F</strong>, <strong>G</strong> = 10 μm.
Figure 2. Morphological characteristics of Thielaviopsis paradoxa. A) Fifteen-day-old colony grown on PDA medium; B) Conidiophores; C) Primary phialoconidia in chains; D, E) Primary and secondary phialoconidia in chains; F, G) Aleuroconidia. Scale bars: B = 20 μm; C, D, E, F, G = 10 μm.
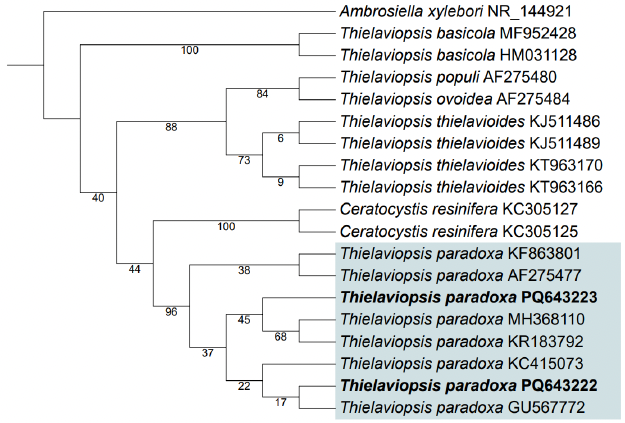
Figure 3. Maximum-likelihood phylogenetic tree constructed using a dataset of partial sequences of the internal transcribed spacer regions 1 and 2 (ITS1 and ITS2) and the intervening 5.8S rDNA subunit for isolates M2-18 (GenBank accession number: PQ643222) and M3-16 (GenBank accession number: PQ643223) of <em>Thielaviopsis paradoxa</em>, obtained from trunk and bud samples of <em>Cocos nucifera</em> “Enano Verde del Brasil” exhibiting trunk rot on the coast of Tabasco, Mexico. Sequence data for other <em>Thielaviopsis</em> (<em>Ceratocystis</em>) strains and species were obtained from GenBank.
Figure 3. Maximum-likelihood phylogenetic tree constructed using a dataset of partial sequences of the internal transcribed spacer regions 1 and 2 (ITS1 and ITS2) and the intervening 5.8S rDNA subunit for isolates M2-18 (GenBank accession number: PQ643222) and M3-16 (GenBank accession number: PQ643223) of Thielaviopsis paradoxa, obtained from trunk and bud samples of Cocos nucifera “Enano Verde del Brasil” exhibiting trunk rot on the coast of Tabasco, Mexico. Sequence data for other Thielaviopsis (Ceratocystis) strains and species were obtained from GenBank.
Figure 4. Pathogenicity tests on coconut seedlings “Enano Verde del Brasil”. <strong>A</strong>, <strong>B</strong>) Necrosis caused by <em>Thielaviopsis paradoxa</em>, strains M2-18 and M3-16, respectively. <strong>C</strong>) Control.
Figure 4. Pathogenicity tests on coconut seedlings “Enano Verde del Brasil”. A, B) Necrosis caused by Thielaviopsis paradoxa, strains M2-18 and M3-16, respectively. C) Control.
Figure 5. <em>In vitro</em> effect of systemic and contact fungicides on<em> Thielaviopsis paradoxa.</em> <strong>A</strong>) Medium with propiconazole; <strong>B</strong>) Medium with thiabendazole; <strong>C</strong>) Medium with carbendazim; <strong>D</strong>) Medium with tebuconazole; <strong>E</strong>) Medium with difenoconazole + cyprodinil; <strong>F</strong>) Medium with mandipropamid + mefenoxam; <strong>G</strong>) Medium with copper oxychloride; <strong>H</strong>) Medium with captan; <strong>I</strong>) Medium with <em>Melaleuca alternifolia</em> oil; <strong>J</strong>) Copper hydroxide; <strong>K</strong>) Control. Numbers within each image indicate the dose in parts per million (ppm). All doses are expressed in units of ×10³.
Figure 5. In vitro effect of systemic and contact fungicides on Thielaviopsis paradoxa. A) Medium with propiconazole; B) Medium with thiabendazole; C) Medium with carbendazim; D) Medium with tebuconazole; E) Medium with difenoconazole + cyprodinil; F) Medium with mandipropamid + mefenoxam; G) Medium with copper oxychloride; H) Medium with captan; I) Medium with Melaleuca alternifolia oil; J) Copper hydroxide; K) Control. Numbers within each image indicate the dose in parts per million (ppm). All doses are expressed in units of ×10³.
  • Vol. 2026, 44(1)
  • Phytopathological Note

Detection of Begomovirus capsicummusive (PepGMV) and associated damage in habanero pepper (Capsicum chinense) in Tabasco

byMiguel Arturo Buitron Broca, Carlos Fredy Ortíz García*, Pedro Antonio Moscoso Ramírez, Eder Ramos Hernández, José Hipólito Rodolfo Mendoza Hernández

Received: 18/June/2025 – Published: 01/December/2025
DOI: https://doi.org/10.18781/R.MEX.FIT.2506-1

Abstract Background/Objective. This study aimed to detect viral agents in four Capsicum chinense cultivars in Tabasco, Mexico; determine disease incidence across five developmental stages; and quantify habanero pepper yield.

Experimental development. A field bioassay was established using the cultivars Palenque F1, Jaguar, Orange, and PX-11459057 in a completely randomized design. ImmunoStrips® (Agdia Inc.) were used to detect Orthotospovirus tomatomaculae (tomato spotted wilt virus, TSWV), Cucumber mosaic virus (CMV), Alfalfa mosaic virus (AMV), and Orthotospovirus iridimaculaflavi (iris yellow spot virus, IYSV). PCR was employed for Begomovirus detection. Viral incidence was evaluated at five time points during the crop cycle, and fruit yield (kg plant-1 y t ha-1) and quality were assessed. ANOVA with Tukey’s test (p ≤ 0.05) was applied.

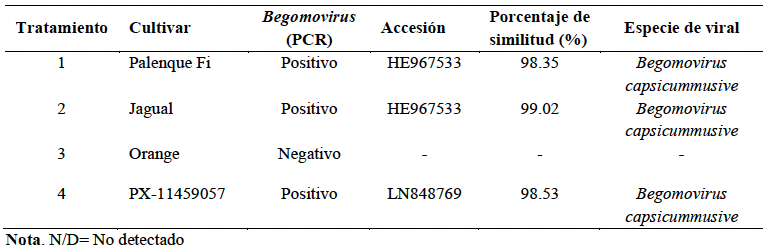
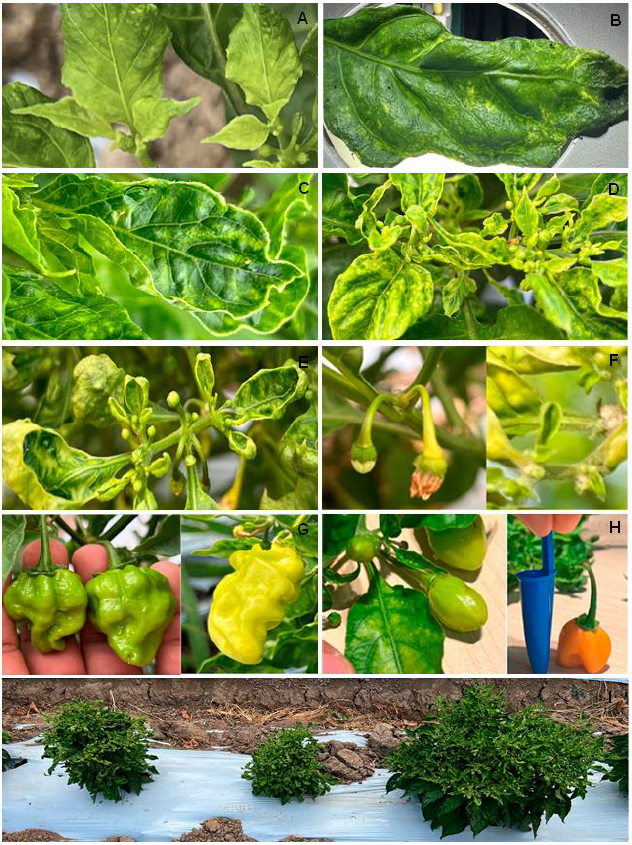
Results. ImmunoStrips® tests were negative for all four analyzed viruses. Begomovirus capsicummusive (pepper golden mosaic virus, PepGMV) tested positive by PCR in cultivars Palenque F1, Jaguar, and PX-11459057, with genetic similarity exceeding 98%. Viral symptoms included interveinal chlorosis, mosaic, leaf deformation, and dwarfing. Incidence surpassed 95% at 113 days after transplanting (dat). Fruit production was negatively affected in both quantity and quality.

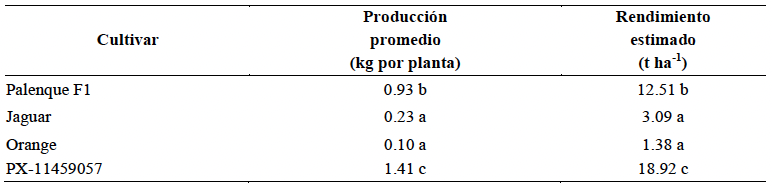
Conclusion. The presence of Begomovirus capsicummusive (PepGMV) was confirmed in habanero pepper in Tabasco, associated with interveinal chlorosis, leaf deformation, and dwarfing, with incidence exceeding 95 % at 113 ddt. Fruit production ranged from 0.1 to 1.41kg ha-1.

Show Figures and/or Tables
Table 1. Percentage similarity of PCR-obtained sequences of viruses associated with habanero pepper plants.
Table 2. Average habanero pepper fruit production per plant and potential yield per hectare.
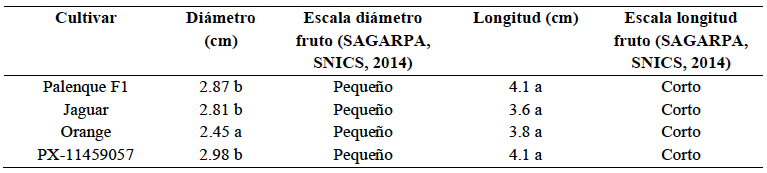
Table 3. Average diameter and length of habanero pepper fruits harvested from plants associated with <em>Begomovirus capsicummusive</em>.
Table 3. Average diameter and length of habanero pepper fruits harvested from plants associated with Begomovirus capsicummusive.
Figure 1. Habanero pepper plants showing different viral symptoms. A) Interveinal chlorosis; B) mosaic; C) leaf rolling; D) curling of apical leaves; E) reduced size of new leaves; F) flower abortion; G) fruit deformation and discoloration; H) reduced fruit size; I) viral symptoms expressed at different plant ages.
Figure 2. Incidence of viral symptoms in habanero pepper plants at different crop development stages. Note. ET = standard error, d = days.
  • Vol. 2026, 44(1)
  • Review Article

Postharvest control of mycotoxigenic phytopathogens in maize: Conventional methods and natural alternatives

byEstefanía Martínez Batista, Surelys Ramos Bell, Edson Rayón Díaz, Gerónimo Díaz Cayetano, Cyndia González Arias, Juan Antonio Herrera González, Javier Ireta Moreno, Porfirio Gutiérrez Martínez*

Received: 17/March/2025 – Published: 27/November/2025
DOI: https://doi.org/10.18781/R.MEX.FIT.2503-2

Abstract Justification. Seeds are the fundamental input for agriculture and food production. Recently, an increase in the demand for maize grain production has been observed; however, annual postharvest losses range between 10 and 40%. The objective of this review is to present the main mycotoxin-producing fungi (genera/species) associated with maize grain during storage, as well as to analyze the conventional control methods and natural alternatives that have been applied to date.

Theoretical and Experimental framework. Bibliographic information was compiled on the main fungal pathogens that develop in maize grain and the most commonly employed control methods. The principal fungal genera detected in maize grain are Aspergillus, Penicillium and Fusarium, all of which are important mycotoxin-producing fungi. Traditional physical and chemical control methods have been used; however, their application often fails to guarantee effectiveness and biosafety. The use of natural alternatives, as well as their combination, has shown positive effects in controlling these phytopathogens and inhibiting mycotoxin production.

Conclusions and Perspectives. One of the main causes of losses and quality deterioration in maize grain is the development of mycotoxin-producing fungi and, consequently, the generation of highly toxic secondary metabolites. To prevent the deterioration of store grain, traditional practices have been employed, such as grain cleaning, aeration at low temperatures, and the use of physical and chemical treatments (synthetic fungicides). Currently, the development of eco-friendly alternatives is one of the primary goals to reduce the use of agrochemicals on seeds and grains, in order to promote more sustainable agricultural systems.

Show Figures and/or Tables
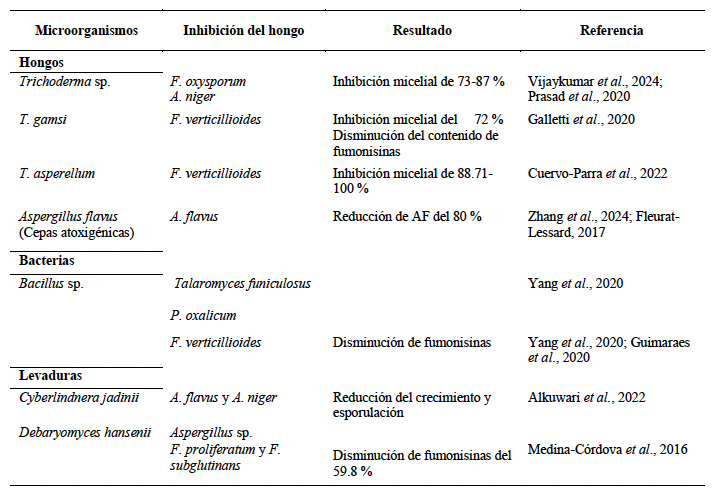
Table 1. Microorganisms used to inhibit the growth of phytopathogens transmitted in maize grains.
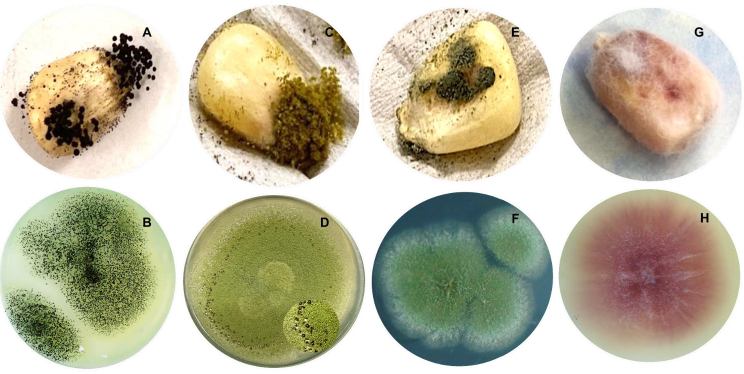
Figure 1. Mycelial characteristics in PDA medium and in maize grains of postharvest fungi; <strong>A-D</strong>) Genus <em>Aspergillus</em>; <strong>E-F</strong>) Genus <em>Penicillium</em>; <strong>G-H</strong>) Genus <em>Fusarium</em>.
Figure 1. Mycelial characteristics in PDA medium and in maize grains of postharvest fungi; A-D) Genus Aspergillus; E-F) Genus Penicillium; G-H) Genus Fusarium.
Figure 2. Visualization of the bibliometric analysis network (VOSviewer® version 1.6.19) using keywords “maize”, AND, “biological control”, OR, “chitosan”, OR, “essential oil”.
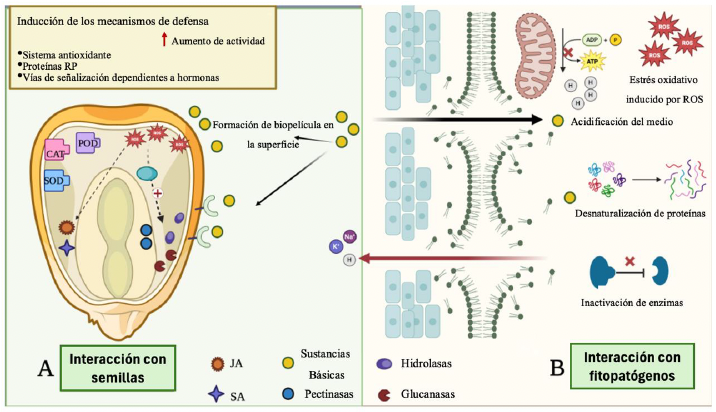
Figure 3. Action mechanisms of basic substances. A) Interaction with seeds: Activation of the defense mechanisms and biofilm formation. B) Interaction with phytopathogens: antifungal effects caused mainly by the interaction of the basic substances with the cell wall and membrane of the pathogen. RP (Related to Pathogens), JA (jasmonic acid), SA (salicylic acid), ROS (Reactive Oxygen Species), POD (Peroxidase), CAT (Catalase), SOD (Superoxide dismutase). Own creation, made using the program BioRender.
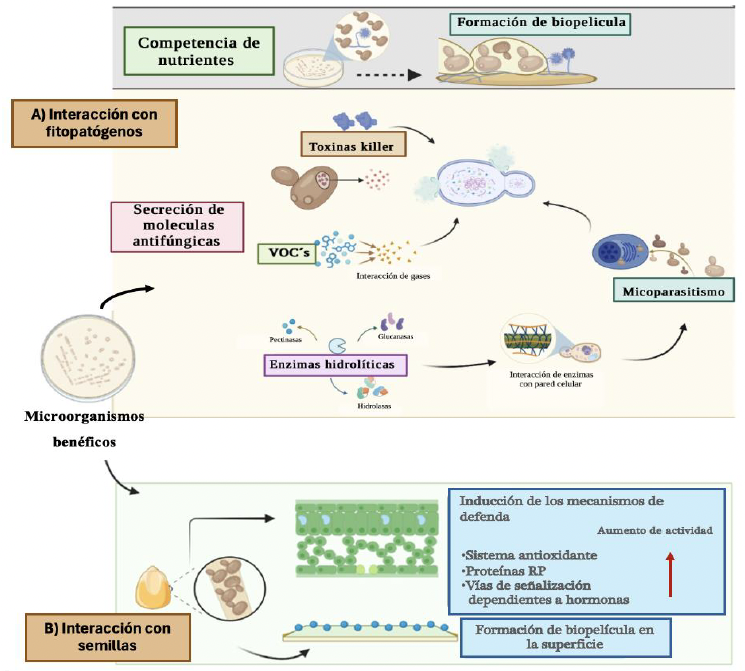
Figure 4. Action mechanisms Beneficial microorganisms. A) Interaction with phytopathogens. B) Interaction with seeds. Image created using the program BioRender.
  • Vol. 2026, 44(1)
  • Phytopathological Note

First report of Fomitopsis meliae causing Damping off in Coffea arabica seedlings in Mexico

byVidal Hernández García, Orlando Cruz Sarmiento, Miguel Ángel Salas Marina*, Luis Alfredo Rodríguez Larramendi, Claudio Ríos Velasco

Received: 23/September/2025 – Published: 18/November/2025
DOI: https://doi.org/10.18781/R.MEX.FIT.2509-4

Abstract Background/Objective. In the Frailesca region of Chiapas, Mexico, coffee nurseries (Coffea arabica) frequently experience high seedling mortality with symptoms attributed to the phytopathological complex known as Damping off. The objective of this study was to diagnose morphologically and molecularly new causal agents of Damping off in coffee seedlings

Experimental development. Coffee seeds and seedlings with symptoms of damping-off of the Typica, Marago, Bourbon, Marsellesa, Costa Rica, Sarchimor, Cerezo amarillo, and Pacamara varieties were collected from seedbeds of producers in the Frailesca region, Chiapas. From these, associated fungi were isolated and identified morphologically using dichotomous keys and molecularly using the ITS1 and ITS4 markers. To confirm their etiology, Koch's postulates were tested under field conditions using 20 seeds from each variety.

Results. Four fungal isolates associated with damping-off symptoms in coffee seedlings were identified: two species of Fusarium (Fusarium oxysporum and Fusarium solani), Phoma costarricensis and Fomitopsis meliae. The latter presented structures such as hyaline cystidioles and was 97.23% molecularly similar to Fomitopsis meliae. Pathogenicity tests confirmed that Fomitopsis meliae is a new causal agent of damping-off, causing symptoms such as root rot, basal stem rot, and seedling death.

Conclusion. This is the first report of Fomitopsis meliae as a new causal agent of damping-off in coffee nurseries of the Typica, Marago, Bourbon, Marsellesa, Costa Rica, Sarchimor, Cerezo amarillo, and Pacamara varieties in Mexico.

Show Figures and/or Tables
Table 1. Coffee farms sampled with <em>Damping off</em> symptoms in the Frailesca region, Chiapas.
Table 1. Coffee farms sampled with Damping off symptoms in the Frailesca region, Chiapas.
Figure 1. Coffee seedlings of different varieties with symptoms of <em>damping-off</em>; A) Marago; B) Typica; C) Costa Rica; D) Sarchimor; E) Marsellesa; F) Bourbon.
Figure 1. Coffee seedlings of different varieties with symptoms of damping-off; A) Marago; B) Typica; C) Costa Rica; D) Sarchimor; E) Marsellesa; F) Bourbon.
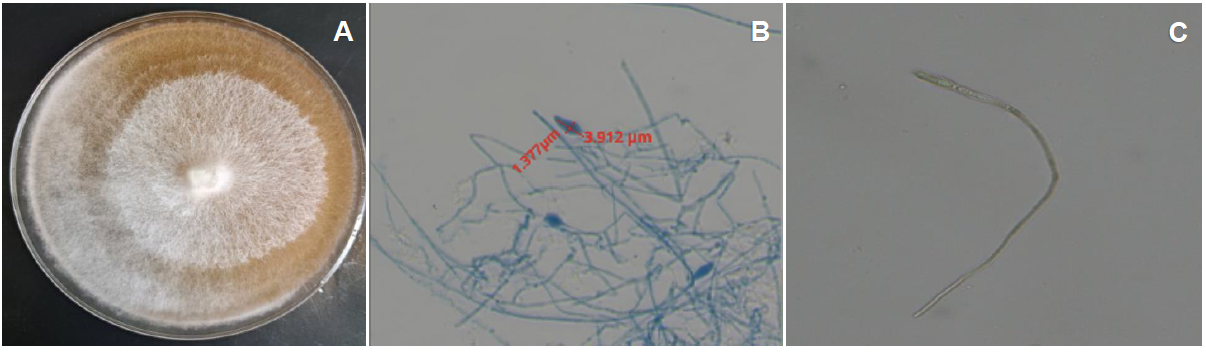
Figure 2. Morphological characteristics of <em>Fomitopsis meliae</em>; A) Colony grown on PDA medium; B) Length and width of the cystidioles; C) Cystidioles in water observed under the microscope at 40X.
Figure 2. Morphological characteristics of Fomitopsis meliae; A) Colony grown on PDA medium; B) Length and width of the cystidioles; C) Cystidioles in water observed under the microscope at 40X.
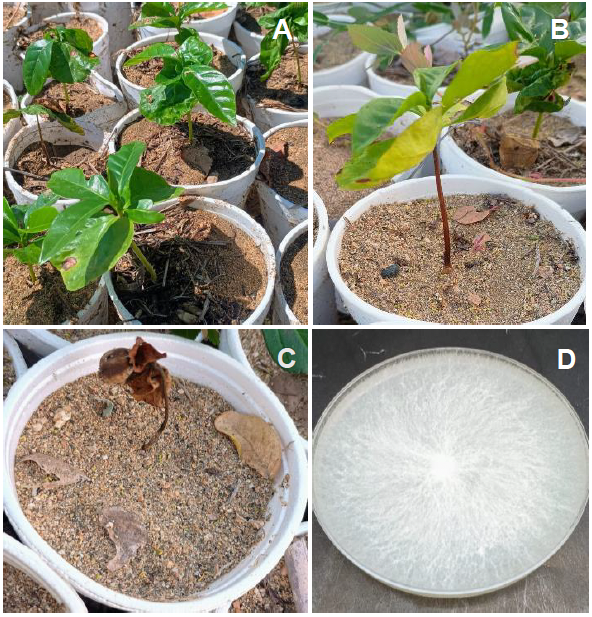
Figure 3. Symptoms produced on coffee seedlings inoculated with <em>Fomitopsis meliae</em>; A) Control seedling; B) Diseased; C) dead plant; D) <em>F</em>. <em>meliae</em> reisolated in PDA medium.
Figure 3. Symptoms produced on coffee seedlings inoculated with Fomitopsis meliae; A) Control seedling; B) Diseased; C) dead plant; D) F. meliae reisolated in PDA medium.
  • Vol. 2026, 44(1)
  • Phytopathological Note

Pochonia chlamydosporia var. chlamydosporia on Meloidogyne incognita eggs from Escuinapa, Sinaloa

byOmar Jiménez Pérez, Bernardo Espinosa Palomeque, Augusto Gil Ceballos Ceballos, Francisco Castillo Reyes, Gabriel Gallegos Morales*

Received: 30/November/2024 – Published: 14/November/2025
DOI: https://doi.org/10.18781/R.MEX.FIT.2024-31

Abstract Background/Objective. Chili cultivation is of great importance to Escuinapa, as it is the largest producer of chili in Sinaloa, Mexico. Its production is affected by various pests, such as the Meloidogyne nematode, which can cause up to 50% losses. Control is based on the application of chemical nematicides. Therefore, the need for more sustainable biocontrol alternatives is crucial. The objective of this study was to isolate and identify the nematode and the nematode-parasitic fungus and to evaluate their in vitro parasitism on the eggs of the root-knot nematode of chili plants in Escuinapa, Sinaloa.

Experimental development. Chili roots with nematode galls were collected to isolate and identify the nematode causing the disease and nematophagous fungi. Females and juveniles were identified by perineal sections and morphometry. The nematophagous fungus was identified morphologically and by molecular sequencing (ITS1 and ITS2). The in vitro parasitism of the fungus on Meloidogyne eggs was evaluated at six spore concentrations plus a control. The percentage of parasitism and the LD50 and LD95 were calculated using probit analysis.

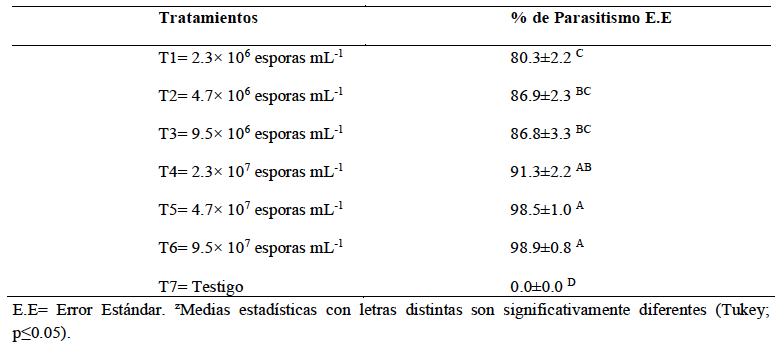
Results. Meloidogyne incognita was morphologically identified as the root-knot nematode of chili plants. In turn, Pochonia chlamydosporia var. chlamydosporia was isolated and identified morphologically and molecularly, which showed high percentages of parasitism (98.9%) in vitro on eggs of this nematode over a period of 48 hours.

Conclusion. A strain of Pochonia chlamydosporia was isolated from Meloidogyne incognita that showed high levels of parasitism in eggs (80 to 98%) of this nematode in vitro. In vivo and field trials could confirm its effectiveness as a bionematicide.

Show Figures and/or Tables
Table 1. Percentage of <em>Pochonia chlamydosporia</em> parasitism on <em>Meloidogyne incognita</em> eggs under <em>in vitro</em> conditions.
Table 1. Percentage of Pochonia chlamydosporia parasitism on Meloidogyne incognita eggs under in vitro conditions.
Table 2. Probabilistic analysis of the concentration of <em>Pochonia chlamydosporia</em> spores on the suppression of <em>Meloidogyne incognita</em> eggs.
Table 2. Probabilistic analysis of the concentration of Pochonia chlamydosporia spores on the suppression of Meloidogyne incognita eggs.
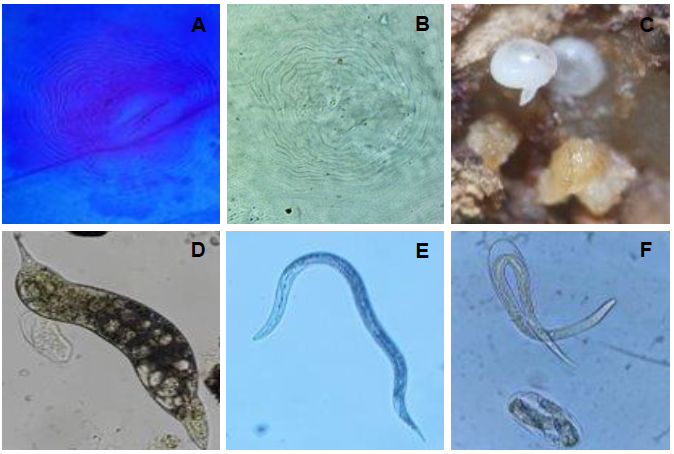
Figure 1. Morphological characteristics of <em>Meloidogyne incognita</em>; A and B) Perianal cut of globose females; C) Globose females; D) Juvenile J4; E) Juvenile stage J2; F) Juvenile stage J2 hatching from the egg.
Figure 1. Morphological characteristics of Meloidogyne incognita; A and B) Perianal cut of globose females; C) Globose females; D) Juvenile J4; E) Juvenile stage J2; F) Juvenile stage J2 hatching from the egg.
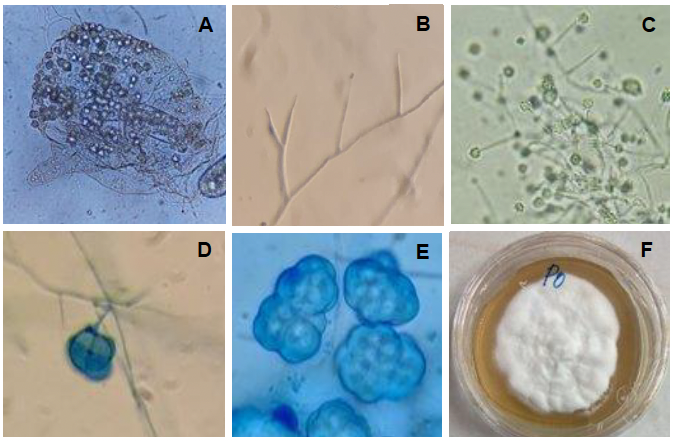
Figure 2. Morphological characteristics of <em>Pochonia chlamydosporia</em> var. <em>chlamydosporia</em>; A) Female globose from which <em>Pochonia</em> was isolated, with the presence of dictyochlamidospores; B) Branched verticillated conidiophores; C) Production of spores in a cluster; D) Formation of a dictyochlamidospore; E) Cluster of dictyochlamidospores; F) Whitish colored mycelium.
Figure 2. Morphological characteristics of Pochonia chlamydosporia var. chlamydosporia; A) Female globose from which Pochonia was isolated, with the presence of dictyochlamidospores; B) Branched verticillated conidiophores; C) Production of spores in a cluster; D) Formation of a dictyochlamidospore; E) Cluster of dictyochlamidospores; F) Whitish colored mycelium.
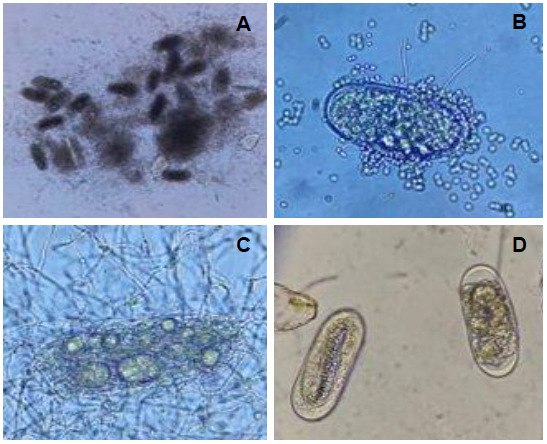
Figure 3. <em>Pochonia chlamydosporia</em> parasitims on <em>Meloidogyne incognita</em> eggs; A) Parasited eggs with a large amount of mycelium; B) Mycelium coming out of the egg and presence of spores on the surface of the egg; C) Parasited egg with mycelium and the presence of dictyochlamidospores; D) Eggs from the control treatment.
Figure 3. Pochonia chlamydosporia parasitims on Meloidogyne incognita eggs; A) Parasited eggs with a large amount of mycelium; B) Mycelium coming out of the egg and presence of spores on the surface of the egg; C) Parasited egg with mycelium and the presence of dictyochlamidospores; D) Eggs from the control treatment.
  • Vol. 2026, 44(1)
  • Scientific Article

Antifungal activity using ZnO microparticles with different morphologies against Rhizoctonia sp.

byFlor A Macías Mendoza, Laila Muñoz Castellanos, Juan C Pantoja Espinoza, Francisco Paraguay Delgado*

Received: 08/August/2025 – Published: 13/November/2025
DOI: https://doi.org/10.18781/R.MEX.FIT.2508-1

Abstract Background/Objective. The main objective of the study was to synthesize zinc oxide (ZnO) microparticles (MP) with three types of morphologies (prisms, platelets, and rods) in order to assess their antifungal activity against Rhizoctonia sp. It was hypothesized that morphology and concentration were key factors influencing antifungal efficacy. To suggest the potential of customized nanoparticle design in the treatment of fungal diseases.

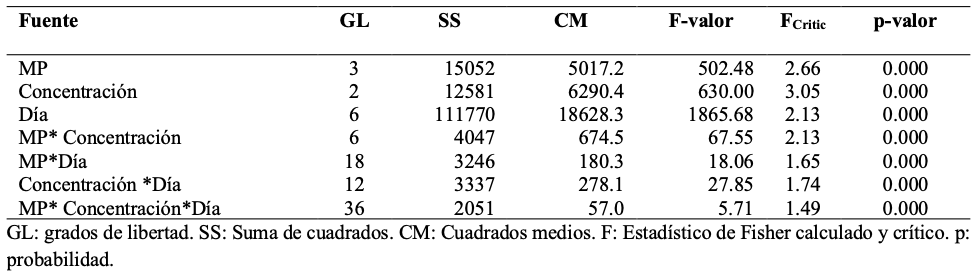
Materials and Methods. The ZnO MPs were synthesized using the hydrothermal method, designed to obtain three morphologies: prisms, platelets, and rods. They were characterized using scanning electron microscopy (SEM) and X-ray diffraction (XRD). Antifungal activity was evaluated at concentrations of 200, 500, and 1000 ppm against Rhizoctonia sp. Statistical analysis was performed using ANOVA and Fisher's LSD test to evaluate the effects of morphology, concentration and time on fungal growth.

Results. At concentrations of 500 and 1000 ppm of MPs, show significant inhibition of Rhizoctonia sp. was observed. While at 200 ppm, no significant inhibition was observed compared to the negative control. Sclerotia formation was observed at the lowest concentration in all samples, especially in those with lamellar morphology (ZnO-L) up to 500 ppm. Microscopic evaluation at 200 ppm also revealed structural damage to the hyphae and cytoplasmic condensation. However, this was not observed in the 1000 ppm treatments. Among the different morphologies, ZnO rods (ZnO-R) showed the most effective antifungal activity.

Conclusion. Particles with elongated morphology (rods) showed promising antifungal activity against Rhizoctonia sp. The efficacy increased at concentrations of 500 and 1000 ppm, resulting in significant inhibition of fungal growth. The morphology and concentration of the particles are key factors influencing antifungal growth. This result demonstrates that particle morphology plays a crucial role in controlling fungal diseases.

Show Figures and/or Tables
Table 1. ANOVA summary for mycelial growth (mm) as a function of microparticle type, concentration, and incubation days.
Figure 1. Images of the three morphologies of ZnO particles obtained by SEM, ZnO-P (A, D), ZnO-L (B, E), and ZnO-R (C, F). Size distribution: ZnO-P (G), ZnO-L (H), and ZnO-R (I).
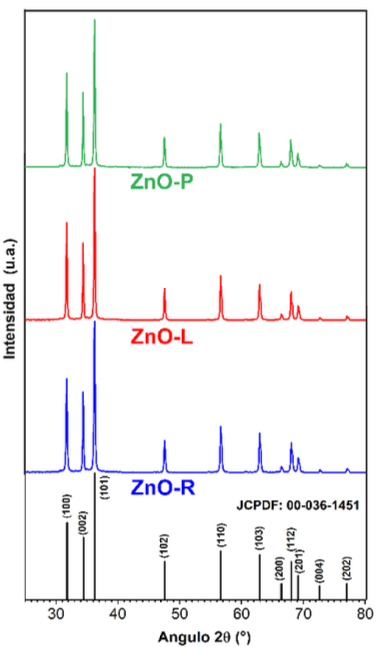
Figure 2. X-ray Diffraction (XRD) patterns of the three zinc oxide samples: ZnO-P (green), ZnO-L (red), and ZnO-R (blue). All diffraction peaks match the hexagonal wurtzite structure of ZnO (reference JCPDF: 00-036-1451).
Figure 3. The growth (mm) of <em>Rhizoctonia</em> sp. over time (days) for the samples. (A) ZnO-P, (B) ZnO-L, (C) ZnO-R in comparison to ICF (D) and the Negative Control (E). The labels (A, B, and C) in the graphics mean A: is at 1000 ppm, B: is at 500 ppm, and C: is at 200 ppm.
Figure 3. The growth (mm) of Rhizoctonia sp. over time (days) for the samples. (A) ZnO-P, (B) ZnO-L, (C) ZnO-R in comparison to ICF (D) and the Negative Control (E). The labels (A, B, and C) in the graphics mean A: is at 1000 ppm, B: is at 500 ppm, and C: is at 200 ppm.
Figure 4. Macroscopic morphology of aerial mycelium. <em>Rhizoctonia</em> sp. on PDA Agar with Nanoparticles – images were acquired at the seventh day inspection, (A) ZnO-P, (B) ZnO-L, (C) ZnO-R in comparison to ICF (D), and the Negative Control (E). The column labels (A, B, and C) in the graphics represent the following concentrations: A, 1000 ppm; B, 500 ppm; and C, 200 ppm. The numbers labelled 1, 2, and 3 mean the number of repetitions.
Figure 4. Macroscopic morphology of aerial mycelium. Rhizoctonia sp. on PDA Agar with Nanoparticles – images were acquired at the seventh day inspection, (A) ZnO-P, (B) ZnO-L, (C) ZnO-R in comparison to ICF (D), and the Negative Control (E). The column labels (A, B, and C) in the graphics represent the following concentrations: A, 1000 ppm; B, 500 ppm; and C, 200 ppm. The numbers labelled 1, 2, and 3 mean the number of repetitions.
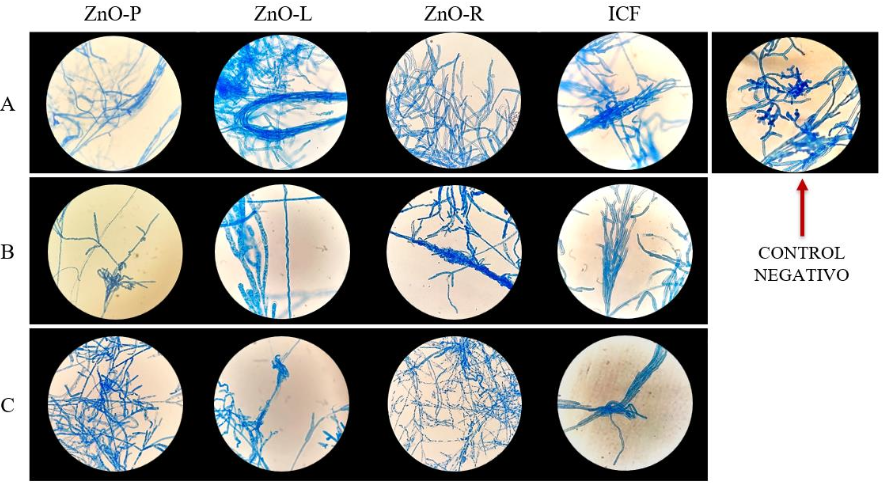
Figure 5. Microscopic Morphology of <em>Rhizoctonia</em> sp. on PDA Agar with Concentrations of A: 1000 ppm, B: 500 ppm, and C: 200 ppm of MPs; ZnO-P, ZnO-L, ZnO-R in comparison to ICF and the Negative Control after 7 days of growth. The optical microscope magnification was 40X. Lactophenol Blue.
Figure 5. Microscopic Morphology of Rhizoctonia sp. on PDA Agar with Concentrations of A: 1000 ppm, B: 500 ppm, and C: 200 ppm of MPs; ZnO-P, ZnO-L, ZnO-R in comparison to ICF and the Negative Control after 7 days of growth. The optical microscope magnification was 40X. Lactophenol Blue.
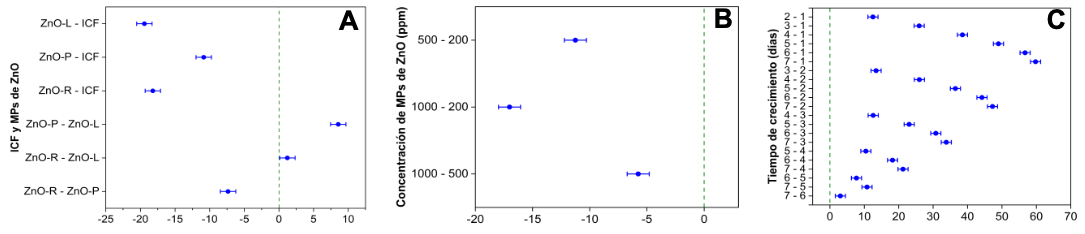
Figure 6. Differences of Means test for Growth (mm) by Fisher´s LSD test comparison of (A) treatments, (B) concentrations, and (C) between days.
  • Vol. 2026, 44(1)
  • Phytopathological Note

In vitro effect of pydiflumetofen against Fusarium virguliforme and Sclerotinia sclerotiorum isolates from soybean in Iowa, USA

byEdgar H Nieto Lopez, Austin Bierl, Desiree Chang Villatoro, Parbati Joshi, José F González Acuña, Stith Wiggs, Daren Mueller*

Received: 05/May/2025 – Published: 31/October/2025
DOI: https://doi.org/10.18781/R.MEX.FIT.2505-2

Abstract Background/Objective. Sudden death syndrome caused by Fusarium virguliforme (Fv) and White mold caused by Sclerotinia sclerotiorum (Ss) are the most important soybean disease in regards to yield loss in the Northern USA. Few studies have estimated for Fv and Ss isolates from Iowa, the EC50 mycelial growth of the fungicide pydiflumetofen for Fv and Ss; likewise, the EC50 sclerotial production for Ss.

Experimental development. Potato dextrose agar (PDA) at 1/3 strength was amended with Saltro® (pydiflumetofen 41.7%) at 0.0008, 0.0042, 0.0083, 0.0417, 0.0834, 0.8340, and 834 ppm from serial dilutions. Isolates were incubated in darkness at 25 °C. Fv isolates were evaluated at 7 days and Ss isolates at 48 h after inoculation, measuring the radial growth. The sclerotia number and dried-weight were measured after 21 days of incubation.

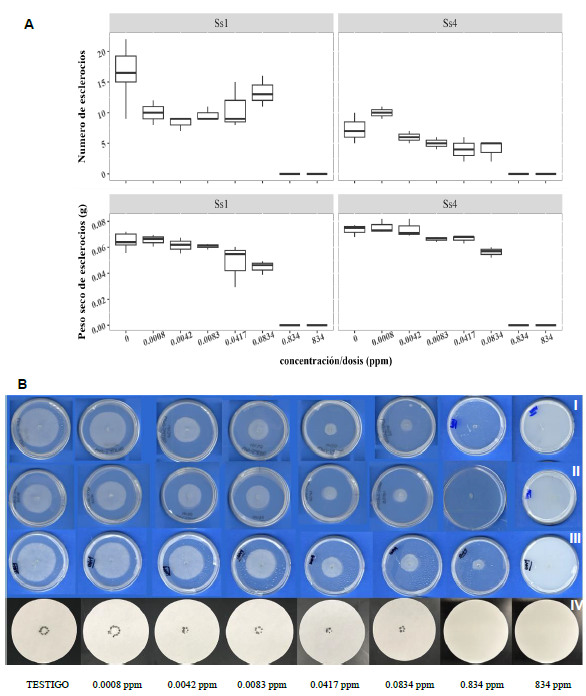
Results. Pydiflumetofen absolute EC50 values for mycelial growth Fv were 0.045 and 0.048 ppm. The Fv contemporary isolate (FV-RD-0024; collected in year 2024), and the historical isolate (NE205; collected in year 2006—years before pydiflumetofen introduction in the market), both presented EC50 mycelial growth in the range of the baseline (0.04–0.24 ppm) in the USA. EC50 values for the mycelial growth of Ss contemporary isolates ranged from 0.011 to 0.046 ppm, which fall in the baseline from soybean and non-soybean hosts from China. Concentrations of 0.834 and 834 ppm were statistically different (no sclerotia production) than the control, which showed 14.6 sclerotia and 0.066 g.

Conclusion. The EC50 mycelial growth of F. virguliforme Iowa isolates fall in the range of previous reported for the USA. The EC50 mycelial growth of S. sclerotiorum Iowa isolates fall in the range previous reported outside the USA. Pydiflumetofen has the potential to diminish the sclerotial production but more studies are needed

Show Figures and/or Tables
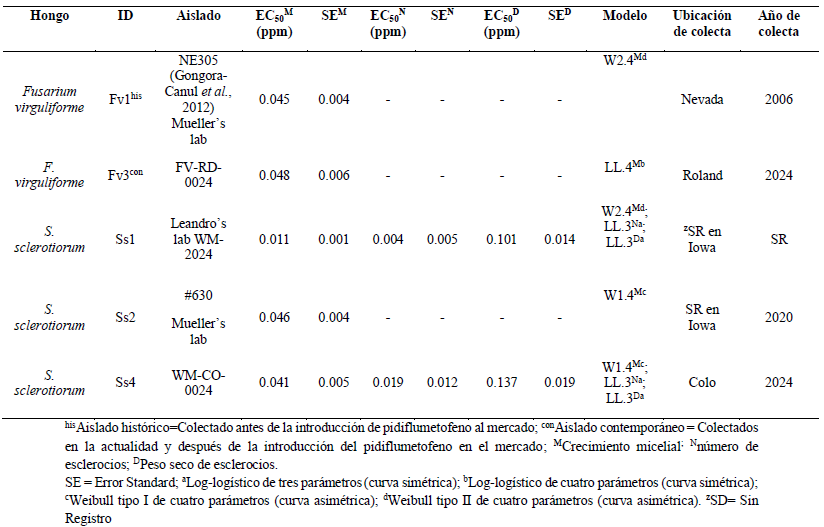
Table 1. Isolates of <em>Fusarium virguliforme</em> (Fv) and <em>Sclerotinia sclerotiorum</em> (Ss) used in the study including their background information and their absolute EC<sub>50</sub> estimated per variable on petri plates amended with pydiflumetofen fungicide (Saltro®; Syngenta) at 0.0008, 0.0042, 0.0083, 0.0417, 0.0834, 0.8340, and 834 ppm through standard serial dilutions. The isolate Ss2 (#630) shows one model since it did not produce sclerotia in the control.
Table 1. Isolates of Fusarium virguliforme (Fv) and Sclerotinia sclerotiorum (Ss) used in the study including their background information and their absolute EC50 estimated per variable on petri plates amended with pydiflumetofen fungicide (Saltro®; Syngenta) at 0.0008, 0.0042, 0.0083, 0.0417, 0.0834, 0.8340, and 834 ppm through standard serial dilutions. The isolate Ss2 (#630) shows one model since it did not produce sclerotia in the control.
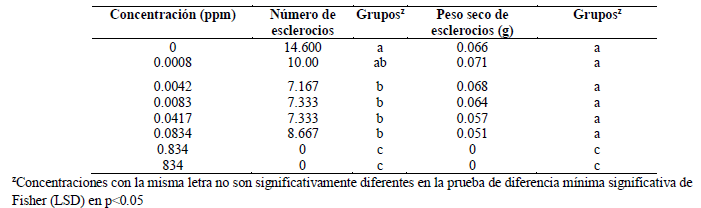
Table 2. Average of number and dried-weight of sclerotia produced of<em> Sclerotinia sclerotiorum</em> isolates Ss1 (WM-2024) and Ss4 (WM-CO-0024) incubated for 21 days in darkness 25 °C. Petri plates amended with pydiflumetofen fungicide. Metrics between both isolates were combined.
Table 2. Average of number and dried-weight of sclerotia produced of Sclerotinia sclerotiorum isolates Ss1 (WM-2024) and Ss4 (WM-CO-0024) incubated for 21 days in darkness 25 °C. Petri plates amended with pydiflumetofen fungicide. Metrics between both isolates were combined.
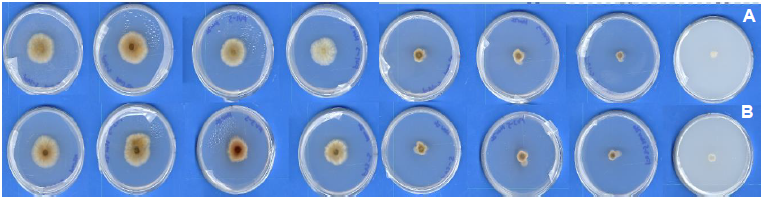
Figure 1. <em>Fusarium virguliforme</em> isolates on 1/3 strength PDA petri plates incubated for 7 days after inoculation (DAI) at 25 °C dark. Petri plates amended with pydiflumetofen fungicide through standard serial dilutions. A) <em>Fusarium virguliforme</em> isolate Fv1 (NE305); B) <em>Fusarium virguliforme</em> isolate Fv3 (FV-RD-0024).
Figure 1. Fusarium virguliforme isolates on 1/3 strength PDA petri plates incubated for 7 days after inoculation (DAI) at 25 °C dark. Petri plates amended with pydiflumetofen fungicide through standard serial dilutions. A) Fusarium virguliforme isolate Fv1 (NE305); B) Fusarium virguliforme isolate Fv3 (FV-RD-0024).
Figure 2. Mycelial growth and sclerotia production of <em>Sclerotinia sclerotiorum</em> isolates petri plates incubated at 25 °C dark. Petri plates amended with pydiflumetofen fungicide serial dilutions. A) Boxplot. B) Image in which a same isolate lays on each panel, with different concentrations increase from left to right along the row. Panels B-I to B-III: Mycelial growth at 48 hours after inoculation (HAI); B-I) <em>Sclerotinia sclerotiorum</em> isolate Ss1 – labeled WM1 (WM-2024); B-II) <em>Sclerotinia sclerotiorum</em> isolate Ss2 – labeled WM2 (#630); B-III) <em>Sclerotinia sclerotiorum</em> isolate Ss4 – labeled WM4 (WM-CO-0024); Panel B-IV: Sclerotia production at 21 days of incubation (DAI); B-IV) <em>Sclerotinia sclerotiorum</em> isolate Ss4 (WM-CO-0024).
Figure 2. Mycelial growth and sclerotia production of Sclerotinia sclerotiorum isolates petri plates incubated at 25 °C dark. Petri plates amended with pydiflumetofen fungicide serial dilutions. A) Boxplot. B) Image in which a same isolate lays on each panel, with different concentrations increase from left to right along the row. Panels B-I to B-III: Mycelial growth at 48 hours after inoculation (HAI); B-I) Sclerotinia sclerotiorum isolate Ss1 – labeled WM1 (WM-2024); B-II) Sclerotinia sclerotiorum isolate Ss2 – labeled WM2 (#630); B-III) Sclerotinia sclerotiorum isolate Ss4 – labeled WM4 (WM-CO-0024); Panel B-IV: Sclerotia production at 21 days of incubation (DAI); B-IV) Sclerotinia sclerotiorum isolate Ss4 (WM-CO-0024).
  • Vol. 2025, 43(4)
  • Phytopathological Note
  • Special Issue

Effect of arbuscular mycorrhizae on sugarcane and on the biocontrol of Fusarium andiyazi

byMaría Eugenia Rodríguez Luqueño, Edgar Martínez Fernández*, Patricia Martínez Jaimes, Víctor Manuel Hernández Velázquez, Verónica Obregón Barbosa, Jorge Luis Folch Mallol

Received: 30/November/2024 – Published: 14/October/2025
DOI: https://doi.org/10.18781/R.MEX.FIT.2024-30

Abstract Background/Objective. Within the Fusarium species complex that causes sugarcane root rot, F. andiyazi stands out for its pathogenicity. The aim of this study was to evaluate the effect of native arbuscular mycorrhizal fungi (AMF) from Morelos on sugarcane growth and their potential for the biocontrol of F. andiyazi.

Experimental development. Soil samples were collected from sugarcane fields in Jojutla, Morelos, where fifteen AMF morphospecies were identified and used as treatments in two bioassays. In the first bioassay, growth parameters and mycorrhizal colonization were evaluated. In the second, the biomass of plants inoculated with F. andiyazi and the degree of root necrosis were analyzed as indicators of biocontrol. Data were analyzed using ANOVA and mean separation tests (p≤0.05).

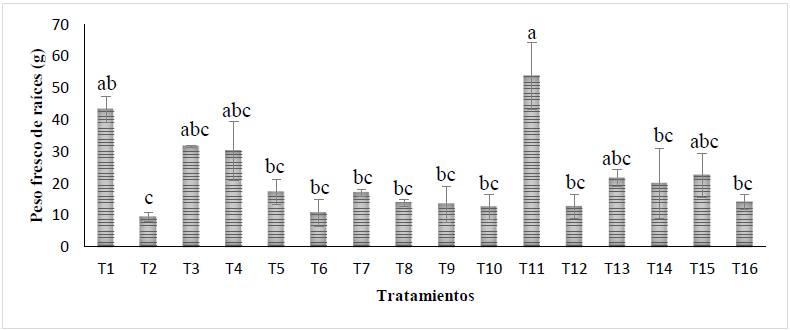
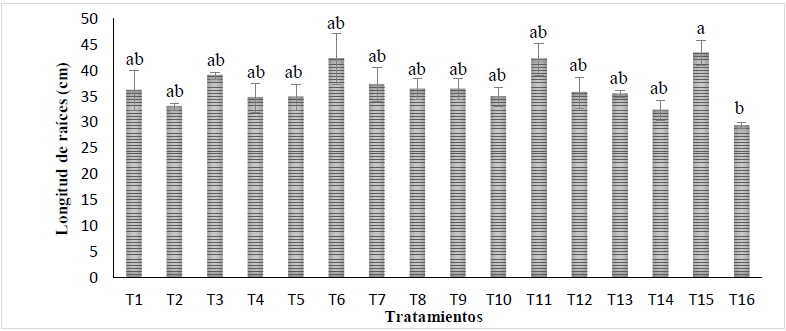
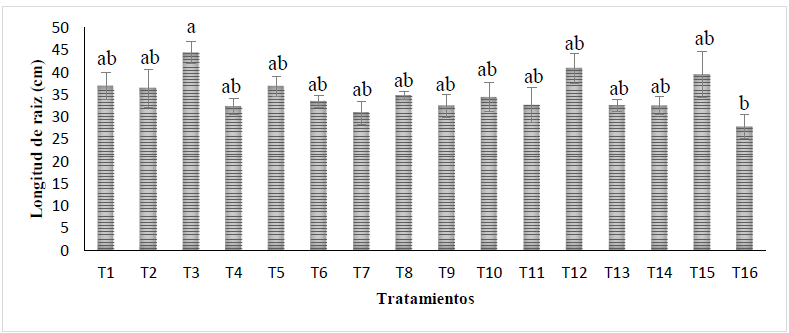
Results. In the first bioassay, the genera Acaulospora and Glomus showed the highest mycorrhization values and significantly increased plant height, as well as root length and fresh weight. In the second bioassay, mycorrhizal plants inoculated with F. andiyazi showed significant increases in root length and dry weight. The morphospecies G. ambisporum and G. mosseae limited root infection to approximately 10% damage.

Conclusion. Native AMF from Morelos demonstrated their ability to stimulate sugarcane growth and reduced the damage caused by F. andiyazi.

Show Figures and/or Tables
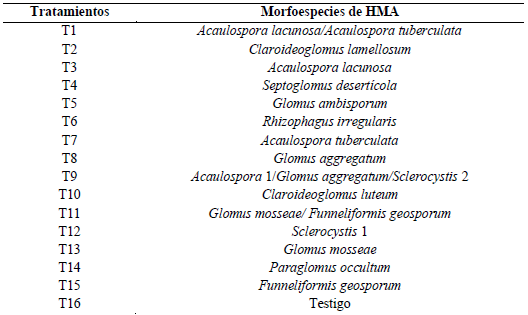
Table 1. Morphospecies of arbuscular mycorrhizal fungi (AMF) used as treatments in the sugarcane bioassays.
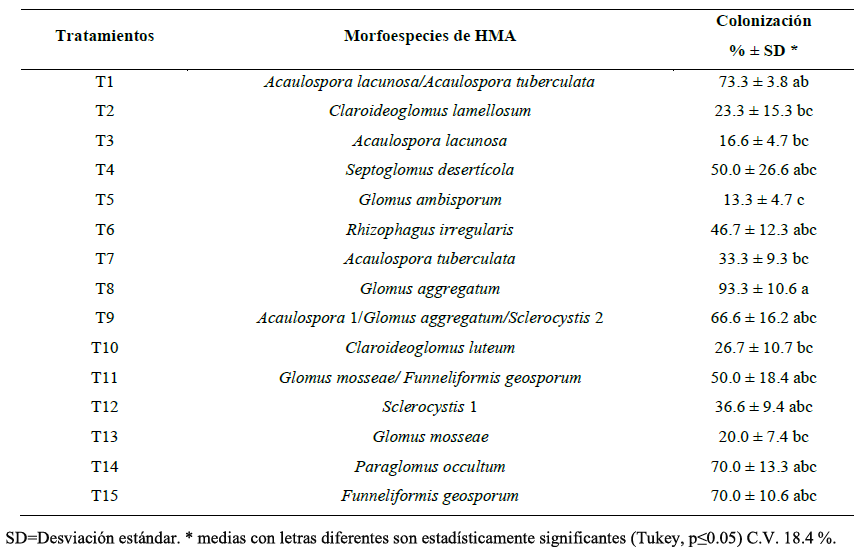
Table 2. Arbuscular mycorrhizal fungi (AMF) colonization in sugarcane roots.
Figure 1. Effect of AMF inoculation on sugarcane plant height in Bioassay 1 (mean ± standard error). Different letters indicate significant differences among treatment means according to Tukey’s test (p≤0.05), C.V. = 11.81.
Figure 2. Effect of AMF inoculation on sugarcane root fresh weight in Bioassay 1 (mean ± standard error). Different letters indicate significant differences among treatment means according to Tukey’s test (p≤0.05), C.V. = 17.67.
Figure 3. Effect of AMF inoculation on sugarcane root length in Bioassay 1 (mean ± standard error). Different letters indicate significant differences among treatment means according to Tukey’s test (p≤0.05), C.V. = 12.19.
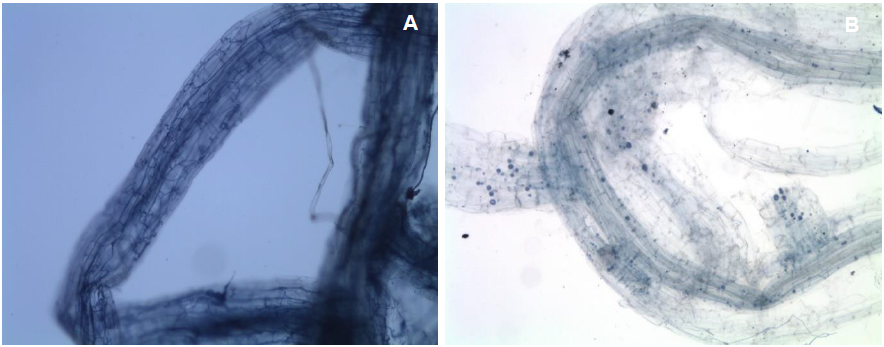
Figure 4. Mycorrhizal colonization of AMF in sugarcane roots stained with trypan blue (40×). (A) Hyphal development of <em>Glomus aggregatum</em> (T8). (B) Hyphal and spore development of <em>Claroideoglomus luteum</em>.
Figure 4. Mycorrhizal colonization of AMF in sugarcane roots stained with trypan blue (40×). (A) Hyphal development of Glomus aggregatum (T8). (B) Hyphal and spore development of Claroideoglomus luteum.
Figure 5. Effect of AMF inoculation on sugarcane root length in Bioassay 2 (mean ± standard error). Different letters indicate significant differences among treatment means according to Tukey’s test (p≤0.05), C.V. = 14.39.
Figure 6. Effect of AMF inoculation on sugarcane root dry weight in Bioassay 2 (mean ± standard error). Different letters indicate significant differences among treatment means according to Tukey’s test (p≤0.05), C.V. = 27.42.
  • Vol. 2025, 43(4)
  • Scientific Article
  • Special Issue

Control of coffee rust (Hemileia vastatrix) with Trichoderma spp.: quantitative assessment using the Pliman package

bySandra Lizveth Enríquez López, Gerardo Alvarado Castillo*, Carlos Roberto Cerdán Cabrera, Rosalba Argumedo Delira, Esteban Escamilla Prado

Received: 28/November/2024 – Published: 14/October/2025
DOI: https://doi.org/10.18781/R.MEX.FIT.2024-36

Abstract Background/Objective. Coffee rust (Hemileia vastatrix) reduces coffee production and profitability. Alternatives for its control (chemical and genetic) have not been fully effective; therefore, the use of microorganisms such as Trichoderma has been proposed. Currently, tools like the Pliman package provide a quantitative alternative for assessing disease severity. The objective was to evaluate the effectiveness of Trichoderma strains applied to the soil in reducing the severity of H. vastatrix through digital image analysis using the Pliman package.

Materials and Methods. The effect of Trichoderma harzianum (Th), T. asperellum (Ta), and their consortium (Th_Ta) was evaluated at two concentrations (1×10⁸ and 1×10¹² conidia mL-1) on 42 ‘Catuaí Amarillo’ coffee plants, both asymptomatic and symptomatic. Soil applications were performed every two months for one year. Disease severity was quantified using the Pliman package in RStudio. The data were analyzed with a factorial ANOVA and Tukey’s tests (p<0.05).

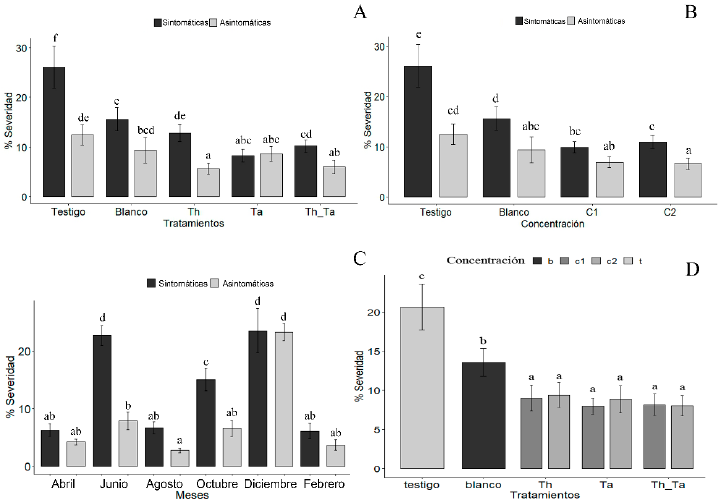
Results. Trichoderma treatments significantly (p < 0.05) reduced disease severity compared with the control. Treated asymptomatic plants showed the lowest severity (Th_Ta=5.99%, Th=5.61%, Ta=8.61%). In symptomatic plants, T. asperellum (Ta) was the most effective, reducing severity to 8.25%, a value not significantly different from that of treated asymptomatic plants. No significant differences were found between the concentrations used (1×10⁸ and 1×10¹² conidia mL-1). Severity showed a clear seasonal variation, being lower during dry months (February=4.89%, August=4.71%, and April=5.23%) and higher during rainy months (June=15.29%, October=10.79%, and December=23.39%).

Conclusion. Soil application of Trichoderma spp. significantly reduces the severity of coffee rust. The most effective treatments were the consortium of T. harzianum and T. asperellum in asymptomatic plants, and T. asperellum alone in symptomatic plants, with the concentration of 1×10⁸ conidia mL-1 being the most advisable due to its efficacy and economic feasibility. Finally, the Pliman package proved to be an effective tool for the objective quantification of the disease.

Show Figures and/or Tables
Figure 1. Effect of treatments with <em>Trichoderma</em> spp. on the severity of coffee rust (<em>Hemileia vastatrix</em>) in symptomatic and asymptomatic plants. (A) Interaction between plant type (symptomatic and asymptomatic) and treatments; (B) Interaction between plant type and concentration (C1 = 1×10<sup>8</sup> conidia mL<sup>-1</sup>, C2 = 1×10<sup>12</sup> conidia mL<sup>-1</sup>); (C) Variation in severity throughout the year; (D) Interaction between treatments and concentrations. Bars indicate mean ± standard error. Significant differences were determined by repeated-measures ANOVA and Tukey’s test (p < 0.05).
Figure 1. Effect of treatments with Trichoderma spp. on the severity of coffee rust (Hemileia vastatrix) in symptomatic and asymptomatic plants. (A) Interaction between plant type (symptomatic and asymptomatic) and treatments; (B) Interaction between plant type and concentration (C1 = 1×10⁸ conidia mL-1, C2 = 1×10¹² conidia mL-1); (C) Variation in severity throughout the year; (D) Interaction between treatments and concentrations. Bars indicate mean ± standard error. Significant differences were determined by repeated-measures ANOVA and Tukey’s test (p < 0.05).
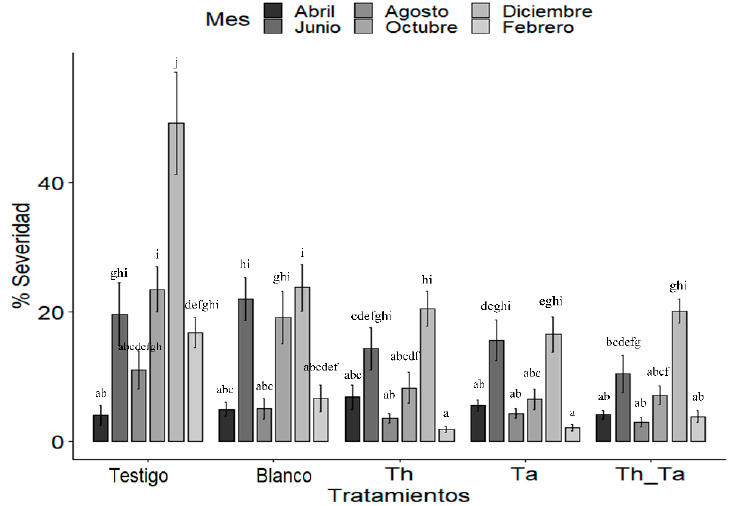
Figure 2. Interaction between <em>Trichoderma</em> spp. treatments and evaluation months on the severity of coffee rust. The figure shows the temporal evolution of severity in plants treated with <em>T. harzianum</em> (Th), <em>T. asperellum</em> (Ta), their consortium (Th_Ta), the conventional management (blank), and the untreated control. Bars represent mean ± standard error. Significant differences were determined by repeated-measures ANOVA (p < 0.05).
Figure 2. Interaction between Trichoderma spp. treatments and evaluation months on the severity of coffee rust. The figure shows the temporal evolution of severity in plants treated with T. harzianum (Th), T. asperellum (Ta), their consortium (Th_Ta), the conventional management (blank), and the untreated control. Bars represent mean ± standard error. Significant differences were determined by repeated-measures ANOVA (p < 0.05).

Page 4 of 16