RMF Logo

Article filters

Search Papers:

For searching before 2024 see Archive (2000-2023)
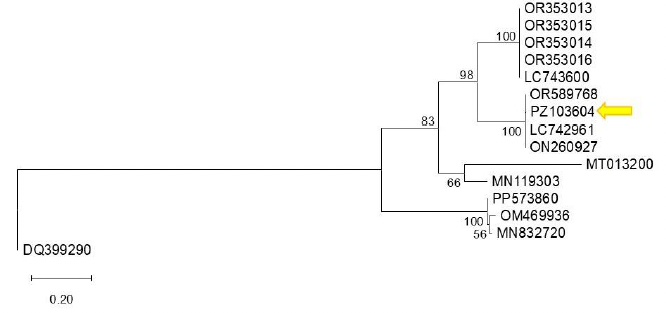
First detection of bell pepper endornavirus infecting bell pepper in Guanajuato, Mexico. Figure 1 - Phylogenetic tree constructed using the Maximum Likelihood method based on the bell pepper endornavirus (BPEV, <em>Alphaendornavirus capsici</em>) polyprotein sequence and other Alphaendornavirus sequences available in GenBank. Reference sequences were selected from GenBank based on their annotation as BPEV isolates and sequence availability. The analysis was performed using the corresponding nucleotide substitution model. Bootstrap support values (1,000 replicates) are indicated at the nodes, showing only those greater than 50%. Sequence PZ103604 (indicated by an arrow) clusters with closely related sequences with high bootstrap support, suggesting a close phylogenetic relationship. Sequence DQ399290 (<em>Betaendornavirus</em>) was used as the outgroup. The scale bar represents 0.20 substitutions per site.

All the Articles

  • Vol. 2025, 43(4)
  • Scientific Article
  • Special Issue

Hrp proteins as bioinducers for the biocontrol of bacterial diseases in tomato and pepper plants in greenhouse

byMaría del Sol Cuellar Espejel, Evangelina Esmeralda Quiñones Aguilar, Gabriel Rincón Enríquez*, Rodolfo Hernández Gutiérrez, Juan Carlos Mateos Díaz, Sergio David Valerio Landa

Received: 15/November/2024 – Published: 13/February/2025
DOI: https://doi.org/10.18781/R.MEX.FIT.2024-25

Abstract Background/Objective. Diseases such as bacterial spot in tomato (Solanum lycopersicum) and bacterial spot in chili pepper (Capsicum annuum) cause significant global economic losses. A sustainable alternative for their control is the use of protein inducers (Harpin proteins = Hrp) that activate plant defense responses by being recognized by the plant immune system, inducing defense mechanisms against pathogens. The objective of this research was to evaluate the biological effectiveness and optimal application dose of the biological inducer BioFensa (based on Hrp proteins), produced in a pilot plant, to control these diseases.

Materials and Methods. Three greenhouse experiments were conducted to evaluate the biological effectiveness of BioFensa (1 μg mL⁻¹). The protein inducer was tested for controlling bacterial spot (X. euvesicatoria strain BV865 [1] and BV801 [2]), as well as bacterial speck (P. syringae pv. tomato, strain DC3000 [3]). Each experiment included 5 treatments and 11 replicates. Additionally, an experiment was conducted to determine the optimal dose of BioFensa (0.01, 0.1, and 1.0 μg mL⁻¹) against X. euvesicatoria strain BV801, with 7 treatments and 8 replicates [4]. In the four experiments in total, plants were sprayed with BioFensa (3 mL per plant) 24 hours before infection, and symptoms were evaluated after 30 days by counting spots on the foliar tissue.

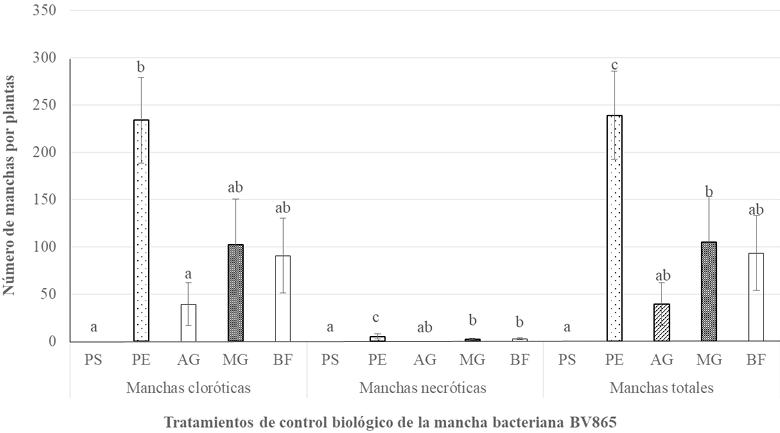
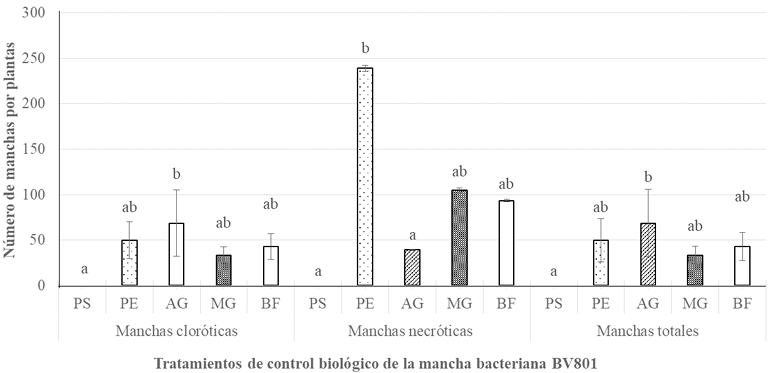
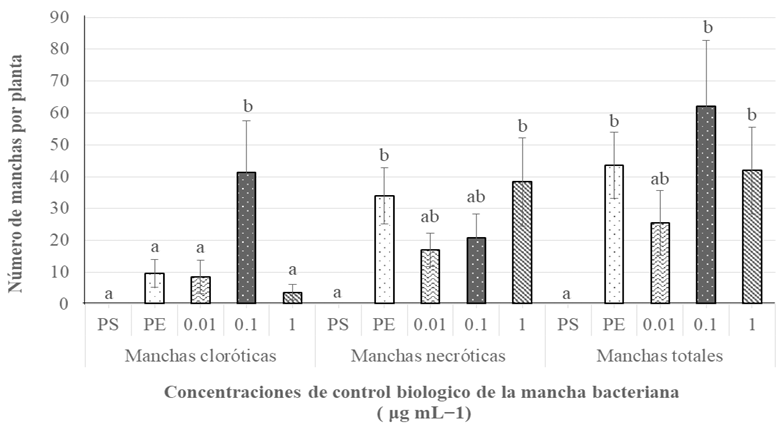
Results. BioFensa was effective in significantly reducing damage in chili and tomato plants (LSD, p≤0.05). At a high concentration (1 μg mL⁻¹), it prevented the appearance of spots on tomato plants by 53%, while for chili plants against strain BV865, it prevented spots by 60%. On the other hand, for chili plants against strain BV801, at low concentrations (0.01 and 0.1 μg mL⁻¹), symptoms were significantly reduced by 38-41%, whereas at a higher concentration (1 μg mL⁻¹), this effect was not maintained, suggesting a limit in the perception of inducers by the plants.

Conclusion. The results suggest that BioFensa has the potential to be an effective alternative to control diseases in horticultural crops such as tomatoes and chili peppers.

Show Figures and/or Tables
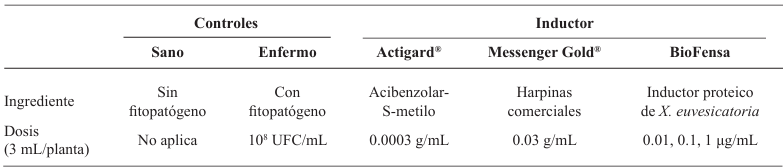
Table 1. Composition of the treatments of Experiment 4 to determine the effect of different doses of the protein inducers under greenhouse conditions for chili pepper plants.
Figure 1. Biological effectiveness of different biological treatments for the control of P. <em>syringae</em> pv. <em>tomato</em>, strain DC3000 (bacterial speck) in tomato plants under greenhouse conditions, depending on the amount of necrotic, chlorotic and total spots per plant. PS=Healthy plant; PE=Diseased plant; AG=Actigard<sup>®</sup> (0.003 g mL<sup>−1</sup>); MG= Messenger Gold<sup>®</sup> (0.003 g mL<sup>−1</sup>); BF= BioFensa (1 μg mL<sup>−1</sup>). Different letters in each response variable indicate significant differences according to the LSD test (p≤0.05). Bars in the rectangle indicate ± the standard error.
Figure 1. Biological effectiveness of different biological treatments for the control of P. syringae pv. tomato, strain DC3000 (bacterial speck) in tomato plants under greenhouse conditions, depending on the amount of necrotic, chlorotic and total spots per plant. PS=Healthy plant; PE=Diseased plant; AG=Actigard® (0.003 g mL−1); MG= Messenger Gold® (0.003 g mL−1); BF= BioFensa (1 μg mL−1). Different letters in each response variable indicate significant differences according to the LSD test (p≤0.05). Bars in the rectangle indicate ± the standard error.
Figure 2. Biological effectiveness of different biological treatments for the control of X. <em>euvesicatoria</em>, strain BV865 in ancho chili pepper plants, San Luis variety, under greenhouse conditions, depending on the amount of necrotic, chlorotic and total spots per plant. PS=Healthy plant; PE=Diseased plant; AG=Actigard<sup>®</sup> (0.003 g mL<sup>−1</sup>); MG= Messenger Gold<sup>®</sup> (0.003 g mL<sup>−1</sup>); BF= BioFensa (1 μg mL<sup>−1</sup>). Different letters in each response variable indicate significant differences according to the LSD test (p≤0.05). Bars in the rectangle indicate ± the standard error.
Figure 2. Biological effectiveness of different biological treatments for the control of X. euvesicatoria, strain BV865 in ancho chili pepper plants, San Luis variety, under greenhouse conditions, depending on the amount of necrotic, chlorotic and total spots per plant. PS=Healthy plant; PE=Diseased plant; AG=Actigard® (0.003 g mL−1); MG= Messenger Gold® (0.003 g mL−1); BF= BioFensa (1 μg mL−1). Different letters in each response variable indicate significant differences according to the LSD test (p≤0.05). Bars in the rectangle indicate ± the standard error.
Figure 3. Biological effectiveness of different biological treatments for the control of X. <em>euvesicatoria</em>, BV801, in ancho chili peppers San Luis variety under greenhouse conditions, according to the number of necrotic, chlorotic and total spots per plant. PS=Healthy plant; PE=Diseased plant; AG=Actigard<sup>®</sup> (0.003 g mL<sup>−1</sup>); MG= Messenger Gold<sup>®</sup> (0.003 g mL<sup>−1</sup>); BF= BioFensa (1 μg mL<sup>−1</sup>). Different letters in each response variable indicate significant differences according to the LSD test (p≤0.05). Bars in the rectangle indicate ± the standard error.
Figure 3. Biological effectiveness of different biological treatments for the control of X. euvesicatoria, BV801, in ancho chili peppers San Luis variety under greenhouse conditions, according to the number of necrotic, chlorotic and total spots per plant. PS=Healthy plant; PE=Diseased plant; AG=Actigard® (0.003 g mL−1); MG= Messenger Gold® (0.003 g mL−1); BF= BioFensa (1 μg mL−1). Different letters in each response variable indicate significant differences according to the LSD test (p≤0.05). Bars in the rectangle indicate ± the standard error.
Figure 4. Effect of different doses of BioFensa (0.01, 0.1 and 1 μg mL<sup>−1</sup>) on the control of X. <em>euvesicatoria</em>, strain BV801 on ancho chili plants, San Luis variety, under greenhouse conditions. PS=Healthy plant; PE=Diseased plant. Different letters indicate, within each response variable, significant differences according to the LSD test (p≤0.05). Bars in the rectangle indicate ± the standard error.
Figure 4. Effect of different doses of BioFensa (0.01, 0.1 and 1 μg mL−1) on the control of X. euvesicatoria, strain BV801 on ancho chili plants, San Luis variety, under greenhouse conditions. PS=Healthy plant; PE=Diseased plant. Different letters indicate, within each response variable, significant differences according to the LSD test (p≤0.05). Bars in the rectangle indicate ± the standard error.
  • Vol. 2025, 43(4)
  • Scientific Article
  • Special Issue

Trichoderma spp. condiospores production and its application with Streptomyces spp. for the management of Mycosphaerella fijiensis in banana

byWilberth Chan Cupul*, Osvaldo Villegas Guerrero, Juan C Sánchez Rangel, Gilberto Manzo Sánchez, Marco T Buenrostro Nava

Received: 15/November/2024 – Published: 13/February/2025
DOI: https://doi.org/10.18781/R.MEX.FIT.2024-05

Abstract Background/Objective. Black Sigatoka (BS) is one of the main phytopathologies that reduces banana production in Mexico. Developing biological products based on antagonists is a predominant study activity. The production of conidiospores of Trichoderma spp. strains was evaluated in solid state fermentation using whole rice grains and cracked corn, and the effect of foliar applications of conidiospores against the BS epidemiology in banana cv. Great dwarf.

Materials and methods. In solid state fermentation, the yield of four strains of Trichoderma spp. (T-82, T-85, T-94 and T-99) in whole rice (WR) and cracked corn (CC) was evaluated, an A×B factorial design was used (A=strains and B=substrate). The two strains with the best yield (T-99 and T-85) and a Streptomyces spp. based product was applied in the field to evaluate the epidemiology of BS through the severity, weighted average of infection (WAI) and area under the disease progress curve (AUDPC), through a randomized block design.

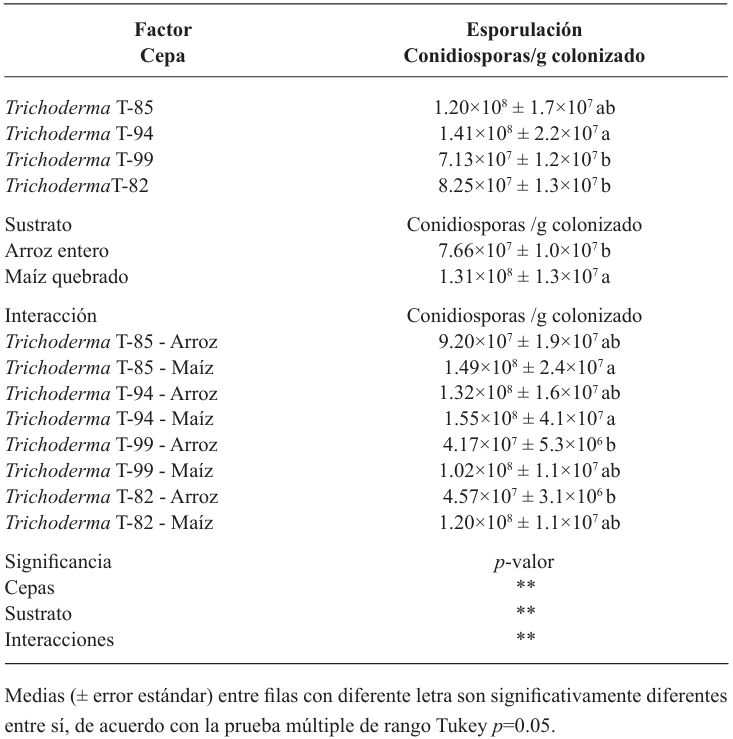
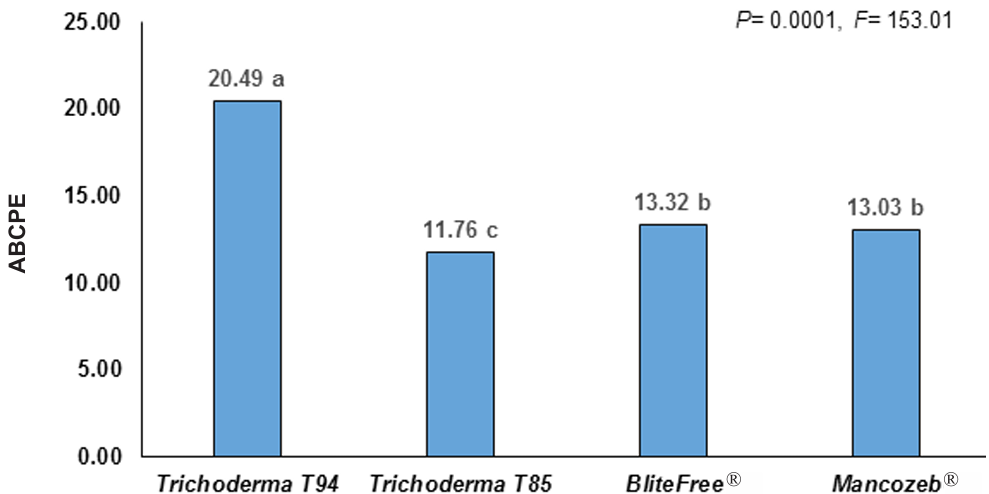
Results. CC increased the yield of Trichoderma spp. in 71%, strains T-94 (1.41×10⁸ conidiospores g-1) and T-85 (1.20×10⁸ conidiospores g-1) achieved the highest yields. The T-85 strain reduced the severity, WAI and AUDPC of BS compared to applications of the chemical control “Mancozeb”.

Conclusion. CC was the best substrate to obtain greater yield in Trichoderma spp. T-94 and T-85. The weekly application of conidiosporas of Trichoderma T-85 reduces the severity, WAI and AUDPC of the SN in banana cv. Great dwarf.

Show Figures and/or Tables
Table 1. Yield of <em>Trichoderma</em> spp. strains on solid substrates.
Table 1. Yield of Trichoderma spp. strains on solid substrates.
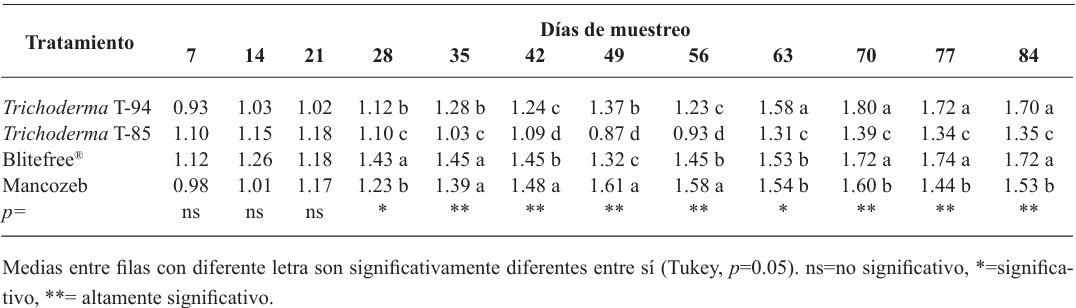
Table 2. Severity of black Sigatoka in “Gran Enano” banana through applications of <em>Trichoderma</em> spp.
Table 2. Severity of black Sigatoka in “Gran Enano” banana through applications of Trichoderma spp.
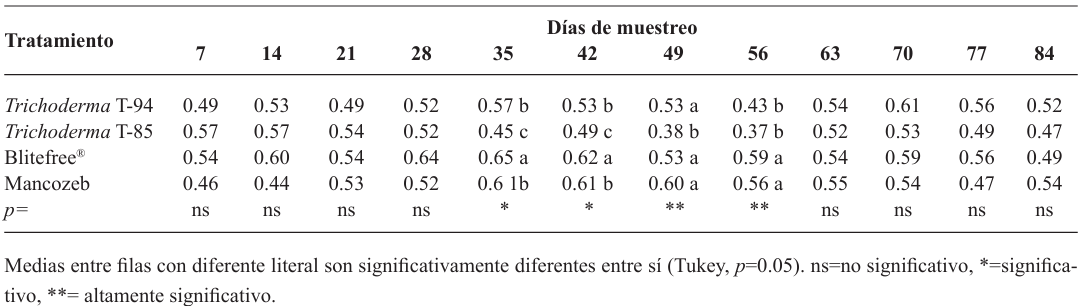
Table 3. Weighted infection average (WIA) of black Sigatoka in “Gran Enano” banana through applications of <em>Trichoderma</em> spp.
Table 3. Weighted infection average (WIA) of black Sigatoka in “Gran Enano” banana through applications of Trichoderma spp.
Figure 1. Total area under the disease progress curve (AUDPC) of black Sigatoka in “Gran Enano” banana through applications of <em>Trichoderma</em> spp.
Figure 1. Total area under the disease progress curve (AUDPC) of black Sigatoka in “Gran Enano” banana through applications of Trichoderma spp.
Figure 2. Behavior of the area under the disease progress curve (AUDPC) of black Sigatoka in Gran Enano banana through applications of <em>Trichoderma</em> spp.
Figure 2. Behavior of the area under the disease progress curve (AUDPC) of black Sigatoka in Gran Enano banana through applications of Trichoderma spp.
  • Vol. 2025, 43(1)
  • Scientific Article

Biological and molecular characterization of nectrial species associated with an avocado decline syndrome

byJeny Michua Cedillo, Gustavo Mora Aguilera*, Gerardo Acevedo Sánchez

Received: 30/July/2024 – Published: 31/December/2024
DOI: https://doi.org/10.18781/R.MEX.FIT.2406-7

Abstract Background/Objective. Nectriaceae members increased regional occurrence in Michoacán since 2019. However, root species identity, geographic distribution, and association to other families are unknown. The objective was to characterize biological and molecularly species of Nectria associated with Persea americana.

Materials and Methods. Seventy samples of wilt trees from 13 municipalities in Michoacán were processed. Thirty isolates selected based on epidemiological criteria were cultured in malt-agar, PDA, and oat-agar extracts to determine cultural and morphological characterization. Five morphotypes of Nectria with varying radial growth and brown coloration were obtained. From mycelial DNA, TEF 1-a and RPB2 genes were amplified, sequences were cleaned and aligned with SeqAssem and MAFFT, respectively. Bayesian inference and maximum parsimony phylogenetic algorithms were performed using PAUP 4.0 and MrBayes 3.2 complemented with 66 and 65 sequences from GenBank for TEF 1-a and RPB2, respectively. S. chartarum was used as the external species and four other Hypocreales.

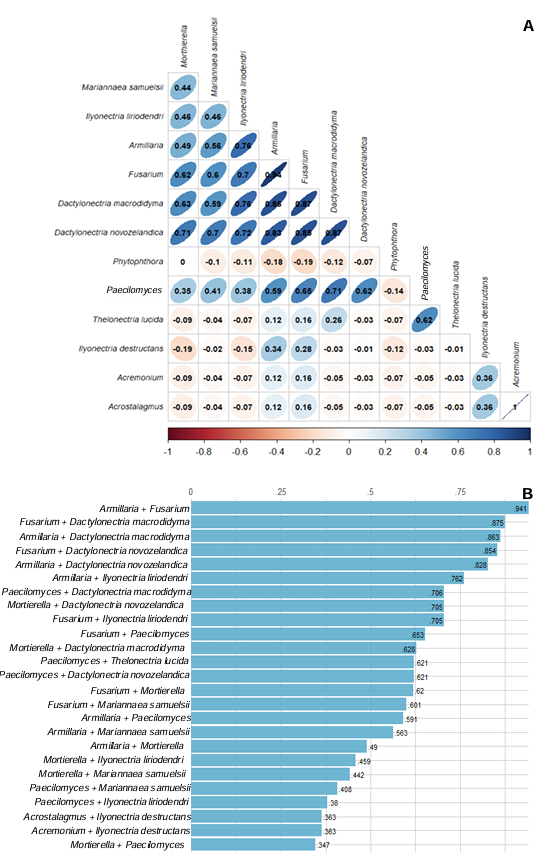
Results. Bayesian inference revealed greater phylogenetic consistency. Three genera and three species were identified with TEF 1-a (>94 % homology) and three genera and five species with RPB2 (>97 % homology) belonging to Ilyonectria (56 %), Dactylonectria (33 %), Mariannaea (6 %), and Thelonectria (3 %). Associations of Nectria were observed mainly to Armillaria (97.1 %), Fusarium (92.9 %), Paecilomyces (56.4 %), and Morthierella (47.3 %).

Conclusion. A decline syndrome in avocado trees associated with a fungal complex characterized by descending defoliation, wilt, reduced fruit size, and root necrosis is postulated. This is the first report of Nectria associated fungi in avocado trees in Mexico.

Show Figures and/or Tables
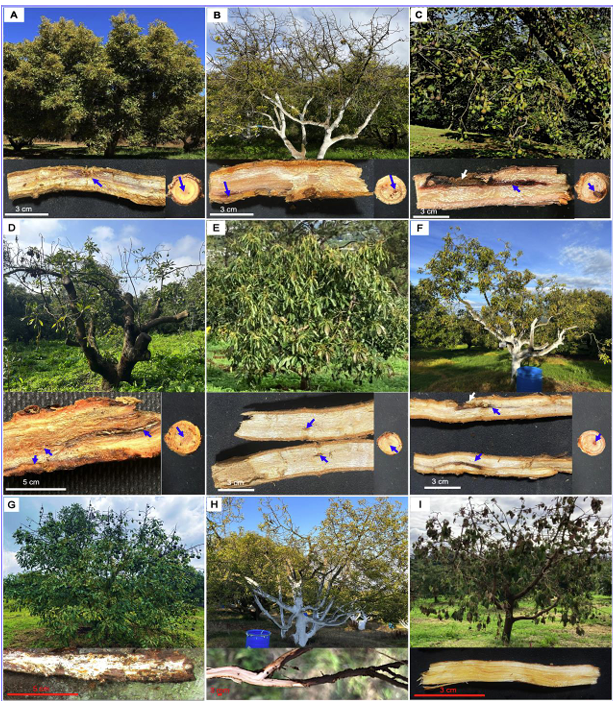
Figure 1. <strong>A</strong>. Healthy tree and longitudinal and transversal section of 1.5 cm diameter root and association of <em>Ilyonectria liriodendri</em>; <strong>B.</strong> Apical defoliation, longitudinal and transverse root section with restricted necrosis associated to <em>I. liriodendri</em>; <strong>C.</strong> Fruit size reduction, longitudinal and transverse root cutting showing invasive necrosis associated to <em>I. liriodendri</em>; <strong>D.</strong> Defoliation and small leaves associated with <em>Armillaria</em> + <em>I. liriodendri</em> and root with medullary necrosis; <strong>E.</strong> Moderate wilt associated with <em>Phytophthora</em> + <em>I. liriodendri</em> and longitudinal root cutting showing restricted necrosis; <strong>F.</strong> Yellow canopy, small leaves and canopy reduction associated to <em>Fusarium</em> + <em>Dactylonectria</em> <em>macrodidyma</em> and root with medullary invasive necrosis. <strong>G.</strong> Progressive wilt and root necrosis, and invasive mycelia in root tissue associated with <em>Armillaria</em> sp.; <strong>H.</strong> Wilt, yellowing of canopy and root with subcortical necrosis associated with <em>Phytophthora</em> <em>cinnamomi</em>; <em>I.</em> Total wilt, necrotic foliage adhering to branches, root with lines of necrosis in vascular tissue associated to <em>Verticillium</em> sp.
Figure 1. A. Healthy tree and longitudinal and transversal section of 1.5 cm diameter root and association of Ilyonectria liriodendri; B. Apical defoliation, longitudinal and transverse root section with restricted necrosis associated to I. liriodendri; C. Fruit size reduction, longitudinal and transverse root cutting showing invasive necrosis associated to I. liriodendri; D. Defoliation and small leaves associated with Armillaria + I. liriodendri and root with medullary necrosis; E. Moderate wilt associated with Phytophthora + I. liriodendri and longitudinal root cutting showing restricted necrosis; F. Yellow canopy, small leaves and canopy reduction associated to Fusarium + Dactylonectria macrodidyma and root with medullary invasive necrosis. G. Progressive wilt and root necrosis, and invasive mycelia in root tissue associated with Armillaria sp.; H. Wilt, yellowing of canopy and root with subcortical necrosis associated with Phytophthora cinnamomi; I. Total wilt, necrotic foliage adhering to branches, root with lines of necrosis in vascular tissue associated to Verticillium sp.
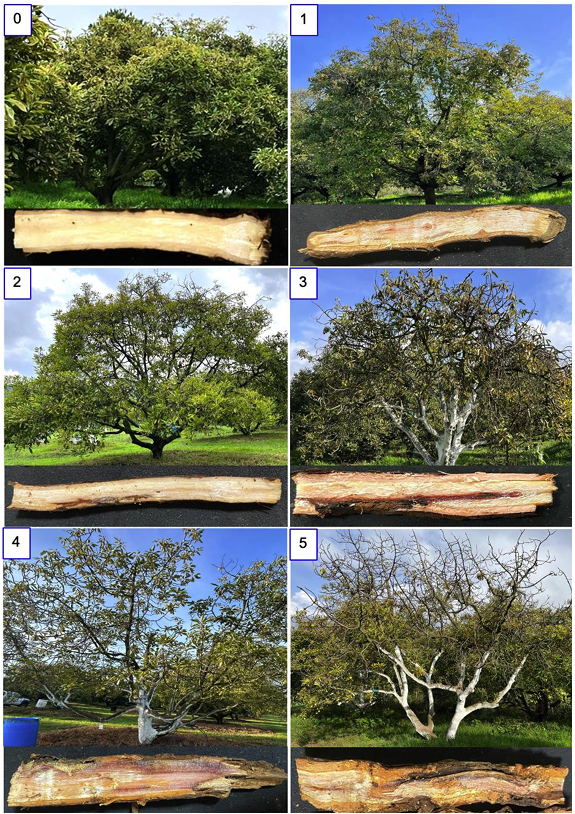
Figure 2. Nominal scale of six classes of vigor and damage in secondary roots of avocado trees associated with four genera and five species of Nectria. <strong>0.</strong> Healthy tree with 100% vigor and root without lesions; <strong>1.</strong> Apical defoliation in upper branches, root with reddish lesions <1 cm in central tissue (80 % canopy tree); <strong>2.</strong> Progressive apical defoliation in upper branches, yellowing in lower stratum of leaves, root with reddish lines in medullary parenchyma (75 %); <strong>3.</strong> Defoliation, wilt, and root with invasive necrosis in subcortical and medullary tissue (50 %); <strong>4.</strong> Partial defoliation, small leaves and root with necrosis in xylem and primary and secondary phloem (35 %); <strong>5.</strong> Defoliated tree and root with invasive necrosis (15 %).
Figure 2. Nominal scale of six classes of vigor and damage in secondary roots of avocado trees associated with four genera and five species of Nectria. 0. Healthy tree with 100% vigor and root without lesions; 1. Apical defoliation in upper branches, root with reddish lesions <1 cm in central tissue (80 % canopy tree); 2. Progressive apical defoliation in upper branches, yellowing in lower stratum of leaves, root with reddish lines in medullary parenchyma (75 %); 3. Defoliation, wilt, and root with invasive necrosis in subcortical and medullary tissue (50 %); 4. Partial defoliation, small leaves and root with necrosis in xylem and primary and secondary phloem (35 %); 5. Defoliated tree and root with invasive necrosis (15 %).
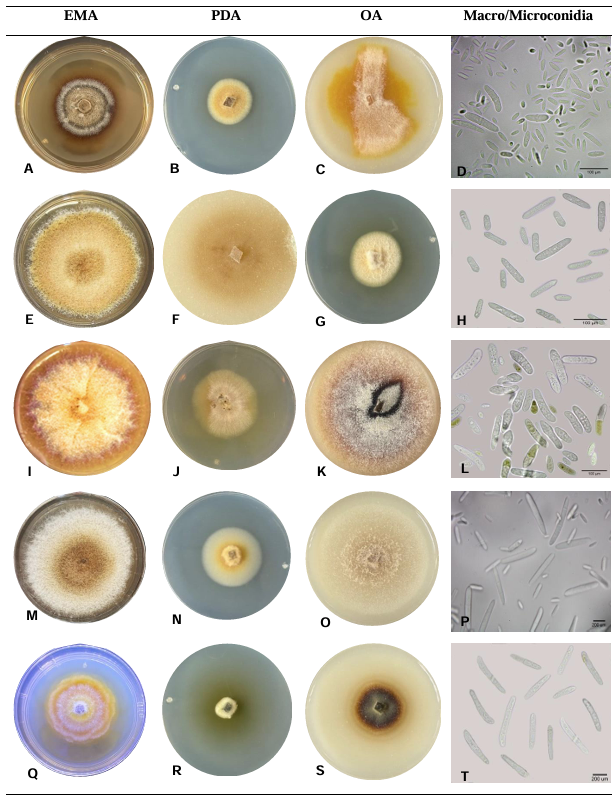
Figure 3. Cultural morphotypes of avocado tree’s root isolates with Nectria-associated symptoms molecularly identified with 97 and 64% homologies for RPB2 y TEF 1-α genes. <strong>A-D.</strong> <em>Dactylonectria macrodydima</em>; <strong>F-I.</strong> <em>Dactylonectria novozelandica</em>; <strong>J-M.</strong> <em>Ilyonectria liriodendri</em>; <strong>N-Q.</strong> <em>Mariannaea samuelsii</em>; <strong>R-T.</strong> <em>Thelonectria lucida</em>.
Figure 3. Cultural morphotypes of avocado tree’s root isolates with Nectria-associated symptoms molecularly identified with 97 and 64% homologies for RPB2 y TEF 1-α genes. A-D. Dactylonectria macrodydima; F-I. Dactylonectria novozelandica; J-M. Ilyonectria liriodendri; N-Q. Mariannaea samuelsii; R-T. Thelonectria lucida.
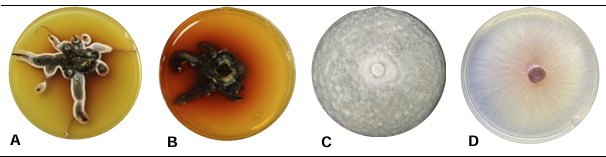
Figure 4. Cultural morphotypes in EMA at 2 % (<strong>A, B</strong>) and PDA (<strong>C, D</strong>) isolated from symptomatic avocado tree roots associated with Nectria and other organisms and identified morphologically. <strong>A.</strong> <em>Armillaria</em> sp; <strong>B.</strong> <em>Armillaria gallica</em>; <strong>C.</strong> <em>Phytophthora cinnamomi</em>; <strong>D.</strong> <em>Fusarium</em> sp.
Figure 4. Cultural morphotypes in EMA at 2 % (A, B) and PDA (C, D) isolated from symptomatic avocado tree roots associated with Nectria and other organisms and identified morphologically. A. Armillaria sp; B. Armillaria gallica; C. Phytophthora cinnamomi; D. Fusarium sp.
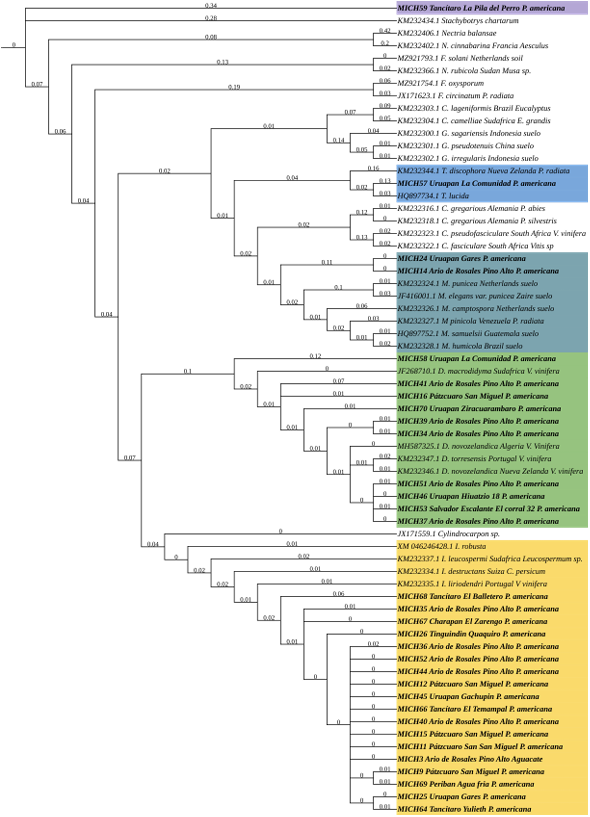
Figure 5. Phylogenetic tree obtained by Bayesian inference analysis of sequences associated with RPB2 gene of Nectria isolates collected in commercial avocado trees. Nectria species from this study are indicated with the MICH prefix. The tree had S. <em>chartarum</em> (KM231994.1) as external reference. The scale-bar represents the expected number of nucleotide changes per site.
Figure 5. Phylogenetic tree obtained by Bayesian inference analysis of sequences associated with RPB2 gene of Nectria isolates collected in commercial avocado trees. Nectria species from this study are indicated with the MICH prefix. The tree had S. chartarum (KM231994.1) as external reference. The scale-bar represents the expected number of nucleotide changes per site.
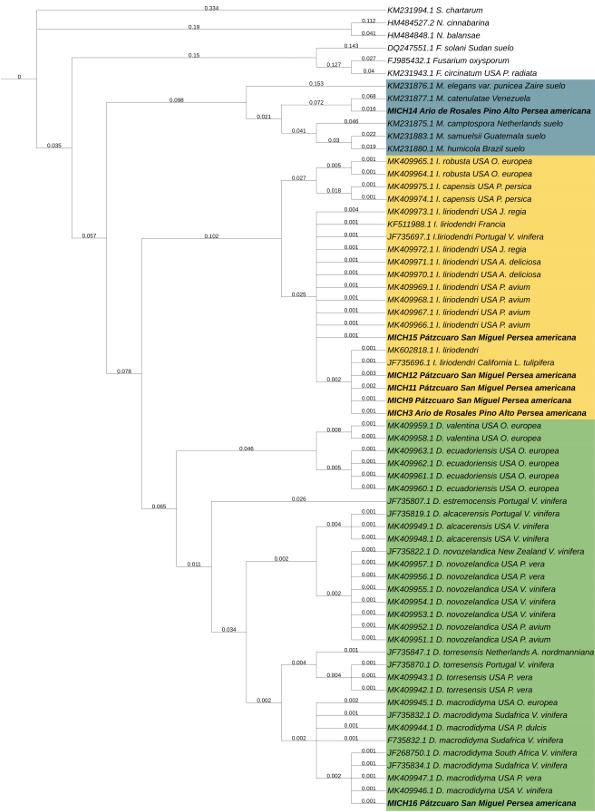
Figure 6. Phylogenetic tree obtained by Bayesian inference analysis of sequences associated with TEF <em>1-α</em> gene of Nectria isolates collected in commercial avocado trees. Nectria species from this study are indicated with the MICH prefix. The tree had S. <em>chartarum</em> (KM231994.1) as external reference. The scale-bar represents the expected number of nucleotide changes per site.
Figure 6. Phylogenetic tree obtained by Bayesian inference analysis of sequences associated with TEF 1-α gene of Nectria isolates collected in commercial avocado trees. Nectria species from this study are indicated with the MICH prefix. The tree had S. chartarum (KM231994.1) as external reference. The scale-bar represents the expected number of nucleotide changes per site.
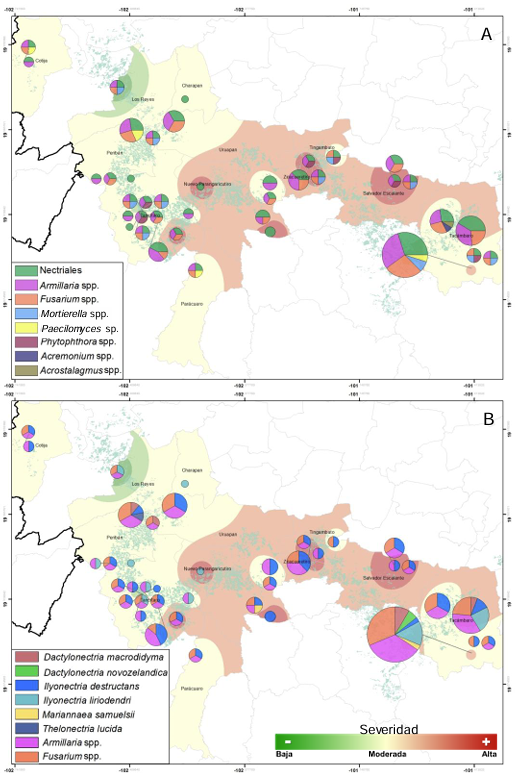
Figure 7. Distribution and regional prevalence of soil and root communities of organisms putatively associated with avocado tree decline and wilt syndrome in 13 municipalities of Michoacán. <strong>A.</strong> Phylogeographic distribution of four Nectria genera. <strong>B.</strong> Phylogeographic distribution for six Nectria species. <em>Armillaria</em> spp. and <em>Fusarium</em> spp. are included as species of high regional prevalence (comparative purposes). Green-Yellow-Brown shows the epidemic intensity (low, moderate, and high) assessed by severity scale per tree sampled
Figure 7. Distribution and regional prevalence of soil and root communities of organisms putatively associated with avocado tree decline and wilt syndrome in 13 municipalities of Michoacán. A. Phylogeographic distribution of four Nectria genera. B. Phylogeographic distribution for six Nectria species. Armillaria spp. and Fusarium spp. are included as species of high regional prevalence (comparative purposes). Green-Yellow-Brown shows the epidemic intensity (low, moderate, and high) assessed by severity scale per tree sampled
Figure 8. Associativity plots of organisms isolated from avocado tree roots with symptoms of decline syndrome. <strong>A.</strong> Pearson's correlation (r) showing association between Nectria and other soil-root organisms; y <strong>B.</strong> Cross-correlation in pairs and ordered by level of associativity for the top 25 significant correlations.
Figure 8. Associativity plots of organisms isolated from avocado tree roots with symptoms of decline syndrome. A. Pearson's correlation (r) showing association between Nectria and other soil-root organisms; y B. Cross-correlation in pairs and ordered by level of associativity for the top 25 significant correlations.
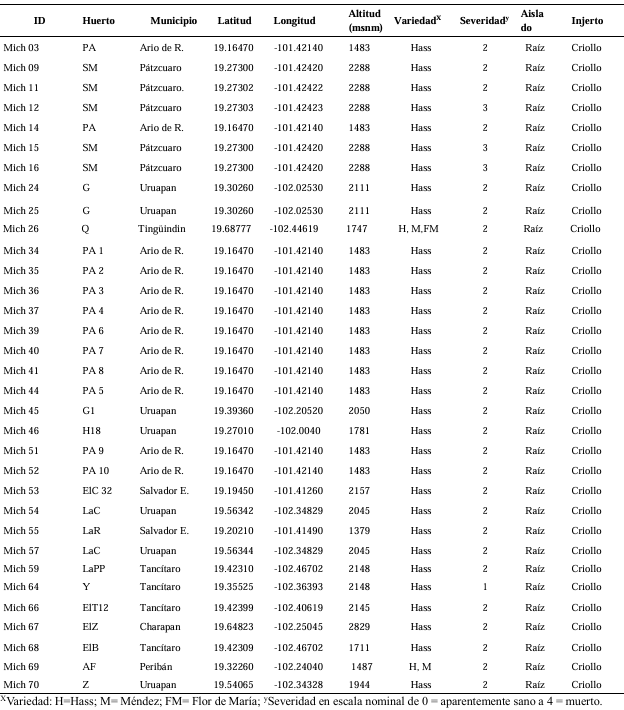
Table 1. Characteristics of orchards from Nectria isolates selected for DNA extraction and amplification.
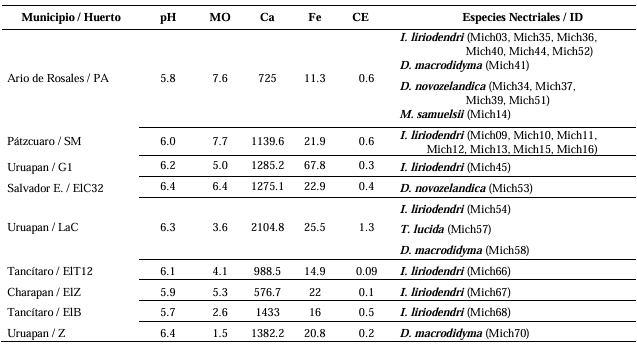
Table 2. Physicochemical characteristics of orchards sampled for Nectria isolates in avocado trees.
  • Vol. 2024, 42(4)
  • Scientific Article
  • Special Issue

Control in vitro of Neopestalotiopsis sp. isolated from strawberry by Trichoderma and commercial fungicides

byGabriela Olivares Rodriguez, Juan Gabriel Angeles Núñez, Francisco Mondragón Rojas, Patricia Rivas Valencia, José Luis Zárate Castrejón, Luis Antonio Mariscal Amaro, Luis Febronio Díaz Espino, Talina Olivia Martínez Martínez*

Received: 10/July/2024 – Published: 31/December/2024
DOI: https://doi.org/10.18781/R.MEX.FIT.2024-28

Abstract Background/Objective. The fungi Neopestalotiopsis sp. is an emerging pathogen that can cause losses of more than 70 % of production in strawberry crops. Due to this situation, is necessary to evaluate and implement control methods with low ecological impact. The objective of this work was evaluated the inhibitory growth of Neopestalotiopsis sp. using antagonist strains of Trichoderma sp. and fungicides used locally in the Bajio of Guanajuato, México.

Materials and Methods. The pathogen was isolated in strawberry symptomatic plants. The morphological and pathogenicity characterization of the isolate was carried out. The Trichoderma strains were obtained from the biological collection of the National Forestry, Agricultural and Livestock Institute (INIFAP), Bajio Experimental Field (CEBAJ), and were confront in dual cultures with the pathogen, the percentage of radial growth inhibition (PRGI) was calculated at 120 h. In addition, five commercial fungicides were added to the growth medium and was calculated the growth diameter of the fungus.

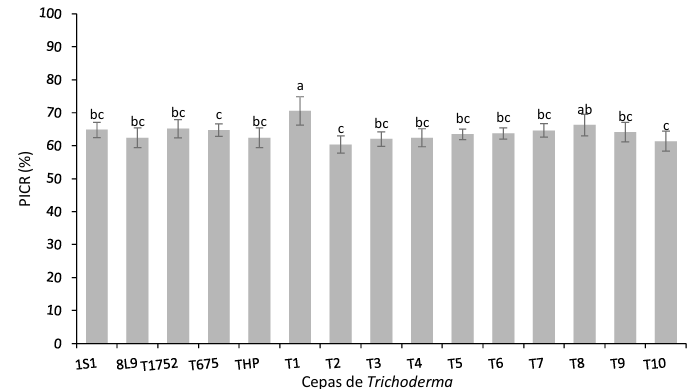
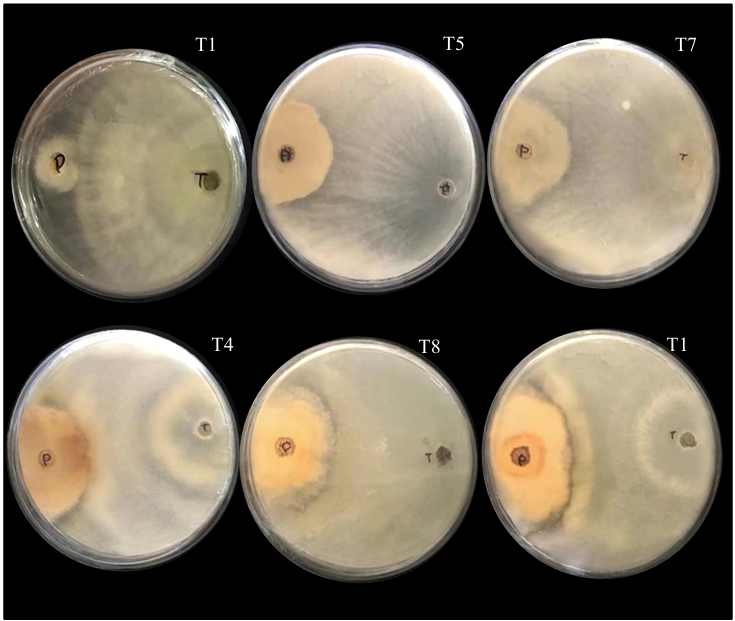
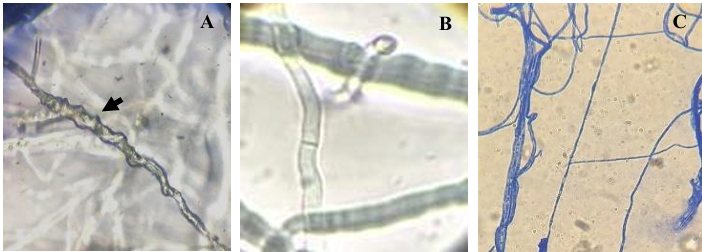
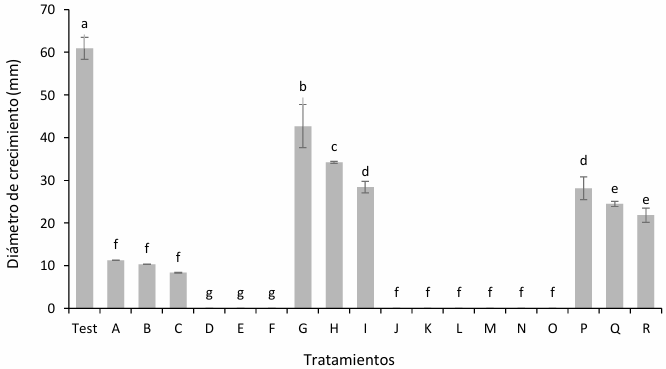
Results. The PRGI by Trichoderma were observed in a range of 63 to 70 %. The mechanisms of parasitism for Trichoderma were curling, adhesion and lysis to the pathogen hypha. The T1 strain was the greatest potential for controlling the pathogen, followed by T5 and T7. Three fungicides, Tecobenazole (100 mL 100 L-1), Cinnamon and Neem extract (500 mL 100 L-1), and Peracetic Acid (25 mL 100 L-1) had 100 % inhibited of fungal growth.

Conclusion. These results contribute to the knowledge on the control of Neopestalotiopsis sp. with the application of Trichoderma and the authorized products in Mexico

Show Figures and/or Tables
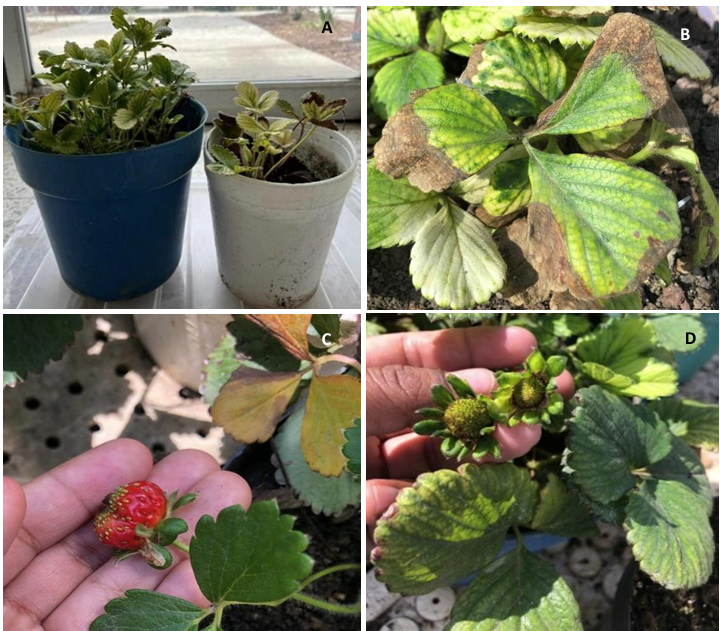
Figure 1. Symptoms in strawberry plants infected by <em>Neopestaloptiosis</em> sp. A) Stunting of plants, B) Blight in leaves, C and D) Deformation in mature and immature fruits.
Figure 1. Symptoms in strawberry plants infected by Neopestaloptiosis sp. A) Stunting of plants, B) Blight in leaves, C and D) Deformation in mature and immature fruits.
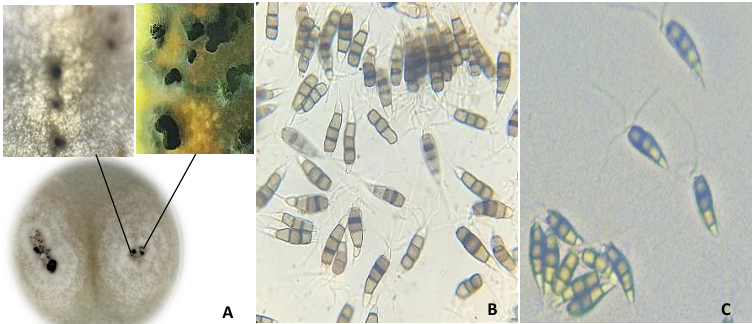
Figure 2. Growth of <em>Neopestalotiopsis</em> sp. in a PDA medium after two weeks of inoculation. A) Development of colonies in a culture medium with black acervuli, B and C) Fungal conidia.
Figure 2. Growth of Neopestalotiopsis sp. in a PDA medium after two weeks of inoculation. A) Development of colonies in a culture medium with black acervuli, B and C) Fungal conidia.
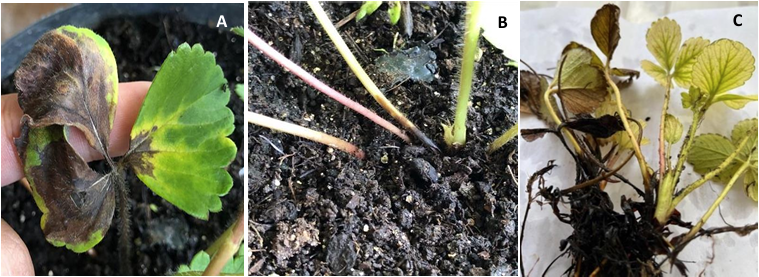
Figure 3. Symptoms on strawberry plants caused by <em>Neopestalotiopsis</em> sp. A) Blight on leaves, B) Necrosis on the stem and C) Necrosis in neck and leaves.
Figure 3. Symptoms on strawberry plants caused by Neopestalotiopsis sp. A) Blight on leaves, B) Necrosis on the stem and C) Necrosis in neck and leaves.
Figure 4. Percentage of inhibition of root growth for <em>Neopestalotiopsis</em> sp. obtained from the confrontation with Trichoderma strains (p≤0.05).
Figure 4. Percentage of inhibition of root growth for Neopestalotiopsis sp. obtained from the confrontation with Trichoderma strains (p≤0.05).
Figure 5. Confrontations of <em>Trichoderma</em> strains against <em>Neopestalotiopsis</em> sp. where T = <em>Trichoderma</em> and P = pathogen. The <br />number found on the top right corner corresponds to the identification of the <em>Trichoderma</em> strain. T1, T5 and T7 are <br />observed to maintain a level II antagonism, while T4, T8 and T10 maintain a level III.
Figure 5. Confrontations of Trichoderma strains against Neopestalotiopsis sp. where T = Trichoderma and P = pathogen. The
number found on the top right corner corresponds to the identification of the Trichoderma strain. T1, T5 and T7 are
observed to maintain a level II antagonism, while T4, T8 and T10 maintain a level III.
Figure 6. Mechanisms of parasitism in <em>Trichoderma</em> sp against <em>Neopestaloptiopsis</em> sp. A) Curling, B) Formation of hooks and C) Adhesion and lysis.
Figure 6. Mechanisms of parasitism in Trichoderma sp against Neopestaloptiopsis sp. A) Curling, B) Formation of hooks and C) Adhesion and lysis.
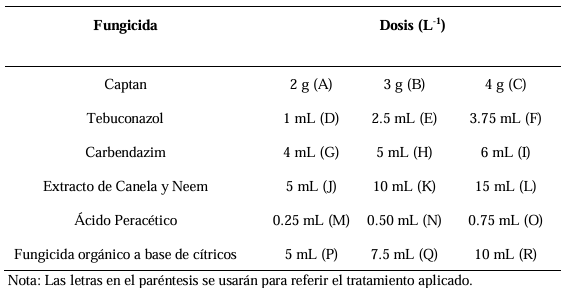
Figure 7. Growth of <em>Neopestalotiopsis</em> sp in a PDA medium with commercial fungicides. Test: control with no product; A-C: Captan 200, 300 and 400 g 100 L<sup>-1</sup>; D-F: Tebuconazole 100, 250 and 375 mL 100 L<sup>-1</sup>; G-I: Carbendazim 400, 500 and 600 mL 100 L<sup>-1</sup>; J-L: Extract of Cinnamon and Neem 500, 1000 and 1500 mL 100 L<sup>-1</sup>; M-O: Peracetic Acid 25, 50 and 75 mL 100 L<sup>-1</sup>; P-R: Citrus-based organic fungicide 500, 750 and 1000 mL 100 L 1 . 400 g and 600 mL 100 L<sup>-1</sup> (p≤0.05).
Figure 7. Growth of Neopestalotiopsis sp in a PDA medium with commercial fungicides. Test: control with no product; A-C: Captan 200, 300 and 400 g 100 L-1; D-F: Tebuconazole 100, 250 and 375 mL 100 L-1; G-I: Carbendazim 400, 500 and 600 mL 100 L-1; J-L: Extract of Cinnamon and Neem 500, 1000 and 1500 mL 100 L-1; M-O: Peracetic Acid 25, 50 and 75 mL 100 L-1; P-R: Citrus-based organic fungicide 500, 750 and 1000 mL 100 L 1 . 400 g and 600 mL 100 L-1 (p≤0.05).
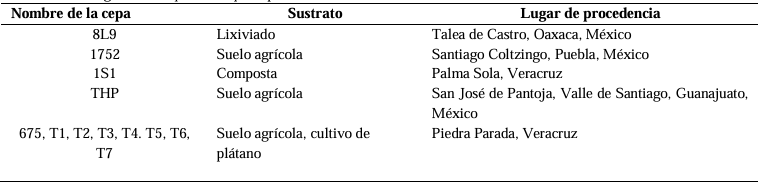
Table 1. Identification data, isolation substrate and origin of the <em>Trichoderma</em> sp. strains used in the biological control of <em>Neopestalotiopsis</em> sp.
Table 1. Identification data, isolation substrate and origin of the Trichoderma sp. strains used in the biological control of Neopestalotiopsis sp.
Table 2. Fungicides evaluated in <em>Neopestalotiopsis</em> sp. growth inhibition.
Table 2. Fungicides evaluated in Neopestalotiopsis sp. growth inhibition.
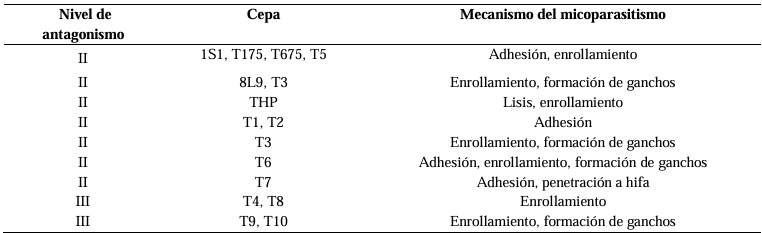
Table 3. Level of antagonism according to Bell <em>et al</em>. (1982) and mycoparasitim mechanisms.
Table 3. Level of antagonism according to Bell et al. (1982) and mycoparasitim mechanisms.
  • Vol. 2025, 43(1)
  • Scientific Article

Antifungal effect of clove essential oil and its main components on fungi isolated from corn tortillas

byAna Patricia Ibarra Valenzuela, Rosalba Troncoso Rojas, Alma Rosa Islas Rubio, Elizabeth Peralta, Herlinda Soto Valdez*, Hayati Samsudin

Received: 09/April/2024 – Published: 31/December/2024
DOI: https://doi.org/10.18781/R.MEX.FIT.2404-4

Abstract Objective/Background. Corn tortillas are a staple food in México that have a shelf life of 1-2 days at 25 °C due to fungal growth. A natural alternative for controlling fungal growth is clove essential oil (AEC) and its major components: eugenol (E), isoeugenol (I), and eugenyl acetate (AE). Objective: to evaluate the antifungal effect of AEC on the identified fungi present in corn tortillas.

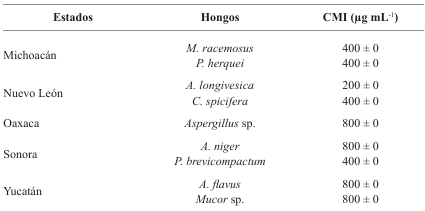
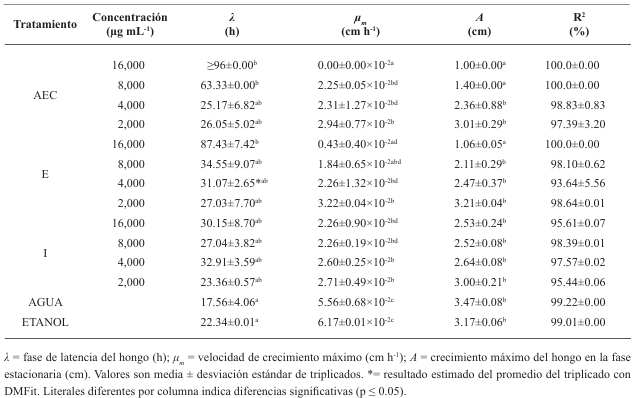
Materials and Methods. One kg samples of corn tortillas were obtained from the capitals of five states of Mexico (Sonora, Nuevo León, Michoacán, Oaxaca y Yucatán). Fungi were identified by their morphology and molecular biology. Moreover, the minimum inhibitory concentration (MIC) against AEC was determined. The effect of E, I, and AE on Aspergillus niger was evaluated with the Gompertz model.

Results. Two fungi were isolated from corn tortillas purchased in Nuevo León, Sonora, Yucatán, and Michoacán, and one fungus from those purchased in Oaxaca. The following fungi were identified by molecular biology in corn tortillas: Aspergillus longivesica and Curvularia spicifera from Nuevo León; Aspergillus niger and Penicillium brevicompactum from Sonora; Aspergillus sp. from Oaxaca; Mucor sp. and Aspergillus flavus from Yucatán; Penicillium herquei and Curvularia racemosus from Michoacán. The MICs were 200, 400, 800, 400, 800, 400, 800, 800, and 400 µg mL-1, respectively. AEC, E, and I at a concentration of 800 µg mL-1 delayed the growth exponential phase of Aspergillus niger, while AE did not show any effect.

Conclusion. AEC could be a natural alternative for prolonging the corn tortillas′ shelf life.

Show Figures and/or Tables
Figure 1. Fungal structure by optic microscopy (40X), isolated from corn tortillas from Morelia, Mich (A: <em>Penicillium</em> sp. and F: <em>Mucor</em> sp.), Monterrey, N.L. (B: <em>Aspergillus</em> sp. and G: <em>Curvularia</em> sp.), Oaxaca, Oax (C: <em>Aspergillus</em> sp.), Hermosillo, Son (D: <em>Penicillium</em> sp. and H: <em>Aspergillus</em> sp.) and Mérida, Yuc (E: <em>Aspergillus</em> sp. and I: <em>Mucor</em> sp.).
Figure 1. Fungal structure by optic microscopy (40X), isolated from corn tortillas from Morelia, Mich (A: Penicillium sp. and F: Mucor sp.), Monterrey, N.L. (B: Aspergillus sp. and G: Curvularia sp.), Oaxaca, Oax (C: Aspergillus sp.), Hermosillo, Son (D: Penicillium sp. and H: Aspergillus sp.) and Mérida, Yuc (E: Aspergillus sp. and I: Mucor sp.).
Figure 2. Growth of fungi in PDA isolated from corn tortillas from Morelia, Mich (A, <em>Penicillium</em> sp. and F, <em>Mucor</em> sp.), Monterrey, N.L. (B, <em>Aspergillus</em> sp. and G, <em>Curvularia</em> sp.), Oaxaca, Oax (C, <em>Aspergillus</em> sp.), Hermosillo, Son (D, <em>Penicillium</em> sp. and H, <em>Aspergillus</em> sp.) and Mérida, Yuc (E, <em>Aspergillus</em> sp. and I, Mucor sp.).
Figure 2. Growth of fungi in PDA isolated from corn tortillas from Morelia, Mich (A, Penicillium sp. and F, Mucor sp.), Monterrey, N.L. (B, Aspergillus sp. and G, Curvularia sp.), Oaxaca, Oax (C, Aspergillus sp.), Hermosillo, Son (D, Penicillium sp. and H, Aspergillus sp.) and Mérida, Yuc (E, Aspergillus sp. and I, Mucor sp.).
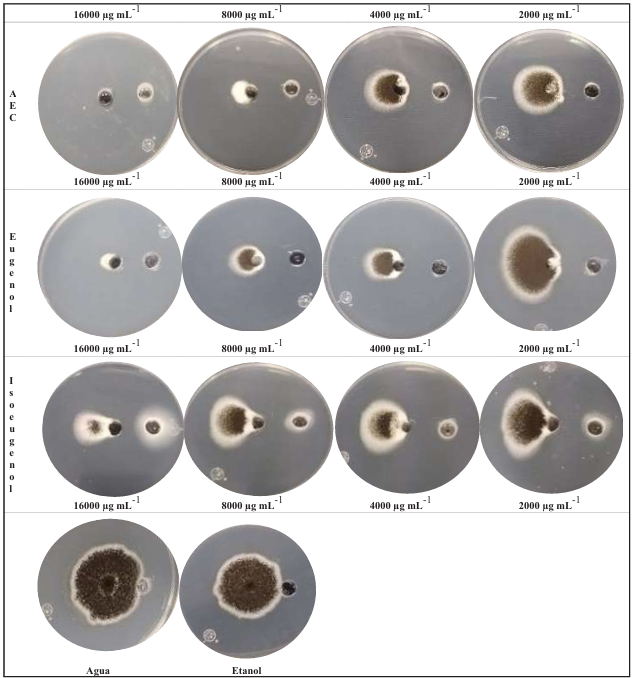
Figure 3. Antifungal effect of AEC, E and I on the growth of <em>Aspergillus</em> <em>niger</em> on PDA 96 h after de incubation at 25 ± 1 °C.
Figure 3. Antifungal effect of AEC, E and I on the growth of Aspergillus niger on PDA 96 h after de incubation at 25 ± 1 °C.
Figure 4. Kinetics of mycelial growth of <em>Aspergillus</em> <em>niger</em> on PDA for 96 h of incubation at 25 ± 1 °C. yVal= y values; Fit 1=curve with adjusted data.
Figure 4. Kinetics of mycelial growth of Aspergillus niger on PDA for 96 h of incubation at 25 ± 1 °C. yVal= y values; Fit 1=curve with adjusted data.
Table 1. Minimum inhibiting concentration (MIC) of clove essential oil on fungi (250 conidia) isolated from corn tortillas.
Table 2. Kinetic parameters of the effect of the clove essential oil (AEC), eugenol (E) and isoeugenol (I) on the mycelial growth of <em>Aspergillus</em> <em>niger</em> incubated at 25 ± 1 °C for 96 h, obtained with Excel DMFit 3.5.
Table 2. Kinetic parameters of the effect of the clove essential oil (AEC), eugenol (E) and isoeugenol (I) on the mycelial growth of Aspergillus niger incubated at 25 ± 1 °C for 96 h, obtained with Excel DMFit 3.5.
  • Vol. 2025, 43(1)
  • Phytopathological Note

Ovicidal effect of Canavalia ensiformis seed extract with SiO2 nanoparticles on Meloidogyne incognita

byAugusto Gil Ceballos Ceballos, Yisa María Ochoa Fuentes*, Ernesto Cerna Chávez, Arely Cano García

Received: 18/April/2024 – Published: 31/December/2024
DOI: https://doi.org/10.18781/R.MEX.FIT.2404-5

Abstract Background/Objective. Seed extracts from Canavalia ensiformis have shown both antiparasitic and repellent effects against pests. To evaluate the effectiveness of the extract combined with silicon dioxide nanoparticles (NPs) against Meloidogyne incognita eggs.

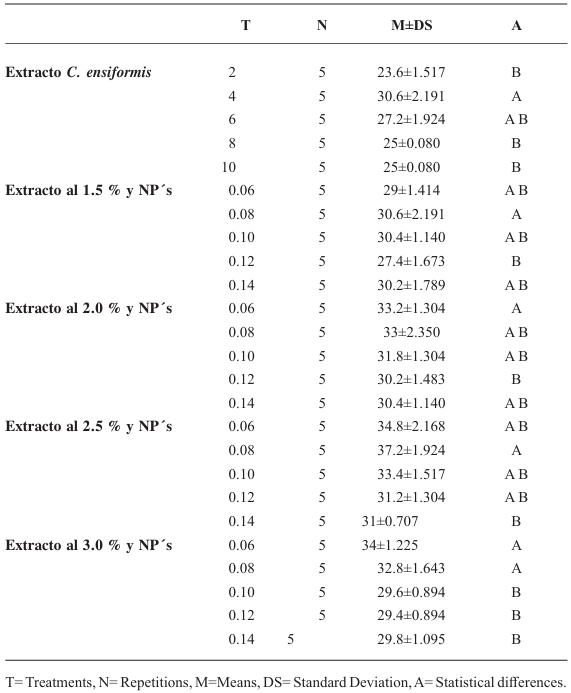
Materials and Methods. In vitro experiments were conducted to assess the effects of C. ensiformis seed extracts, alone and combined with silicon dioxide NPs, on M. incognita juveniles hatching. 150 eggs were used, and concentrations of 0, 2, 4, 6, 8, and 10 % of the extract were applied. Additionally, concentrations of the extract at 0, 1.5, 2.0, 2.5, and 3.0 %, each combined with NP concentrations at 0.06, 0.08, 0.10, 0.12, and 0.14 %, were evaluated.

Results. None of the treatments prevented more than 30 % of juveniles hatching. It was concluded that modifying the technique for obtaining C. ensiformis seed extract could have a complementary ovicidal effect; however, increasing the extract concentrations could serve as a medium for the proliferation of saprophytic fungi and other microorganisms.

Conclusion. The treatments did not show significant ovicidal effects.

Show Figures and/or Tables
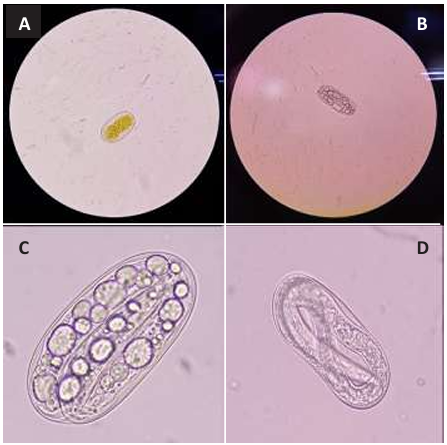
Figure 1. A: egg corresponding to the non-inoculated control and fixed with cotton blue (100). B: egg inoculated with <em>Canavalia ensiformis</em> extract and NPs (100X). C: amplified image of egg inoculated with C. ensiformis and NPs (100X). D: egg inoculated with <em>C. ensiformis</em> extract (100X).
Figure 1. A: egg corresponding to the non-inoculated control and fixed with cotton blue (100). B: egg inoculated with Canavalia ensiformis extract and NPs (100X). C: amplified image of egg inoculated with C. ensiformis and NPs (100X). D: egg inoculated with C. ensiformis extract (100X).
Table 1. Means comparison of the effect of the treatments of the extract of <em>Canavalia ensiformis</em> seeds and silicon dioxide NPs on <em>Meloidogyne incognita</em> eggs.
Table 1. Means comparison of the effect of the treatments of the extract of Canavalia ensiformis seeds and silicon dioxide NPs on Meloidogyne incognita eggs.
  • Vol. 2025, 43(1)
  • Scientific Article

Estimation of losses caused by Potato virus Y in potato crop in Coahuila

byJoel De Santiago Meza*, Gustavo Alberto Frías Treviño, Luis Alberto Aguirre Uribe, Alberto Flores Olivas

Received: 05/April/2024 – Published: 30/December/2024
DOI: https://doi.org/10.18781/R.MEX.FIT.2404-2

Abstract Background/Objective. The objective was to experimentally evaluate the losses caused by PVY in the Fianna variety potato crop and, consequently, estimate the losses caused by this virus in the potato-producing area of Coahuila.

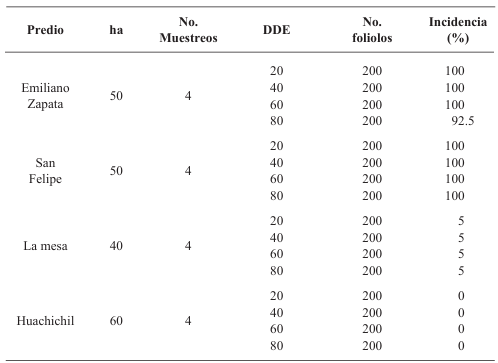
Materials and Methods. Furrows of an experimental plot planted with potato seedling and seed-tuber, were mechanically inoculated with PVY at 20, 40, 60 and 80 days after emergence. The tubers produced were harvested and losses in each treatment were evaluated. Additionally, in four commercial potato fields in this same state, leaflet samples were taken at 20, 40, 60 and 80 days after the emergence, and the percentage of plants infected with PVY was evaluated by ELISA tests. Loss data from the experimental plot and incidence data from the farms were used to develop a statistical model to estimate losses caused by PVY in the Coahuila region.

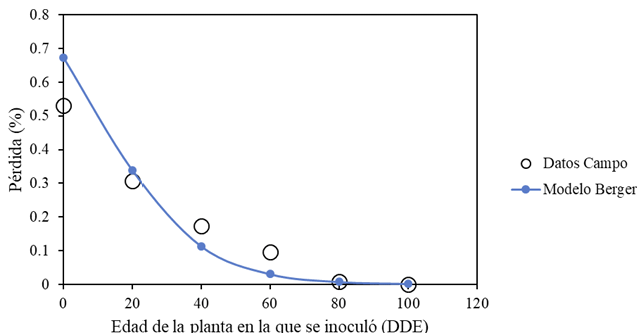
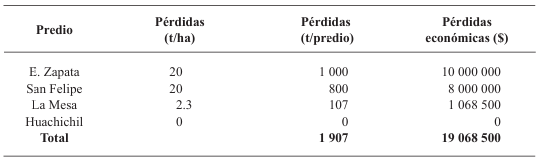
Results. Yield losses due to PVY in the experimental plot were 9.4% to 53%. The percentage of incidence of infected plants in commercial properties varied from 0% to 100%. The model that best fit the data obtained was Berger's Y=1/[1+e (-{ln[yo/(1-y0)]+r*dae})]. The estimated losses in the Coahuila region in the 2022 cycle were 18%, equivalent to $19 068500.

Conclusión: This information highlights the importance of using certified PVY-free seed and protecting the crop from emergence until 60 DAE.

Show Figures and/or Tables
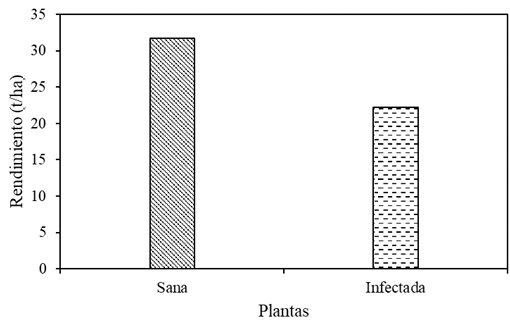
Figure 1. Yield per hectare of Fianna potato plants in Assay 1.
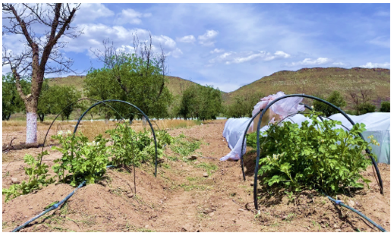
Figure 2. Left: plants grown from tuber seed infected with PVY; right: plants grown from PVY-free tuber seed.
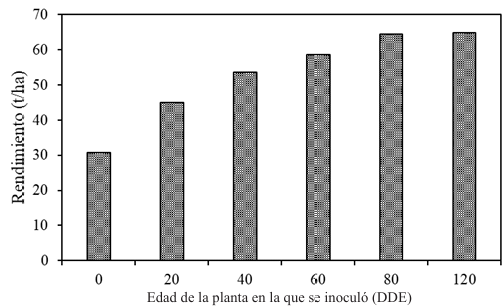
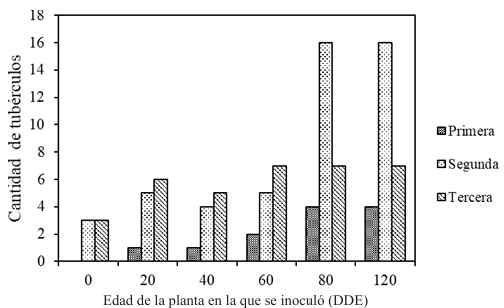
Figure 3. Yield per hectare of plants grown from infected tuber seed (0), plants inoculated at 20, 40, 60, and 80 DAE, and healthy plants (remained healthy throughout the 120-day cycle).
Figure 4. Fit of the Berger model explaining 98% of the variation in losses relative to the date of PVY infection (days after emergence - DAE).
Figure 5. Quantity and quality of tubers produced by plants grown from infected tuber seed (0), plants inoculated at 20, 40, 60, and 80 days after emergence (DAE), and healthy plants.
Figure 6. Tubers produced by: A) plants grown from infected tuber seed; B) plants inoculated at 20 DAE; C) plants inoculated at 40 DAE; D) plants inoculated at 60 DAE; E) plants inoculated at 80 DAE; F) healthy plants (no inoculation).
Table 1. Percentage of infected plants in commercial fields; ha = hectares, No. Samples = number of samples per field, DAE = days after emergence, No. Leaflets = number of leaflets.
Table 2. Estimated yield and economic losses in the potato-producing region of Coahuila.
  • Vol. 2025, 43(1)
  • Review Article

Molecular aspects of phaseolotoxin biosynthesis produced by Pseudomonas syringae pv. phaseolicola

byAlejandra Chacón López, José Luis Hernández Flores, Efigenia Montalvo González, Selene Aguilera Aguirre*

Received: 20/August/2024 – Published: 30/December/2024
DOI: https://doi.org/10.18781/R.MEX.FIT.2308-2

Abstract Background/Objective. Phaseolotoxin is produced by one of the most important and studied phytopathogens in the agricultural area: Pseudomonas syringae pv. phaseolicola. This bacterium causes halo blight, a disease that devastates the bean crop. The success of P. syringae pv. phaseolicola is related to its genetic information, which allows it to synthesize deleterious metabolites for its host, such as phaseolotoxin. This research aimed to analyze the molecular basis of the mechanism of action, immunity, genetics involved in the biosynthesis of phaseolotoxin, molecular diagnostic strategies, and molecular techniques developed in Mexico to manage bean halo blight.

Materials and Methods. The search and analysis of the most relevant scientific information regarding the biosynthesis of phaseolotoxin and the molecular studies of the pathogenicity and virulence factors of P. syringae pv. phaseolicola has contributed to the development of molecular strategies focused on the diagnosis and management of halo blight in beans.

Results. P. syringae pv. phaseolicola produce phaseolotoxin, responsible for forming the chlorotic halo characteristic of halo blight, this toxin is an inhibitor of OCTase, an enzyme that participates in the arginine synthesis pathway in beans. The Pht and Pbo chromosomal regions contain genes involved in the synthesis and immunity of phaseolotoxin, and the expression of these genes is regulated by the GacS/GacA system and temperature. The identification of genes involved in the synthesis of pathogenicity and virulence factors, such as phaseolotoxin, has allowed the development of strategies for diagnosis and management of the disease based on DNA amplification and the use of molecular markers that facilitate the identification of bean cultivars resistant to the pathogen.

Conclusion. Molecular studies have contributed to understanding how the phaseolicola pathovar produces phaseolotoxin. This information has been essential to understanding how bacteria have evolved from non-pathogenic to pathogenic variants. In addition, they provide information that allows the development of new strategies for timely diagnosis and contributes to strategies for managing halo blight.

Show Figures and/or Tables
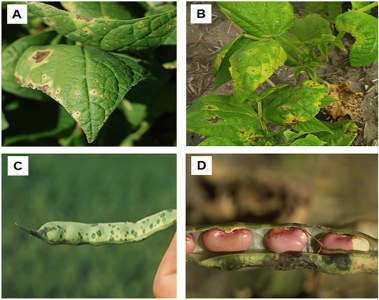
Figure 1. Symptoms produced BY P. syringae pv. phaseolicola ON bean. A Y B, Symptoms ON leaves. C Y D, Symptoms ON pods. Source: Adapted FROM Schwartz, (2008); Harveson, (2009).
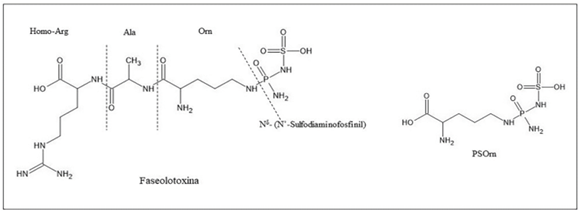
Figure 2. Phaseolotoxin structure and PSOrn, product of phaseolotoxin degradation by plant peptidases.
Figure 3. Graphic representation of the Pht and Pbo Regions on <em>P. syringae</em> pv. phaseolicola chromosome. A, Pht Region operons. B, Pbo Region operons. Each arrow represents one gene, the direction of the arrow indicates the direction of transcription.
Figure 3. Graphic representation of the Pht and Pbo Regions on P. syringae pv. phaseolicola chromosome. A, Pht Region operons. B, Pbo Region operons. Each arrow represents one gene, the direction of the arrow indicates the direction of transcription.
Figure 4. Model of signaling and regulation of phaseolotoxin biosynthesis in <em>P. syringae</em> pv. phaseolicola NPS3121. Temperature is sensed by the GacS membrane sensor, which autophosphorylates therefore (1). Phosphorylated GacS transfers phosphate to the response regulator GacA (2). GacA controls the expression of <em>pht</em> genes, mediated by the IHF regulator. GacA also controls the transcription of the <em>pbo</em> genes (3). Finally, phaseolotoxin is synthesized, which inhibits bean OCTase and prevents the synthesis of arginine. Consequently, the chlorotic halo develops.
Figure 4. Model of signaling and regulation of phaseolotoxin biosynthesis in P. syringae pv. phaseolicola NPS3121. Temperature is sensed by the GacS membrane sensor, which autophosphorylates therefore (1). Phosphorylated GacS transfers phosphate to the response regulator GacA (2). GacA controls the expression of pht genes, mediated by the IHF regulator. GacA also controls the transcription of the pbo genes (3). Finally, phaseolotoxin is synthesized, which inhibits bean OCTase and prevents the synthesis of arginine. Consequently, the chlorotic halo develops.
Figure 5. Representative map of the distribution of <em>P. syringae</em> pv. <em>phaseolicola</em> in Mexico. The states marked with yellow color indicate the presence of this bacteria.
Figure 5. Representative map of the distribution of P. syringae pv. phaseolicola in Mexico. The states marked with yellow color indicate the presence of this bacteria.
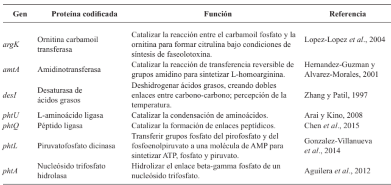
Table 1. Function of <em>pht</em> genes involved in phaseolotoxin synthesis.
Table 1. Function of pht genes involved in phaseolotoxin synthesis.
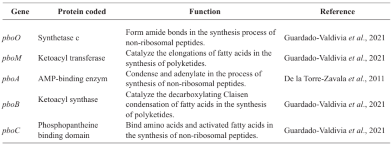
Table 2. Prediction of the function of <em>pbo</em> genes involved in the phaseolotoxin synthesis.
Table 2. Prediction of the function of pbo genes involved in the phaseolotoxin synthesis.
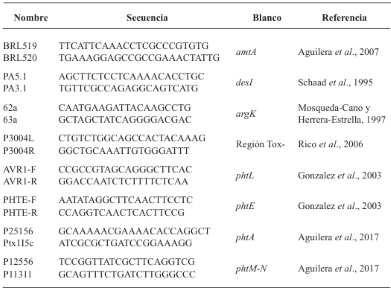
Table 3. Oligonucleotides used to identify strains of <em>P. syringae</em> pv. <em>phaseolicola</em> producing phaseolotoxin.
Table 3. Oligonucleotides used to identify strains of P. syringae pv. phaseolicola producing phaseolotoxin.
  • Vol. 2025, 43(1)
  • Scientific Article

Toxicity of contact fungicides to four Trichoderma species: an in vitro compatibility approach

byConrado Parraguirre Lezama, Omar Romero Arenas*, Alba Cruz Coronel, Amparo Mauricio Gutiérrez, Carlos A Contreras Pare, Antonio Rivera Tapia

Received: 25/February/2024 – Published: 27/December/2024
DOI: https://doi.org/10.18781/R.MEX.FIT.2402-7

Abstract Objective/Background. The transition towards responsible agricultural practices is essential to promote the health of agroecosystems and ensure food security. Promoting comprehensive research that combines chemical and biological methods represents a significant advance in the management of phytopathogens. This novel approach is based on the premise that the joint action between fungicides and an antagonistic agent such as Trichoderma spp. can offer robust protection compared to individual approaches. The objective of the study is to investigate the in vitro resistance and compatibility of four Trichoderma species against three fungicides widely used in Mexico.

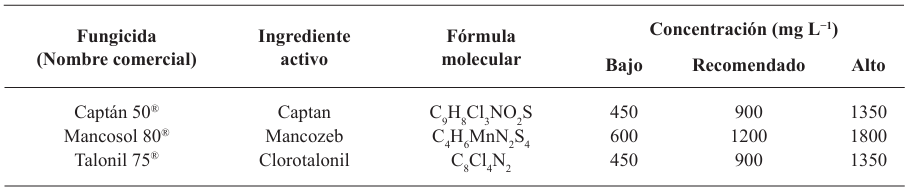
Materials and Methods. The controlled poisoning technique was used in PDA medium under controlled conditions with three concentrations (450, 900 and 1350 mg L−1) for the active ingredients Captan and Chlorothalonil, while for Mancozeb 600, 1200 and 1800 mg L−1 were used. Compatibility was determined in relation to the control group using the statistical software SPSS Statistics version 26 for the Windows operating environment.

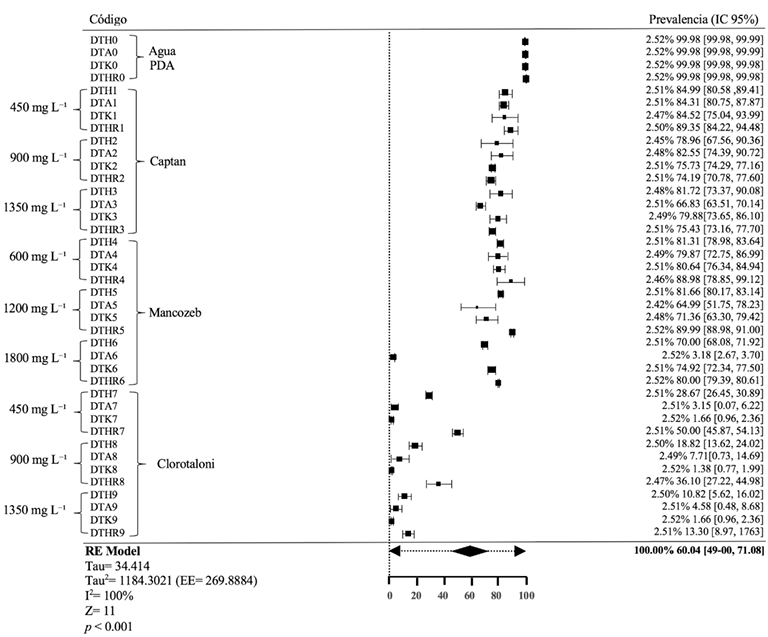
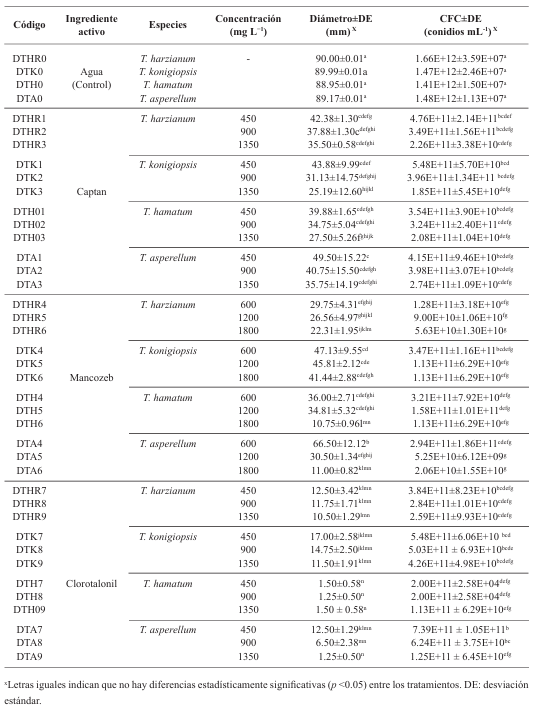
Results. The study revealed that the strains of T. harzianum, T. hamatum, T. koningiopsis and T. asperellum exhibited an overall compatibility of 60.04% for the active ingredients evaluated, with the fungicide Captan 50® showing the highest percentage of compatibility (79.87%) at concentrations of 450, 900 and 1350 mg L–1. T. harzianum showed greater tolerance to the active ingredient Chlorothalonil at a concentration of 450 mg L-1, however, at higher concentrations it showed greater toxicity, with T. koningiopsis exhibiting the lowest resistance at its three tested concentrations.

Conclusion. Treatments with different concentrations of the fungicides Captan, Mancozeb and Chlorothalonil showed a marked variability in terms of prevalence and toxicity towards the tested Trichoderma species in vitro. This approach allows the design of integrated management strategies minimizing the dependence on chemical products and promoting compatibility between biological agents and fungicides.

Show Figures and/or Tables
Figure 1. Percentage of mycelial growth inhibition (PI) in four <em>Trichoderma</em> species at different fungicide concentrations under controlled conditions. *Identical letters indicate no statistically significant differences (p < 0.05) between treatments.
Figure 1. Percentage of mycelial growth inhibition (PI) in four Trichoderma species at different fungicide concentrations under controlled conditions. *Identical letters indicate no statistically significant differences (p < 0.05) between treatments.
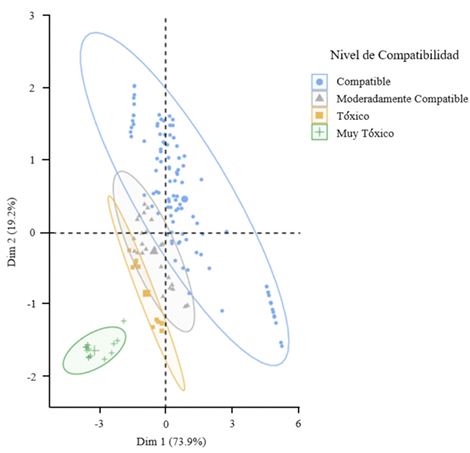
Figure 2. Principal component analysis explained 93.1% of the variance in two components regarding the compatibility of four native <em>Trichoderma</em> strains at different fungicide concentrations, according to the scale established by Alves<em> et al</em>. (1998)
Figure 2. Principal component analysis explained 93.1% of the variance in two components regarding the compatibility of four native Trichoderma strains at different fungicide concentrations, according to the scale established by Alves et al. (1998)
Figure 3. Forest plot representing compatibility (C%), indicated by the means and their 95% confidence intervals, associated with each combination of strain and fungicide concentration, showing relative resistance and toxicity.
Table 1. Fungicides used at different evaluated concentrations.
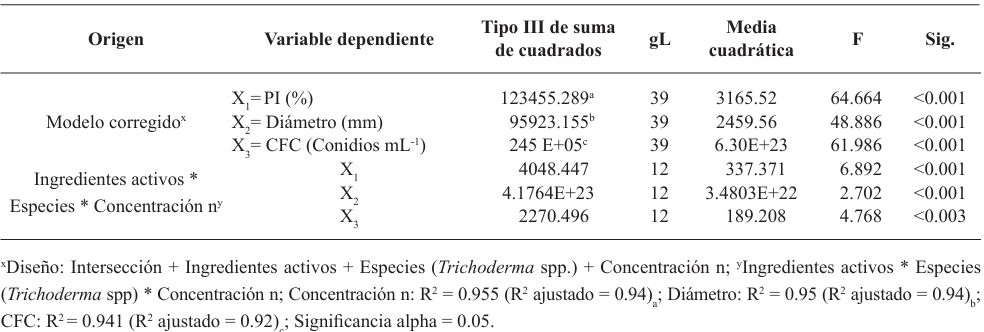
Table 2. Partial multifactorial analysis of variance (MANOVA) for the effects of active ingredients, species (<em>Trichoderma</em> spp.), and concentration on the percentage of mycelial growth inhibition (PI), diameter (mm), and conidial formation capacity (CFC).
Table 2. Partial multifactorial analysis of variance (MANOVA) for the effects of active ingredients, species (Trichoderma spp.), and concentration on the percentage of mycelial growth inhibition (PI), diameter (mm), and conidial formation capacity (CFC).
Table 3. Evaluation of four <em>Trichoderma</em> species at different fungicide concentrations under controlled conditions.
Table 3. Evaluation of four Trichoderma species at different fungicide concentrations under controlled conditions.
  • Vol. 2025, 43(1)
  • Phytopathological Note

Etiology of brown rot in strawberry (Fragaria x nanassa) in the State of Mexico

byHugo Velasco Montaño, Victoria Ayala Escobar, Daniel Téliz Ortiz, Nadia Landero Valenzuela*, Santos Gerardo Leyva Mir

Received: 07/June/2024 – Published: 27/December/2024
DOI: https://doi.org/10.18781/R.MEX.FIT.2406-3

Abstract Background/Objective. In a strawberry crop established in a greenhouse in Montecillo, Texcoco, State of Mexico, in 2022, brownish brown leaf spots and rotting of fruits with asymmetric sunken lesions were observed, which extended and acquired a brown color. The objective of the present work was to identify the causal agent of brown rot in fruits and strawberry plants.

Materials and Methods. Symptomatic fruits and leaves were collected, from which fungal isolates were obtained to perform pathogenicity tests on plants and fruits, in plants by two inoculation methods: spraying via foliar and via root; in fruits by immersion. Concentrations of 2×10⁶ conidia mL-1 were used. The ITS region of the rDNA was amplified and sequenced by PCR with the universal primers ITS1-ITS4.

Results. Pilidium concavum was morphologically and molecularly identified as the causal agent of brown spot and brown rot on strawberry. It was found to be pathogenic in strawberry fruits cv. Aromas and in plants less than two months old. It showed variation in virulence, in affected plants it varied from 40 to 50%, in fruits it reached 100%.

Conclusion. The result determines that Pilidium concavum is a pathogen that produces brown leaf spot and brown rot in strawberry fruits. It allows new lines of research related to the impact of the disease on strawberry production, yield and quality in Mexico. This research is the first report of Pilidium concavum as a strawberry pathogen in the State of Mexico.

Show Figures and/or Tables
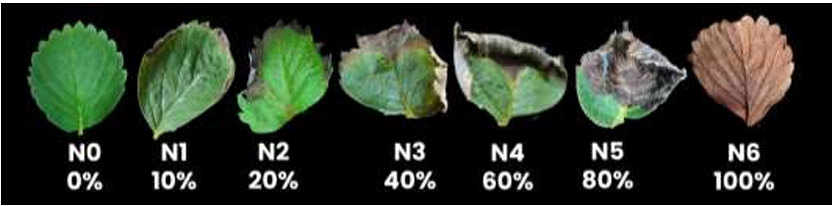
Figure 1. Visual scale for evaluating the severity of brown toasted leaf spot on strawberry. Designed by the authors.
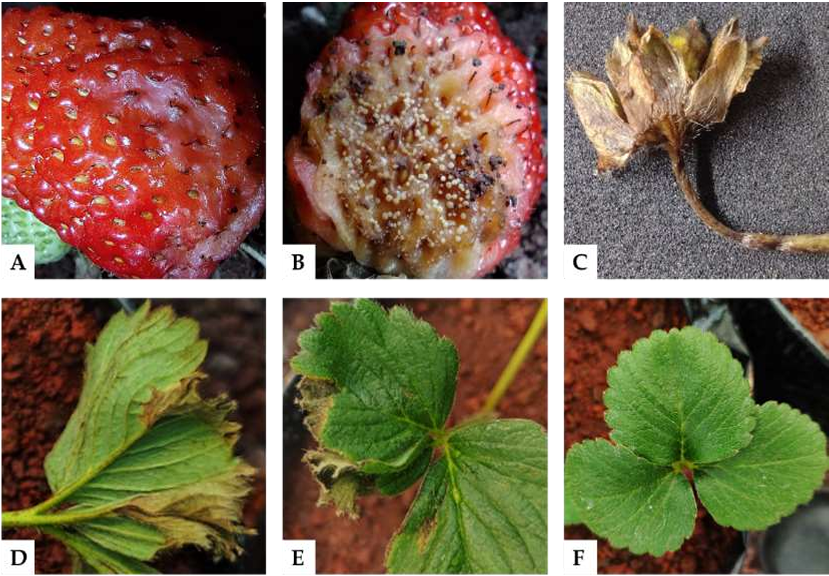
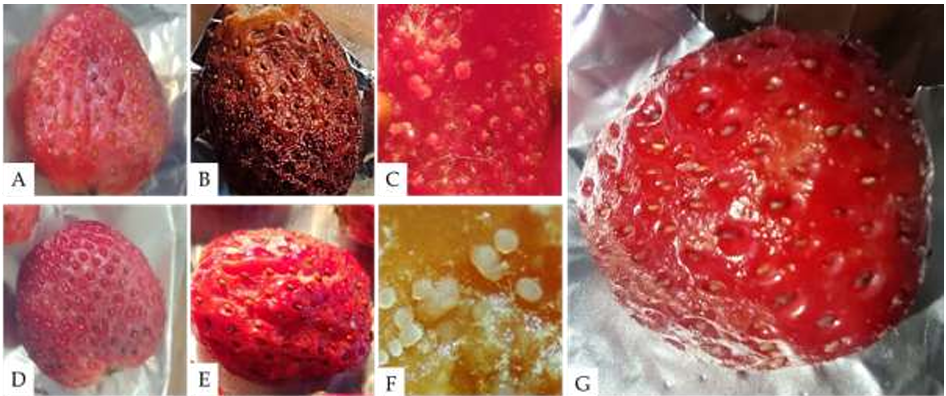
Figure 2. A) Fruit with sunken, wet lesions. B) Fruit with brown rot and fungal structures. C) Brown constriction on the flower peduncle. D-E) Leaves with toasted brown edges. F) Healthy leaves.
Figure 3. A) Sporodochia on strawberry fruit. B) Sporodochia on the underside of the leaf. C-D) Gelatinous colony with conidial mass on PDA medium. E-F) Longitudinal and transverse sections of the sporodochium. G) Hyaline, cylindrical, filiform conidiophores. H) Hyaline, aseptate, allantoid conidia.
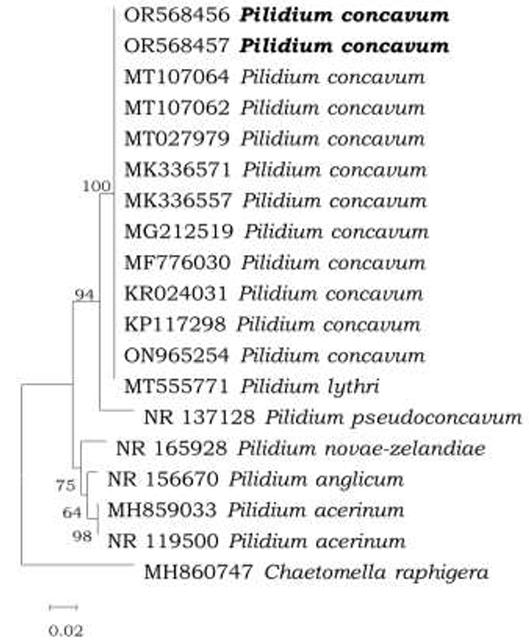
Figure 4. Phylogenetic tree based on Neighbor Joining of the ITS rDNA sequence, showing a phylogenetic affinity of the Mexico isolate (in bold) with <em>Pilidium concavum</em> above 95% of the node. Bar scaling 0.02 represents nucleotide substitutions per site.
Figure 4. Phylogenetic tree based on Neighbor Joining of the ITS rDNA sequence, showing a phylogenetic affinity of the Mexico isolate (in bold) with Pilidium concavum above 95% of the node. Bar scaling 0.02 represents nucleotide substitutions per site.
Figure 5. Pathogenicity tests on strawberry fruit inoculated with a concentration of 2×10<sup>6</sup> conidia mL<sup>−1</sup> of <em>Pilidium concavum</em>. A) Fruit with a wound inoculated with the fungus. B) Wounded fruit showing symptoms 72 hours post-inoculation (hpi). C) Sporodochia of the fungus on the wounded fruit. D) Unwounded fruit inoculated with the fungus. E) Unwounded fruit showing symptoms 96 hours post-inoculation. F) Sporodochia of the fungus on the unwounded fruit. G) Control inoculated with sterile distilled water, showing no symptoms at 96 hours post-inoculation.
Figure 5. Pathogenicity tests on strawberry fruit inoculated with a concentration of 2×10⁶ conidia mL−1 of Pilidium concavum. A) Fruit with a wound inoculated with the fungus. B) Wounded fruit showing symptoms 72 hours post-inoculation (hpi). C) Sporodochia of the fungus on the wounded fruit. D) Unwounded fruit inoculated with the fungus. E) Unwounded fruit showing symptoms 96 hours post-inoculation. F) Sporodochia of the fungus on the unwounded fruit. G) Control inoculated with sterile distilled water, showing no symptoms at 96 hours post-inoculation.
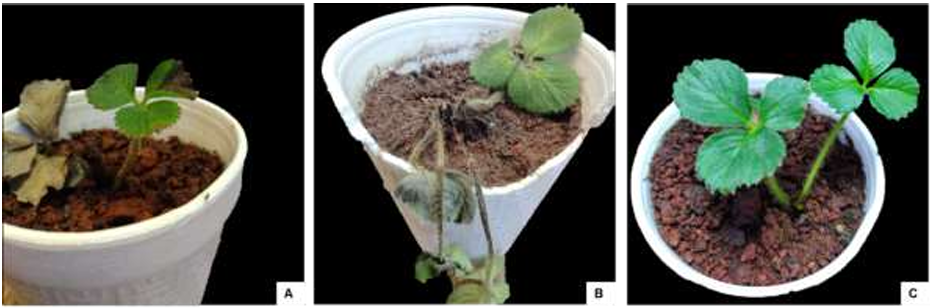
Figure 6. Strawberry plants (<em>Fragaria</em> x <em>ananassa</em>) cv. Aromas less than three months old, 15 days post-inoculation (dpi) with a suspension of 2x10<sup>6</sup> conidia per mL of <em>Pilidium concavum</em>. A) Inoculated via foliar; B) Inoculated via root routes; C) Control inoculated with sterile distilled water. 
Figure 6. Strawberry plants (Fragaria x ananassa) cv. Aromas less than three months old, 15 days post-inoculation (dpi) with a suspension of 2x10⁶ conidia per mL of Pilidium concavum. A) Inoculated via foliar; B) Inoculated via root routes; C) Control inoculated with sterile distilled water. 
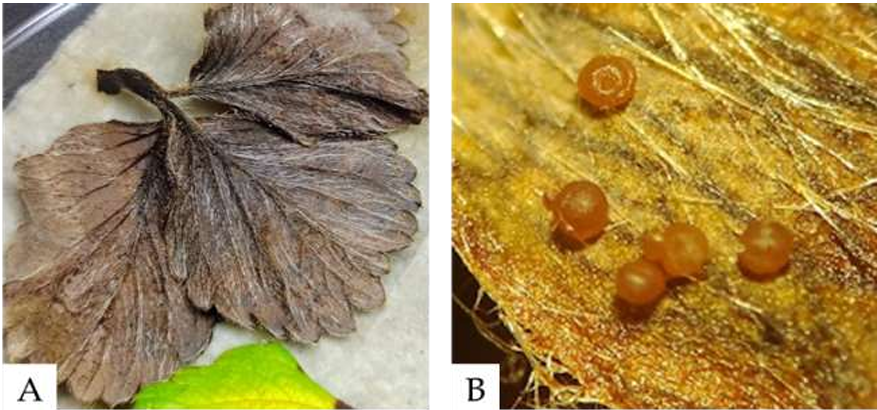
Figure 7. A) Asymptomatic strawberry leaves after 28 days post-inoculation (dpi), placed in a humid chamber. B) Formation of sporodochia on the leaves after 5 days in the humid chamber.

Page 9 of 16