RMF Logo

Article filters

Search Papers:

For searching before 2024 see Archive (2000-2023)
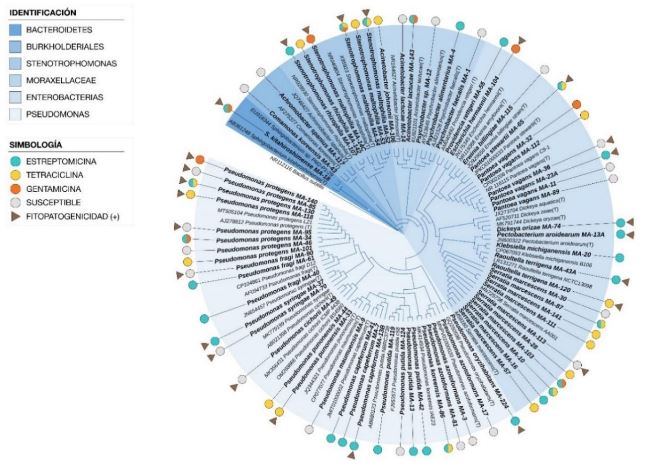
Diversity and antibiotic resistance in bacteria associated with symptoms of bacterial infection in Costa Rican crops. Figure 2 - Cladograma construido con el método del vecino más cercano a partir de 70 secuencias parciales del gen ARNr 16S de bacterias aisladas de lesiones en plantas y secuencias de cepas de referencia. Se evaluó la topología del árbol realizando 1 000 remuestreos y se utilizó la secuencia de <em>Bacillus</em> subtilis como grupo externo. Los símbolos en el exterior del árbol indican los aislamientos clasificados como resistentes a Estreptomicina, Tetraciclina y Gentamicina y sus combinaciones (círculos) y aquellos con Reacción hipersensible positiva (triángulos)Cladogram constructed using the nearest neighbor method from 70 partial sequences of the 16S rRNA gene of bacteria isolated from plant lesions and sequences of reference strains. The tree topology was assessed through 1,000 resamplings, with the sequence of <em>Bacillus</em> subtilis used as an outgroup. Symbols on the outer part of the tree indicate isolates classified as resistant to Streptomycin, Tetracycline, and Gentamicin, as well as their combinations (circles), and those with a positive Hypersensitive Reaction (triangles).

All the Articles

  • Vol. 2024, 42(1)
  • Phytopathological Note

Biostimulant effect of native Trichoderma strains on the germination of four varieties of basil

byJuanita Guadalupe Hollman Aragón, Mirella Romero Bastidas*, Pablo Misael Arce Amezquita, Alejandro Palacios Espinosa

Received: 15/March/2023 – Published: 19/December/2023
DOI: https://doi.org/10.18781/R.MEX.FIT.2303-1

Abstract Objective/antecedents. Trichoderma is an efficient tool as biostimulant in basil crop. However, only few species have been studied in specific cultivars. Therefore, the objective of this research was to evaluate the biostimulant efficacy of native Trichoderma strains on the germination and growth of four varieties of basil.

Materials and Methods. Seven strains of Trichoderma (T. asperellum, atroviride, viride, longibrachiatum, harzianum, koningii and Trichoderma sp.), a commercial Trichoderma (T. harzianum), synthetic fertilizer (T17) and the control were used in the study. 30 seeds of the Purple Ruffles, Lemon, Siam Queen and Nufar varieties were treated with a spore suspension of each Trichoderma. 48 h later, the seeds were sown and incubated at 28 °C with a 12 h light/dark photoperiod. The variables evaluated were; Rate and percentage of germination, biomass and length of seedlings.

Results. T. atroviride presented the greatest biostimulant effect on germination (95%). While T. asperellum registered an increased efficiency in biomass (≥ 0.120 g) and length (≥ 1.0 cm) of the plant in the four varieties. The action of commercial T. was lower in all cases.

Conclusion. This study demonstrated that the native strains of Trichoderma have a biostimulant effect on plants and are more effective than commercial species.

Show Figures and/or Tables
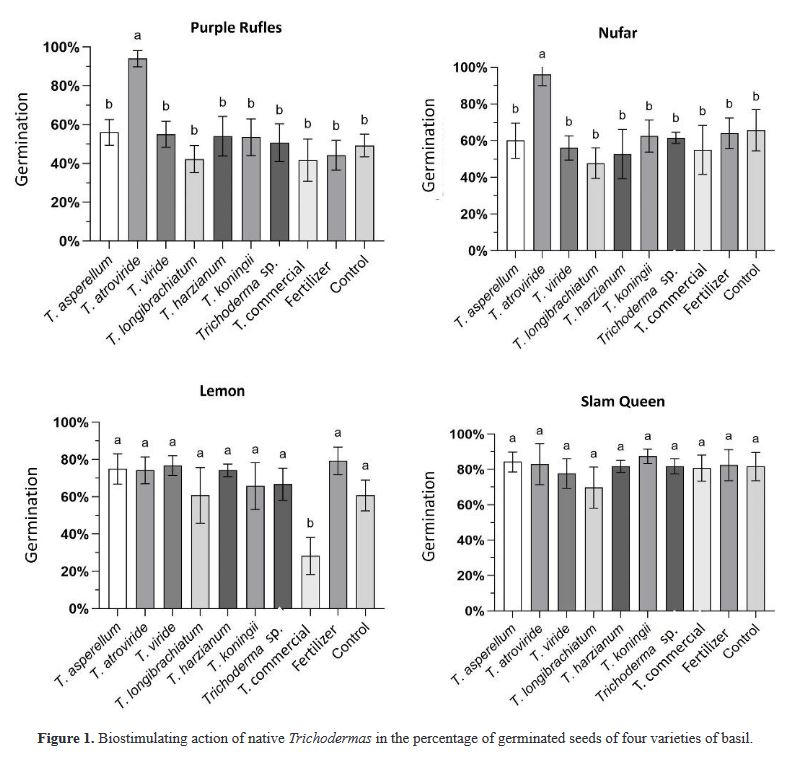
Figure 1. Biostimulating action of native <em>Trichoderma</em>s in the percentage of germinated seeds of four varieties of basil
Figure 1. Biostimulating action of native Trichodermas in the percentage of germinated seeds of four varieties of basil
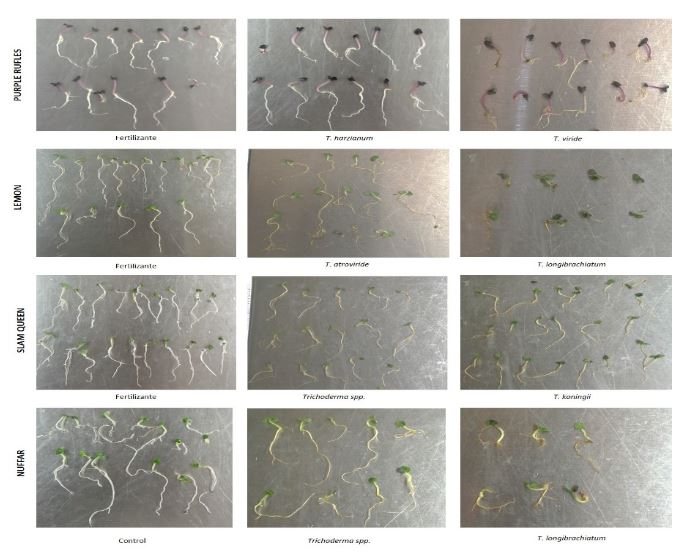
Figure 2. Main <em>Trichoderma</em> treatments with the highest positive (1st. and 2nd. photo from the left) or negative response (3rd. photo on the right) in the growth of four basil cultivars
Figure 2. Main Trichoderma treatments with the highest positive (1st. and 2nd. photo from the left) or negative response (3rd. photo on the right) in the growth of four basil cultivars
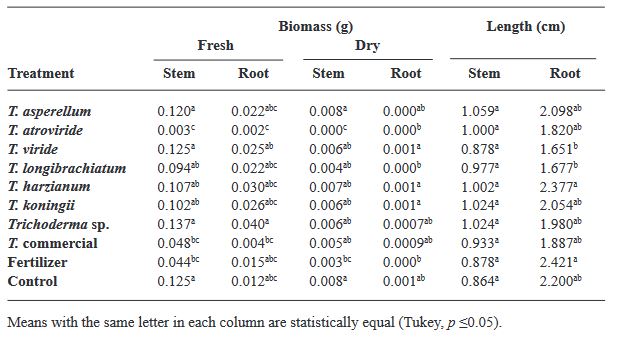
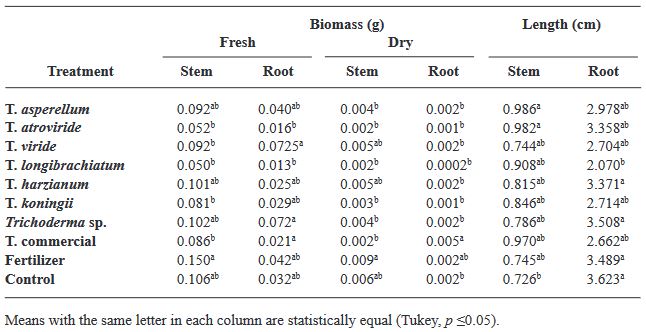
Table 1. Morphometric parameters of basil Var. Purple Ruffles seedlings against the effect of different <em>Trichoderma</em> isolates
Table 1. Morphometric parameters of basil Var. Purple Ruffles seedlings against the effect of different Trichoderma isolates
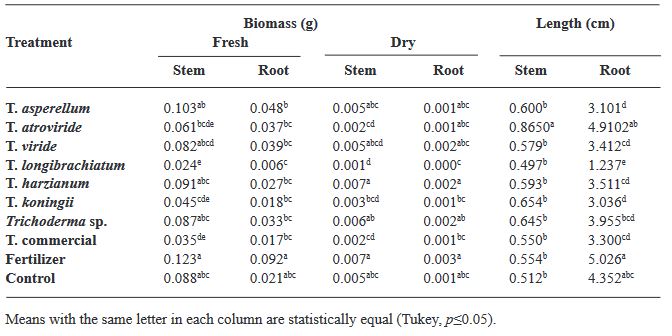
Table 2. Morphometric parameters of basil Var. Lemon against the effect of different <em>Trichoderma</em> isolates.
Table 2. Morphometric parameters of basil Var. Lemon against the effect of different Trichoderma isolates.
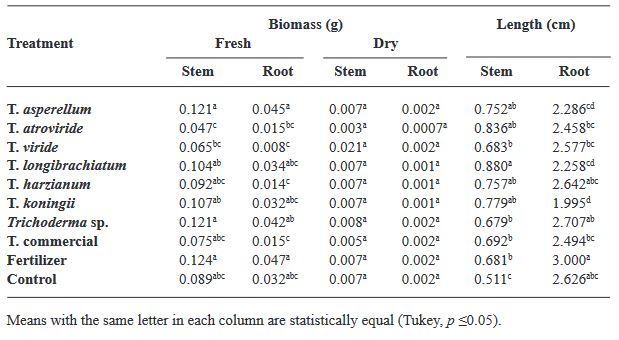
Table 3. Morphometric parameters of basil Var. Siam Queen against the effect of different <em>Trichoderma</em> isolates
Table 3. Morphometric parameters of basil Var. Siam Queen against the effect of different Trichoderma isolates
Table 4. Morphometric parameters of basil Var. Nufar against the effect of different <em>Trichoderma</em> isolates
Table 4. Morphometric parameters of basil Var. Nufar against the effect of different Trichoderma isolates
  • Vol. 2024, 42(1)
  • Review Article

Current situation of viticulture in Costa Rica and management strategies for downy mildew (Plasmopara viticola)

byDaniel Castrillo Sequeira, Rodrigo Jiménez Robles, Milagro Granados Montero*

Received: 18/September/2023 – Published: 27/December/2023
DOI: https://doi.org/10.18781/R.MEX.FIT.2309-3

Abstract Viticulture is one of the oldest agricultural activities, and its exploitation has traditionally been limited to temperate climate zones, where the european grapevine (Vitis vinifera) and wine originate. Given the effects of climate change, more areas lose the capacity to grow this crop, and the tropics are presented as potential regions for this market. In Costa Rica, viticultural activity has been reported since the mid20th century, however, technical information on the crop is scarce. Downy mildew, caused by the oomycete Plasmopara viticola, represents one of the diseases with the greatest economic impact for viticulture worldwide, as well as the most limiting phytosanitary problem in Costa Rica. Under high humidity conditions, the development of the pathogen is accelerated, and the host remains susceptible throughout the crop cycle, which makes proper management of epidemics difficult. Chemical control is the most common management strategy around the world, however, the appearance of P. viticola populations with resistance to fungicides has been observed in most grape vine-growing areas, hence the search for more ecological alternatives is a necessity. Currently, Costa Rica does not have integrated management strategies that allow sustainable production, and there is only one registered product for protection against this pathogen. This situation justifies paying more attention to the investigation of this pathosystem

Show Figures and/or Tables
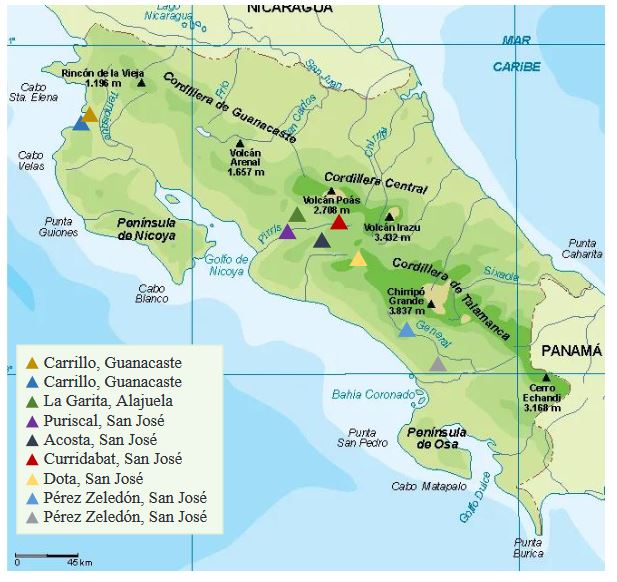
Figure 1. Location of the main grapevine plantations in Costa Rica
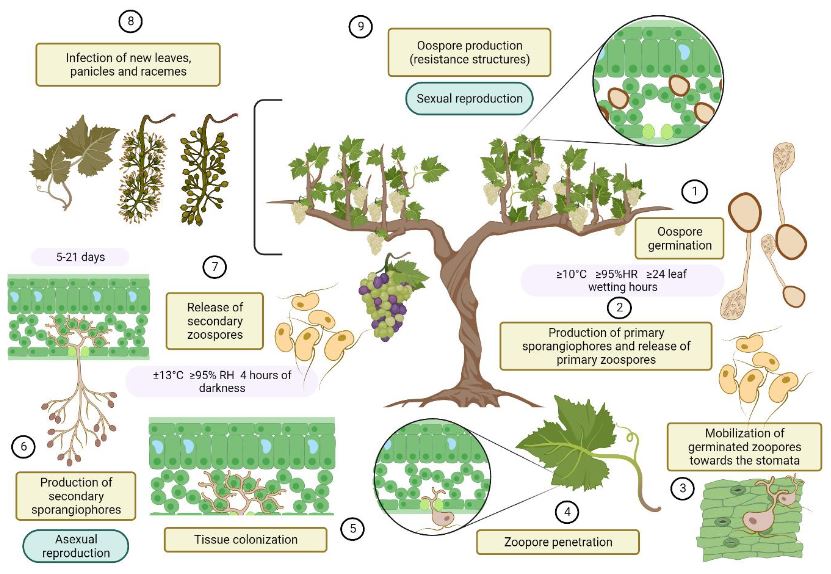
Figure 2. Life cycle of the <em>Plasmopara viticola</em> in the grapevine (<em>Vitis vinifera</em>)
Figure 2. Life cycle of the Plasmopara viticola in the grapevine (Vitis vinifera)
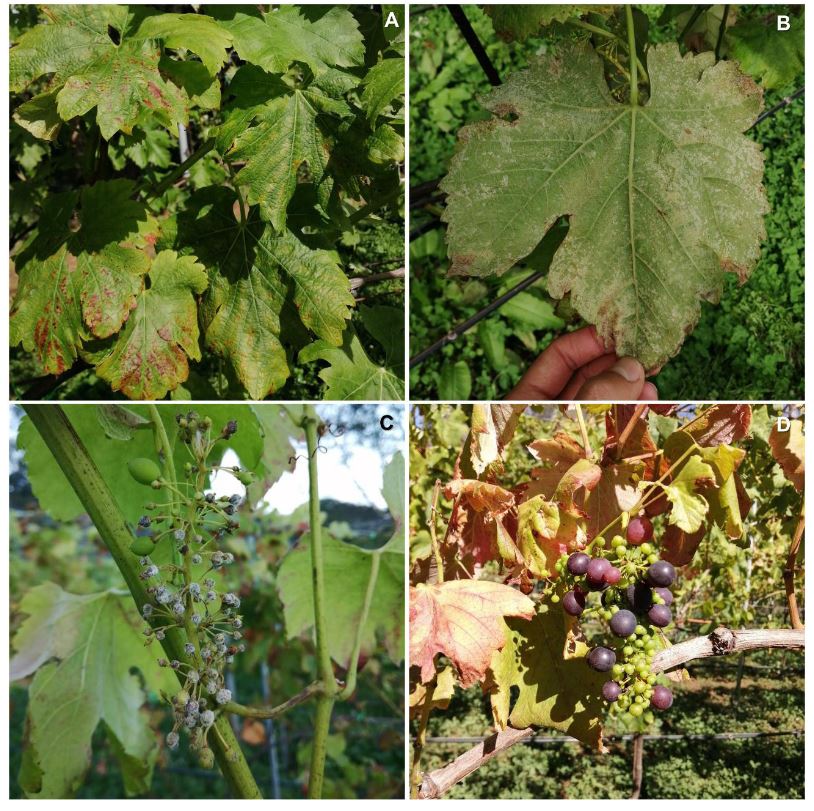
Figure 3. Symptoms and characteristic signs of downy mildew in the grapevine (<em>Vitis vinifera</em>), caused by the oomycete <em>Plasmopara viticola</em>. A. Chlorosis and foliar necrosis. B. Sporulation on the reverse of leaves with necrotic lesions. C. Sporulation on young fruits. D. Leaf necrosis and poor filling of fruits
Figure 3. Symptoms and characteristic signs of downy mildew in the grapevine (Vitis vinifera), caused by the oomycete Plasmopara viticola. A. Chlorosis and foliar necrosis. B. Sporulation on the reverse of leaves with necrotic lesions. C. Sporulation on young fruits. D. Leaf necrosis and poor filling of fruits
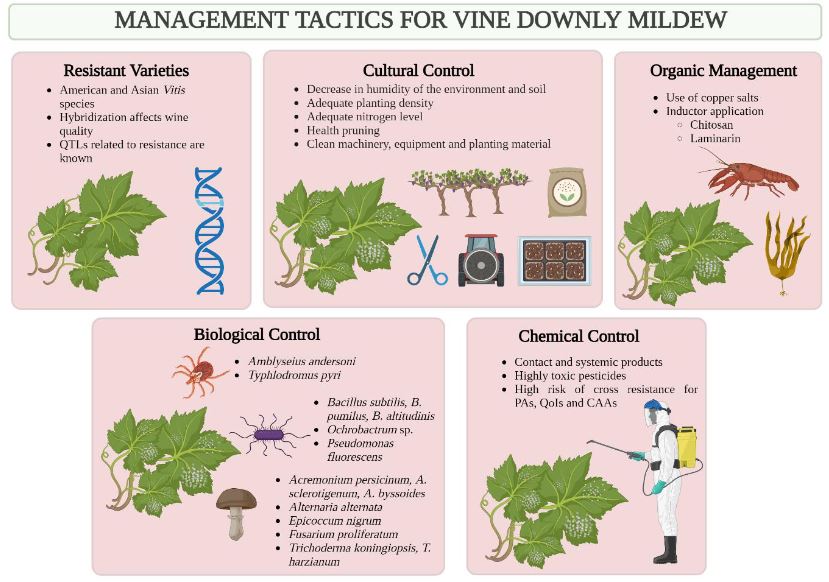
Figure 4. Tactics (advantages and disadvantages) documented for the management of downy mildew in the vine (<em>Vitis vinifera</em>), caused by the oomycete <em>Plasmopara viticola</em>.
Figure 4. Tactics (advantages and disadvantages) documented for the management of downy mildew in the vine (Vitis vinifera), caused by the oomycete Plasmopara viticola.
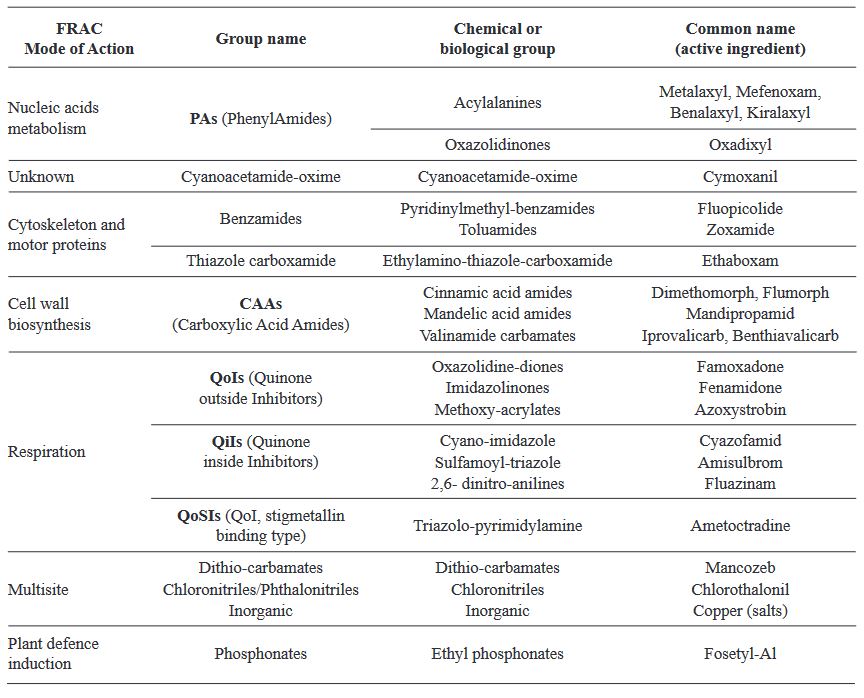
Table 1. List of active ingredients available for oomycete control, divided according to the FRAC mode of action and chemical group, modified from Hollomon (2015)
  • Vol. 2024, 42(1)
  • Scientific Article

Induction of defense response mediated by inulin from dahlia tubers (Dahlia sp.) in Capsicum annuum

byJulio César López Velázquez, Soledad García Morales, Joaquín Alejandro Qui Zapata*, Zaira Yunuen García Carvajal, Diego Eloyr Navarro López, Rebeca García Varela

Received: 10/May/2023 – Published: 29/December/2023
DOI: https://doi.org/10.18781/R.MEX.FIT.2305-2

Abstract Background/Objective. Phytophthora capsici is the causal agent of chili wilt. Among the strategies for its control is the use of resistance inducers. Fructans are molecules with interesting biological properties, including the ability to induce resistance mechanisms in some plants. In this work, the protective effect of four concentrations inulin from dahlia tubers on chili infected with P. capsici was evaluated.

Materials and Methods. The concentration that showed the highest protection was chosen to evaluate the induction of defense response through the enzymatic activity of β-1,3 glucanases, peroxidases and the production of total phenolic compounds.

Results. Inulin showed a protective effect against infection at concentrations of 100 to 300 μM, as symptoms decreased and seedlings showed improved vegetative development. It was observed that inulin at 200 μM concentration was able to induce an effective defense response associated with increased activity of β-1,3 glucanases and peroxidases through a local and systemic response in seedlings. This response was differentiated between seedlings treated with inulin and seedlings infected with P. capsici.

Conclusion. It was concluded that inulin has the ability to protect chili bell pepper from P. capsici by induction of resistance.

Show Figures and/or Tables
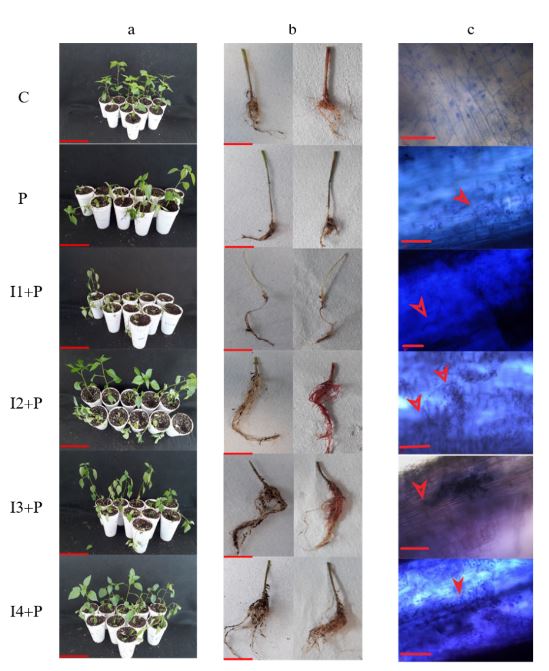
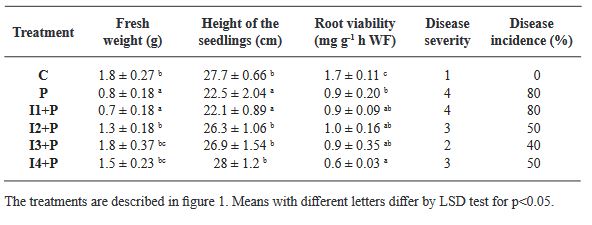
Figure 1. Evaluation of dahlia inulin in the protection of <em>P. capsici</em> infection in chili seedlings. a: Biological effectiveness test of dahlia inulin in chili seedlings, bar equivalent to 10 cm; b: Root damage, bar equivalent to 5 cm; c: Presence of the oomycete in chili roots, bar equivalent to 20 μm, arrows indicate oomycete presence. Treatments as follows: C: Control seedlings, treated with only sterile distilled water; P: Seedlings inoculated with <em>P. capsici</em>; I1+P: Seedlings inoculated with <em>P. capsici</em> and treated with 20 μM of inulin; I2+P: Seedlings inoculated with <em>P. capsici</em> and treated with 100 μM of inulin; I3+P: Seedlings inoculated with <em>P. capsici</em> and treated with 200 μM of inulin; I4+P: Seedlings inoculated with <em>P. capsici</em> and treated with 300 μM of inulin
Figure 1. Evaluation of dahlia inulin in the protection of P. capsici infection in chili seedlings. a: Biological effectiveness test of dahlia inulin in chili seedlings, bar equivalent to 10 cm; b: Root damage, bar equivalent to 5 cm; c: Presence of the oomycete in chili roots, bar equivalent to 20 μm, arrows indicate oomycete presence. Treatments as follows: C: Control seedlings, treated with only sterile distilled water; P: Seedlings inoculated with P. capsici; I1+P: Seedlings inoculated with P. capsici and treated with 20 μM of inulin; I2+P: Seedlings inoculated with P. capsici and treated with 100 μM of inulin; I3+P: Seedlings inoculated with P. capsici and treated with 200 μM of inulin; I4+P: Seedlings inoculated with P. capsici and treated with 300 μM of inulin
Figure 2. Evaluation of β-1,3 glucanase activity in roots (a) and leaves (b) of chili seedlings treated with dahlia inulin and inoculated with <em>P. capsici</em>. C: Control seedlings, treated with sterile distilled water; P: Seedlings inoculated with <em>P. capsici</em>; I: Seedlings treated with 200 μM of inulin; IP: Seedlings inoculated with <em>P. capsici</em> and treated with 200 μM of inulin. The vertical lines represent the standard deviation. Asterisks represent significant differences with respect to the control
Figure 2. Evaluation of β-1,3 glucanase activity in roots (a) and leaves (b) of chili seedlings treated with dahlia inulin and inoculated with P. capsici. C: Control seedlings, treated with sterile distilled water; P: Seedlings inoculated with P. capsici; I: Seedlings treated with 200 μM of inulin; IP: Seedlings inoculated with P. capsici and treated with 200 μM of inulin. The vertical lines represent the standard deviation. Asterisks represent significant differences with respect to the control
Figure 3. Evaluation of peroxidase activity in roots (a) and leaves (b) of chili seedlings. The treatments are described in figure 2. The vertical lines represent the standard deviation. Asterisks represent significant differences with respect to the control
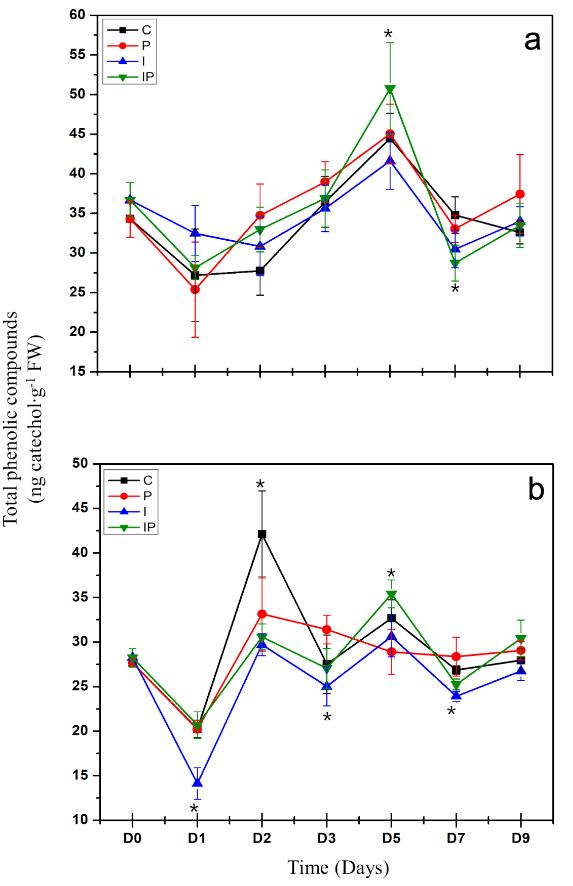
Figure 4. Quantification of total phenolic compounds in roots (a) and leaves (b) of chili seedlings. The treatments are described in Figure 2. The vertical lines represent the standard deviation. Asterisks represent significant differences with respect to the control
Table 1. Growth parameters and protection induced by dahlia inulin in chili seedlings.
  • Vol. 2024, 42(1)
  • Scientific Article

Establishment of an efficient protocol for in vitro disinfection of seeds of seven Agave spp. species

byMaría Guadalupe Aguilar Rito, Amaury Martín Arzate Fernández*, Hilda Guadalupe García Núñez, Tomas Héctor Norman Mondragón

Received: 02/October/2023 – Published: 20/December/2023
DOI: https://doi.org/10.18781/R.MEX.FIT.2310-1

Abstract Background. Disinfection of Agave seeds is a crucial step in in vitro culture to prevent contamination, which can be caused by microorganisms such as bacteria, fungi and viruses that can affect seedling growth and reduce seed germination rate. Therefore, proper seed disinfection is essential to ensure vigorous and healthy plant growth. Objective. Generate an efficient seed disinfection protocol in seven species of Agave; Agave marmorata, A. karwinskii, A. potatorum, A. angustifolia, A. cupreata, A. horrida and A. salmiana to reduce pollution levels.

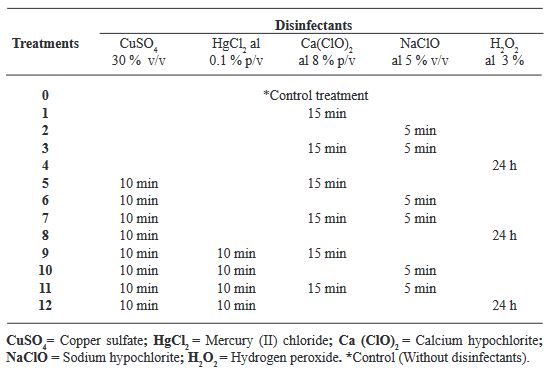
Materials and Methods. A total of 12 disinfection treatments with disinfectants and different combinations were evaluated. The disinfectants used were; 3 % Hydrogen Peroxide for 24 h, Commercial Sodium Hypochlorite 5 % (v/v) for 5 min, Calcium Hypochlorite 8 % (w/v) for 15 min, Copper Sulfate 30 % (v/v) for 10 min, Mercury Chloride II 0.1 % (w/v) for 10 min. Before each treatment was tested, the seeds were pre-washed with liquid soap and subjected to the treatments, Subsequently, they were sown in DM medium and the percentage of germination and contamination for each treatment was evaluated weekly for a period of 30 days. Additionally, the contaminating microorganisms found were identified.

Results. The best treatment for seed disinfection was 30 % copper sulfate (v/v) for 10 min, 0.1 % mercuric chloride II for 10 min and 3 % hydrogen peroxide for 24 h, obtaining 100 % disinfection. Four genera of fungi were identified: Monilinia sp., Aspergillus sp., Penicillium sp., and Alternaria alternata, a bacterium; Bacillus sp., and a yeast, Schizosaccharomyces sp.

Show Figures and/or Tables
Figure 1. A. salmiana seed germination. A) root emergence and elongation. (14 dap) B) Elongation of the plumule. (21 dap) C) Diferenciation of the root cotyledons and development. (30 dap) D) Full germination and development. (14-30 dap) E) Normal, completely developed A. salmiana seedlings. (50 dap); dap days after planting
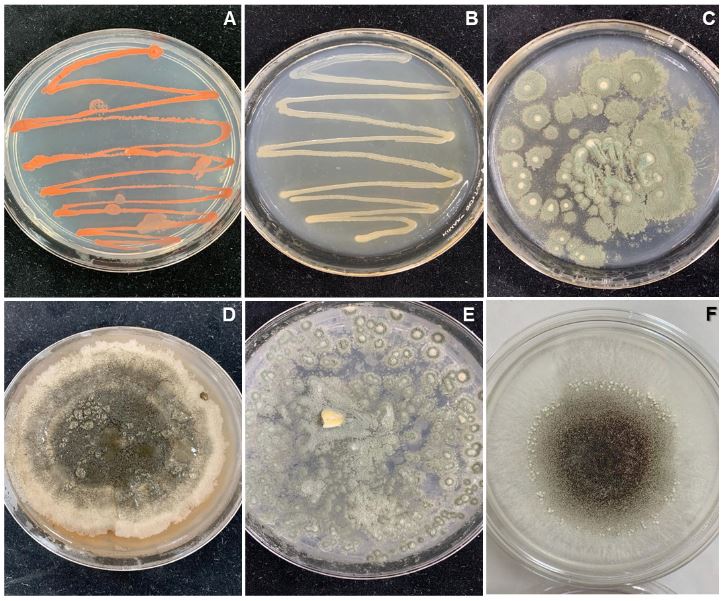
Figure 2. Bacterial and fungal strains found in the seeds of Agave spp. A) <em>Schizosaccharomyces sp.</em> B) <em>Bacillus</em> sp. C) Penicilllium sp. D) <em>Alternaria alternata</em>. E) <em>Aspergillus sp.</em> F) <em>Monilinia sp.</em>
Figure 2. Bacterial and fungal strains found in the seeds of Agave spp. A) Schizosaccharomyces sp. B) Bacillus sp. C) Penicilllium sp. D) Alternaria alternata. E) Aspergillus sp. F) Monilinia sp.
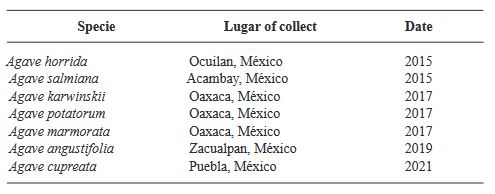
Table 1. Agave species and seed collection data
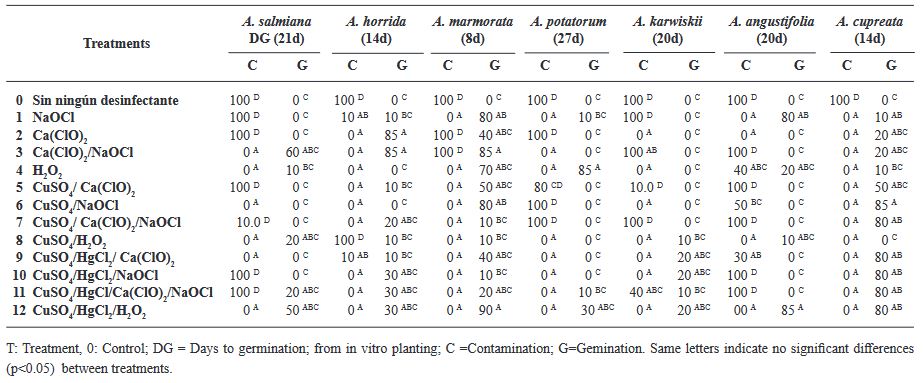
Table 2. Disinfection treatments evaluated in seven Agave species
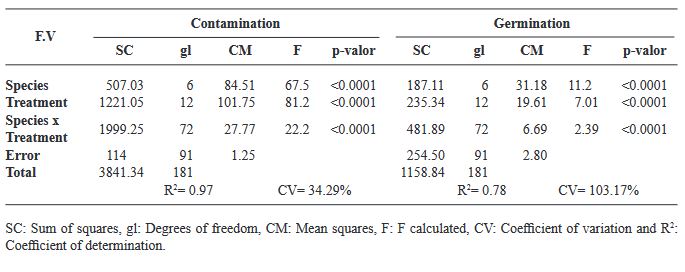
Table 3. Analysis of variance for the variables contamination and germination, evaluating 12 disinfection treatments and seven agave species.
Table 4. Analysis of variance for the variables contamination and germination, evaluatinMeans comparison for the variables contamination and germination in seven agave species, according to Tukey’s test (p<0.05).g 12 disinfection treatments and seven agave species.
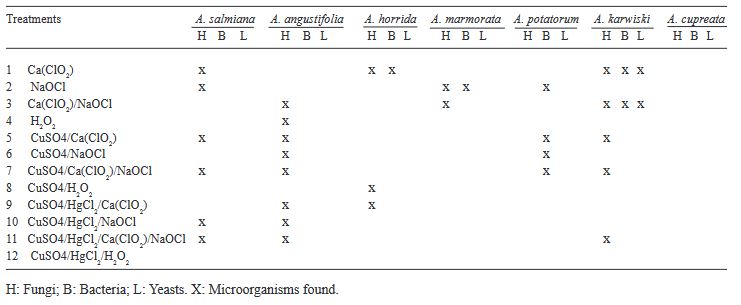
Table 5. Contaminant microorganisms found in the Agave seeds after applying the treamtnets
  • Vol. 2024, 42(1)
  • Scientific Article

Bacillus sp. A8a reduces leaf wilting by Phytophthora and modifies tannin accumulation in avocado

byEdgar Guevara Avendaño, Itzel Anayansi Solís García, Alfonso Méndez Bravo, Fernando Pineda García, Guillermo Angeles Alvarez, Carolina Madero Vega, Sylvia P Fernández Pavía, Alejandra Mondragón Flores, Frédérique Reverchon*

Received: 17/September/2023 – Published: 08/December/2023
DOI: https://doi.org/10.18781/R.MEX.FIT.2309-2

Abstract Background/Objective. The objective was to assess the biocontrol capacity of Bacillus sp. A8a in avocado (Persea americana) plants infected by Phytophthora cinnamomi.

Materials and Methods. A greenhouse experiment was implemented with four treatments: 1) control plants; 2) plants infected with P. cinnamomi; 3) plants inoculated with Bacillus sp. A8a; 4) plants infected with P. cinnamomi and inoculated with Bacillus sp. A8a. We evaluated several morpho physiological variables during the experiment, which lasted 25 days after infection (dai). Moreover, we analyzed tannin density in stems at 25 dai to determine the plant defense response against the disease.

Results. Inoculation with strain A8a reduced wilting symptoms by 49 % at 25 dai, compared with non-inoculated plants. No differences were detected in morpho physiological variables between treatments. However, a greater tannin accumulation was registered in the xylem of infected plants, whilst plants inoculated with strain A8a displayed a larger tannin density in the cortex.

Conclusion. Our results confirm the biocontrol activity of Bacillus sp. A8a in avocado plants and suggest that tannin differential accumulation in the cortex of plants inoculated with the bacteria may contribute to the enhanced tolerance of avocado plants against Phytophthora root rot.

Show Figures and/or Tables
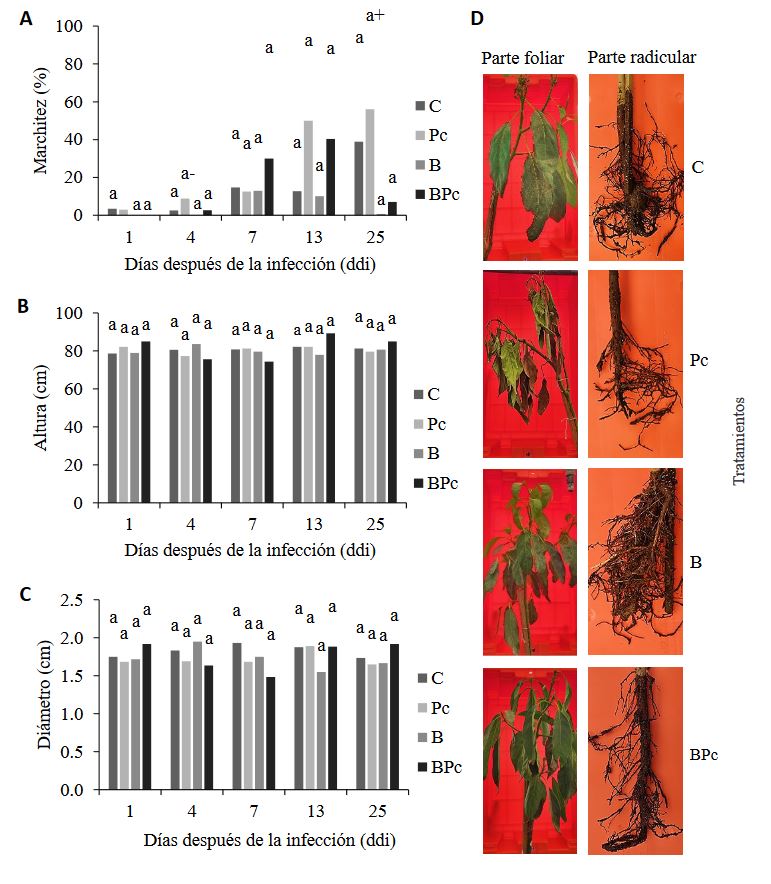
Figure 1. Effect of the inoculation of <em>Bacillus</em> sp. A8a and <em>P. cinnamomi</em> in avocado trees at 1, 4, 7, 13 and 25 dai (days after infection). A) Percentage of wilting caused by <em>P. cinnamomi</em>; B) tree height (cm); C) stem diameter (cm). Bars show the average of the data (n = 6, treatments C and Pc; n = 3, treatments B and BPc) ± s.d. Different letters indicate significant differences (two-way ANOVA, P ≤ 0.05). In Figure 1A, (+) indicates significant differences between times, compared with (-), for the Pc treatment (ANOVA, P ≤ 0.05). D) Representative photographs of the aerial parts and root systems of avocado trees at 25 dai, in the four treatments. C: control; Pc: infected with <em>P. cinnamomi</em>; B: inoculated with <em>Bacillus</em> sp. A8a; BPc: infected with <em>P. cinnamomi</em> and inoculated with <em>Bacillus</em> sp. A8a.
Figure 1. Effect of the inoculation of Bacillus sp. A8a and P. cinnamomi in avocado trees at 1, 4, 7, 13 and 25 dai (days after infection). A) Percentage of wilting caused by P. cinnamomi; B) tree height (cm); C) stem diameter (cm). Bars show the average of the data (n = 6, treatments C and Pc; n = 3, treatments B and BPc) ± s.d. Different letters indicate significant differences (two-way ANOVA, P ≤ 0.05). In Figure 1A, (+) indicates significant differences between times, compared with (-), for the Pc treatment (ANOVA, P ≤ 0.05). D) Representative photographs of the aerial parts and root systems of avocado trees at 25 dai, in the four treatments. C: control; Pc: infected with P. cinnamomi; B: inoculated with Bacillus sp. A8a; BPc: infected with P. cinnamomi and inoculated with Bacillus sp. A8a.
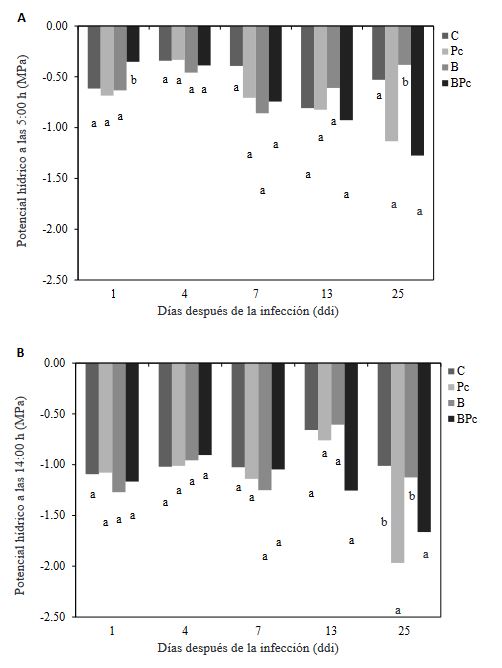
Figure 2. Leaf water potential in avocado trees at 1, 4, 7, 13 and 25 dai. A) Leaf water potential (MPa) at 5:00 am; B) foliar water potential at 14:00 pm. Bars show the average of the data (n = 3 ± s.d.). Different letters indicate significant differences between treatments at the same time. The water potential measured at 1, 4 and 25 dai was analyzed with a oneway ANOVA and Tukey’s test (P ≤ 0.05). Non-parametric data recorded at 7 y 13 dai were analyzed with KruskalWallis and Wilcoxon rank sum tests ( P ≤ 0.05).
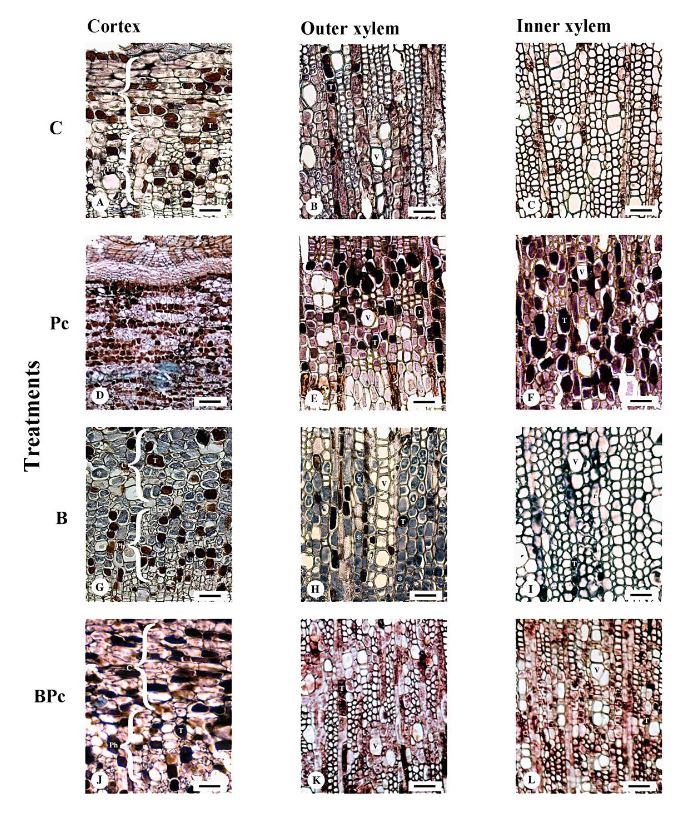
Figure 3. Tannin accumulation in crosssections of the cortex (C), outer xylem and inner xylem of avocado stems from the four treatments at 25 dai. A – C: Control treatment. A. A few tanniniferous cells (T) are observed interspersed in the tissue. B. Tanniniferous cells (T) are observed in the ray parenchyma. Vessels (V) and rays (r) are indicated. C. A few tanniniferous cells (T) are observed in the axial parenchyma and in some radial parenchyma (r). Ph = secondary phloem. Scale: A - C. 30 μm. Figures D – F: treatment Pc. D. Abundant tanniniferous cells (T) are observed. E. Tanniniferous cells (T) are in the radial as well as in the axial parenchyma. V = vessels. F. Tanniniferous cells (T) are mostly concentrated in the radial cells. Scale: D. 60 μm. E and F. 30 μm. Figures G – I: treatment B. G. Cross-section through the secondary phloem (Ph) and cortex (C). Some tanniniferous cells are interspersed amid parenchyma cells full with starch (asterisks). H. A long radial chain of vessels (V) can be observed in the center of the image. Only a few tanniniferous cells (T) are observed in the radial parenchyma. I. Tanniniferous cells (T) are even scarcer than in the outer xylem. Scale: G. 25 μm. H and I. 30 μm. Figures J – L: treatment BPc. J. Tanniniferous cells (T) are observed. K. Grouped or solitary vessels (V) and some tanniniferous cells (T) are observed in the radial parenchyma. L. Few tanniniferous cells (T) are observed in the axial parenchyma. Vessels (V) are grouped in radial chains or in groups of four. Scale: J - L. 35 μm.
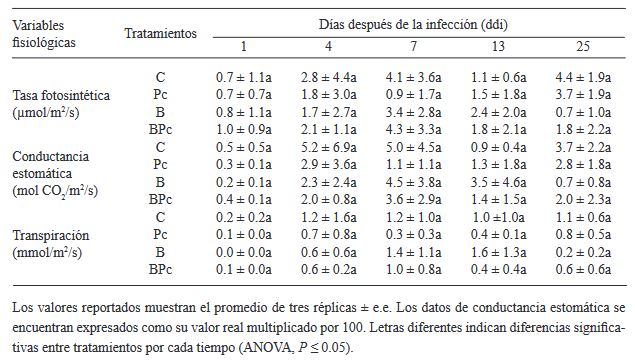
Table 1. Photosynthetic rate, stomatal conductance and transpiration in avocado trees infected with <em>P. cinnamomi</em> and inoculated with <em>Bacillus</em> sp. A8a
Table 1. Photosynthetic rate, stomatal conductance and transpiration in avocado trees infected with P. cinnamomi and inoculated with Bacillus sp. A8a
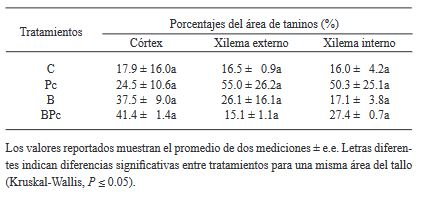
Table 2. Percentage of the area occupied by tanniniferous cells at 25 dai in differ ent stem sections of avocado trees infected by <em>P. cinnamomi</em> and inocu lated with <em>Bacillus</em> sp. A8a.
Table 2. Percentage of the area occupied by tanniniferous cells at 25 dai in differ ent stem sections of avocado trees infected by P. cinnamomi and inocu lated with Bacillus sp. A8a.
  • Vol. 2024, 42(2)
  • Phytopathological Note

Characterization of endophytic bacteria growth-promoting in potato plants (Solanum tuberosum)

byRosa María Longoria Espinoza*, Cristal Leyva Ruiz, Gloria Margarita Zamudio Aguilasocho, Rubén Félix Gastélum

Received: 02/October/2023 – Published: 23/January/2024
DOI: https://doi.org/10.18781/R.MEX.FIT.2310-4

Abstract Background/Objective. The purpose of this research was to evaluate the in vitro plant growth-promoting activity of endophytic bacteria isolated in tissue from Atlantic variety potato plants from the municipality of Guasave, Sinaloa, Mexico.

Materials and Methods. The bacterial population was isolated in Lb agar culture medium; two bacterial isolates were obtained from the root and two from the stem, all four Gram positive. The bacterial population of the tissue samples was expressed as (CFU/g-1). The phosphate solubilization capacity, production of chitinases and siderophores were qualitatively evaluated.

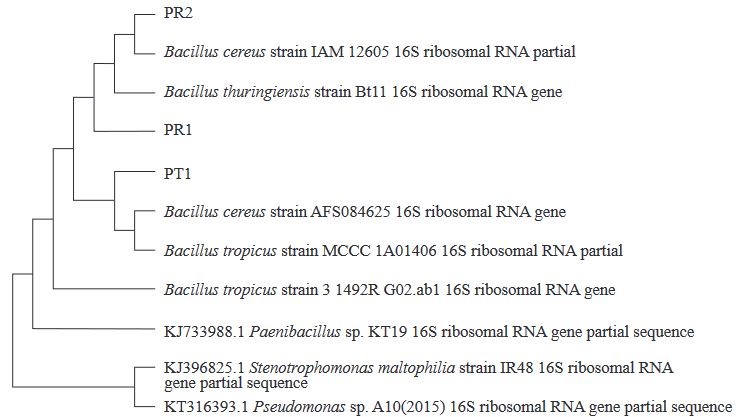
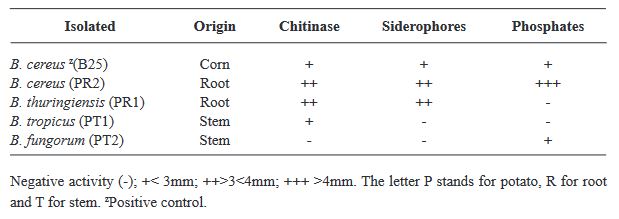
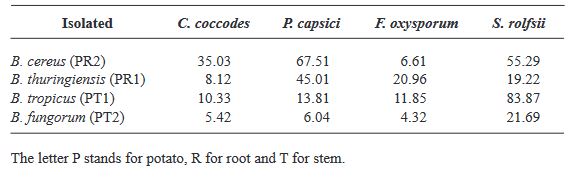
Results. Partial sequencing of the 16S rDNA gene was performed, allowing the identification of associated bacterial species within the Firmicutes. 100% of the strains were identified as Bacillus sp. with identities greater than 97%: B. cereus, B. tropicus, B. thuringiensis, B. fungorum. The B. thuringiensis and B. cereus strains showed positive activity in promoting plant growth in vitro through phosphate solubilization, production of chitinases and siderophores. B. cereus and B. tropicus presented inhibitory capacity greater than 50% for Sclerothium rolfsii.

Conclusion. It is relevant to continue research carried out in the laboratory, in order to determine its potential in the field, improving the production of potato crops.

Show Figures and/or Tables
Figure 1. Neighbor-Joining Dendogram from the sequences of the gene that codifies the 16S subunit of the rDNA of endophytic bacteria.
Table 1. Related characteristics in promoting plant growth <em>in vitro</em> of bacteria isolated from tissue (root, stem) in potato plants collected in plots of Ejido El Gallo, Municipality of Guasave, Sinaloa, Mexico.
Table 1. Related characteristics in promoting plant growth in vitro of bacteria isolated from tissue (root, stem) in potato plants collected in plots of Ejido El Gallo, Municipality of Guasave, Sinaloa, Mexico.
Table 2. Antagonistic activity against phytopathogenic fungi represented in percentage; of bacteria isolated from tissue (root, stem) in potato plant collected in plots of Ejido El Gallo, Municipality of Guasave, Sinaloa, Mexico.
  • Vol. 2024, 42(2)
  • Scientific Article

Morphological characterization, phylogeny and pathogenesis of Setophoma terrestris causing corky and pink roots of tomato (Solanum lycopersicum) in Sinaloa, Mexico

byAna María López López, Juan Manuel Tovar Pedraza, Josefina León Félix, Raúl Allende Molar, Nelson Bernardi Lima, Isidro Márquez Zequera, Raymundo Saúl García Estrada*

Received: 27/September/2023 – Published: 13/February/2024
DOI: https://doi.org/10.18781/R.MEX.FIT.2309-5

Abstract Background/Objective. Tomato (Solanum lycopersicum) is one of Mexico’s main crops. In the years 2017 and 2018, symptoms of corky and pink roots were observed with an incidence of 10 to 20% in Culiacan, Sinaloa, Mexico. In the foliage, plants presented a generalized chlorosis, with stunted growth and senescence in the leaves. In the roots, brown and pink lesions were formed, as well as a corky texture. The objective of this study was to morphologically and molecularly characterize fungal isolates associated to corky and pink root in tomato orchards in Culiacan, Sinaloa, as well as to evaluate their pathogenicity.

Materials and Methods. Monoconidial isolates were obtained and they were identified as Setophoma terrestris, based on their morphological characteristics. To confirm the identity, the area of the internal transcribed spacers (ITS) of the rDNA was amplified and sequenced, along with a fragment of the gene 28S of the rRNA (LSU).

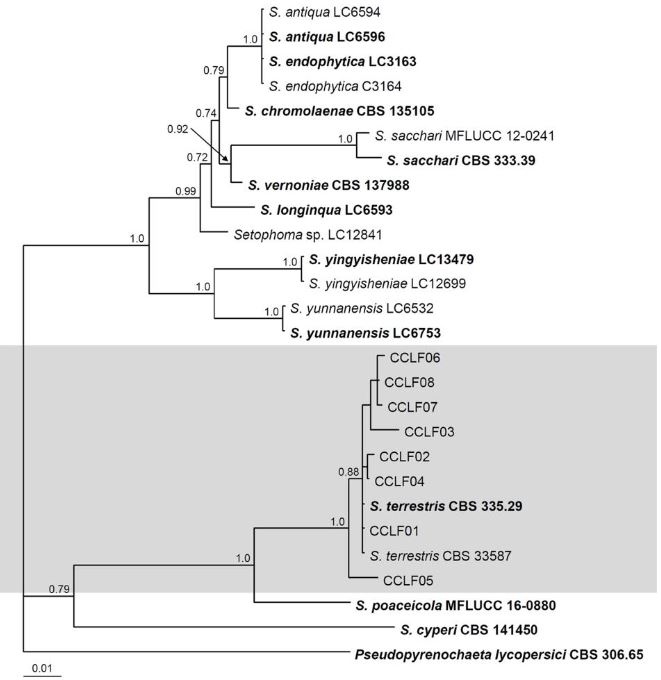
Results. Using the sequences obtained, a phylogenetic tree was created using the Bayesian Inference and it was found that the sequences were grouped with the ex–type sequences of Setophoma terrestris. The pathogenicity of the isolates was verified by inoculating mycelial discs into the root of 10 one-month-old tomato seedlings. The roots of the seedlings inoculated with PDA discs without mycelium served as a control. Thirty days after inoculation, corky and pink root symptoms appeared, whereas the roots of control plants remained healthy

Conclusion. According to the morphological characterization, the molecular identification and the pathogenicity tests, Setophoma terrestris was confirmed to be the causal agent of corky and pink root in agricultural tomato orchards in Culiacan, Sinaloa.

Show Figures and/or Tables
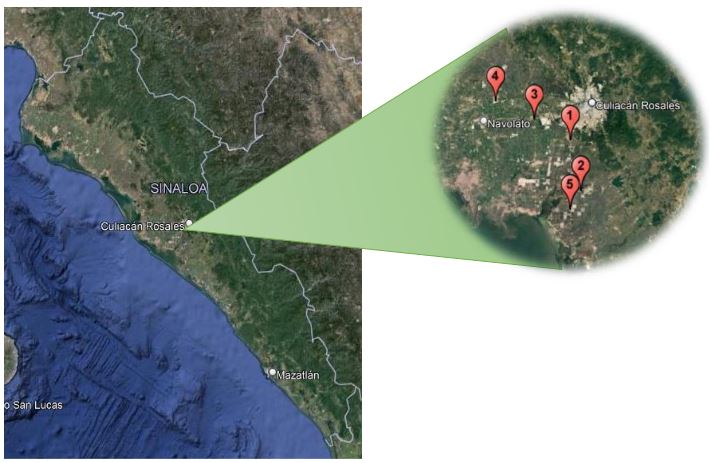
Figure 1. Location of the sites of recollection of plants with corky root symptoms in agricultural systems with tomato production in the valley of Culiacan, Sinaloa. Site 1 (24°42’56.58”N, 107°26’42.86”W), Site 2 (24°35’21.67”N, 107°24’56.50”W), Site 3 (24°46’2.77”N, 107°32’51.30”W), Site 4 (24°48’47.44”N, 107°39’26.19”W) and Site 5 24°32’34.07”N, 107°26’44.93”W)
Figure 2. Symptoms of corky and pink roots in tomato. A–C) Chlorosis, deficient growth and senescence in plants. D–F) Dark brown lesions on the root, with swelling, a corky texture and a pink color
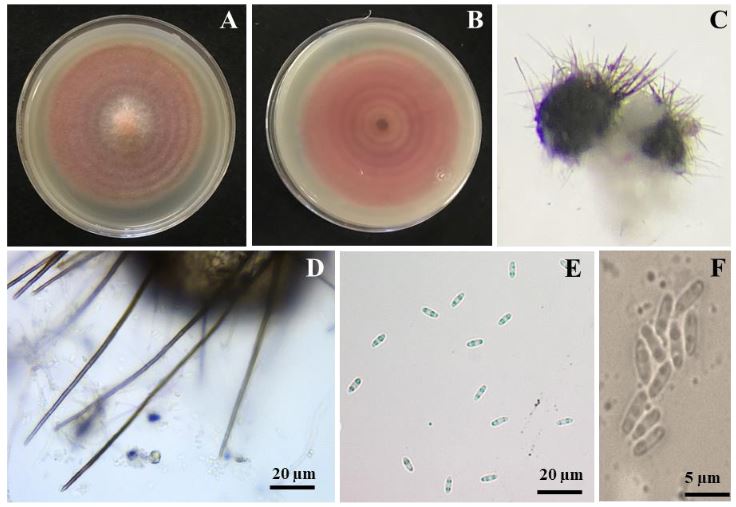
Figure 3. Colonies and asexual reproductive structures of <em>Setophoma terrestris</em>. A) Colony of S. terrestris in a V8A medium with 7 days of growth. B) Colony growth on the reverse of the dish. D) Pycnidium. D) Setae. E–F) Biguttulate conidia.
Figure 3. Colonies and asexual reproductive structures of Setophoma terrestris. A) Colony of S. terrestris in a V8A medium with 7 days of growth. B) Colony growth on the reverse of the dish. D) Pycnidium. D) Setae. E–F) Biguttulate conidia.
Figure 4. Bayesian Tree obtained with combined data from sequences ITS and LSU. The tree shows the phylogenetic relations of the Setophoma species. The Bayesian posterior probability values of over 0.70 are shown in the nodes. The species Pseudopyrenochaeta lycopersici was used as an external group and the scale bar indicates the number of expected changes per site.
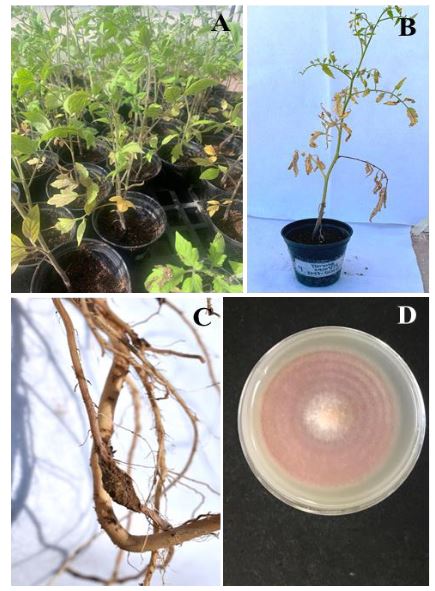
Figure 5. Pathogenicity tests in tomato plants. A–B) Tomato plants of the 8444 variety inoculated with S. terrestris and showing symptoms of yellowing. C) Corky root symptom 30 days after inoculation with S. terrestris. D) Colony obtained from the <em>in vitro</em> reisolation of S. terrestris.
Figure 5. Pathogenicity tests in tomato plants. A–B) Tomato plants of the 8444 variety inoculated with S. terrestris and showing symptoms of yellowing. C) Corky root symptom 30 days after inoculation with S. terrestris. D) Colony obtained from the in vitro reisolation of S. terrestris.
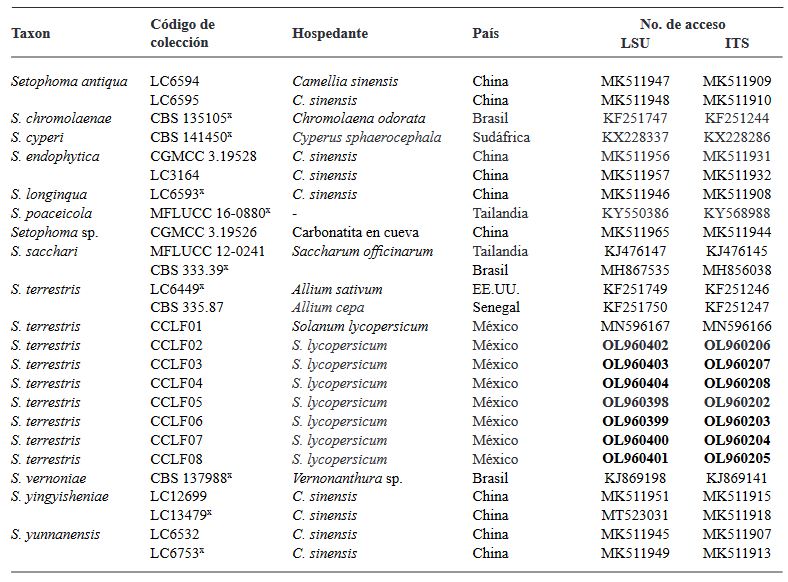
Table 1. Information of fungal isolates and GenBank accession numbers of Setophoma species used in the phylogeneti analysis.
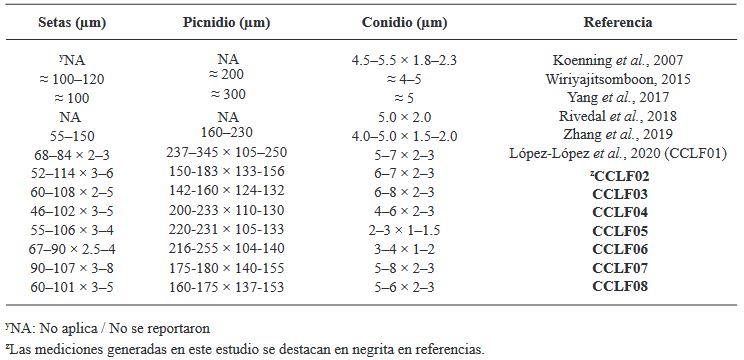
Table 2. Measurements of asexual structures in Setophoma terrestres isolates obtained from tomato plants.
  • Vol. 2023, 41(4)
  • Scientific Article
  • Special Issue

Genus Orthotospovirus in Costa Rica: A Central American case

byMauricio Montero Astúa*, Natasha Dejuk Protti, David Bermúdez Gómez, Elena Vásquez Céspedes, Laura Garita Salazar, Federico J Albertazzi, Scott Adkins, Lisela Moreira Carmona

Received: 23/August/2023 – Published: 28/December/2023
DOI: https://doi.org/10.18781/R.MEX.FIT.2023-6

Abstract Background/Objective. The Orthotospovirus genus encompasses a range of economically significant and emerging plant viruses that affect a variety of crops globally. While the prevalence and characteristics of these phytopathogenic viruses are extensively documented in North and South America, their presence in Central America remains comparatively underexplored. This study focuses on Costa Rica, strategically positioned at the nexus of North and South America, to enhance our understanding of Orthotospovirus in this region.

Materials and Methods. We analyzed 295 plant samples using enzyme-linked immunosorbent assay (ELISA) to test for the presence of INSV, IYSV, TSWV, and the GRSV/TCSV serogroup. Additionally, a subset (20 samples) underwent further scrutiny through reverse transcription-polymerase chain reaction (RT-PCR) employing both universal and species-specific primers.

Results. Our ELISA results indicated the absence of TSWV and the GRSV/TCSV serogroup. However, the presence of INSV in Costa Rica was substantiated through ELISA, RT-PCR, and partial sequencing, revealing its prevalence in both open-field and greenhouse environments. Despite previous diagnostic reports suggesting the presence of TSWV in Costa Rica, our study did not detect this virus. RT-PCR analysis with degenerate primers also found no evidence of other Orthotospovirus species in our samples. The identification of a dominant INSV haplotype, along with three additional variants, suggests the likelihood of at least two independent virus introductions into the region.

Conclusion. These findings underscore the necessity for more comprehensive surveys and research on Orthotospoviruses in Central America to better understand their epidemiology and impact on agriculture.

Show Figures and/or Tables
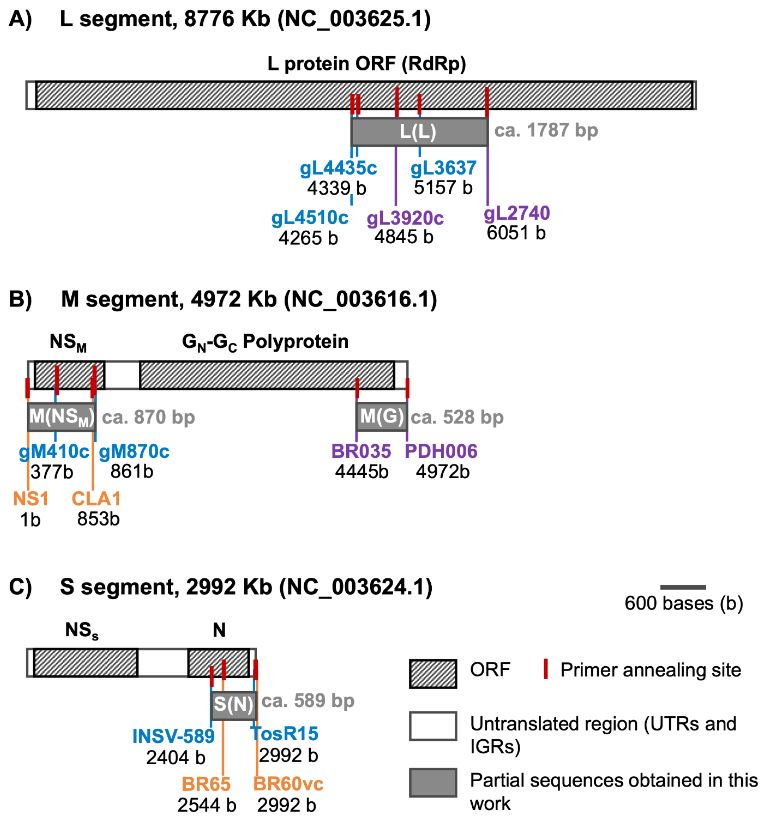
Figure 1. Representation of primer pairs annealing positions in reference to the complete genome of Impatiens necrotic spot virus; accession numbers in parenthesis for each genome segment. Overlapping among primers and the final partial sequences (gray rectangles) obtained herein with corresponding expected size (bp). Base pair values under each primer represent the positions of the first and last nucleotide of the corresponding amplicon in the reference genome
Figure 2. Diverse Symptoms of Impatiens necrotic spot virus (INSV) in Multiple Hosts Confirmed by ELISA and RT-PCR/Sequencing. A: Necrotic concentric rings on Impatiens (Impatiens sp.) T031. B, C: Chlorotic rings and spots on Snapdragons (Antirrhinum majus) T057. D: Chlorotic and necrotic striate on orchid leaves T024. E, F: Chlorotic mosaic on Amaryllis (Hippeastrum sp.) T161 and Iris (Iris sp.) T184. G: Necrotic concentric rings on Coleus (Plectranthus scuttellarioides) T157. H: Chlorotic patterns on Basil (Ocimum basilicum) T156. I, M: Chlorotic concentric ring patterns on Sweet Pepper (<em>Capsicum annuum</em>) leaves T250 and T092. J, K, L: Uneven ripening, ring patterns, and deformation on Sweet Pepper fruits T092, T107, T094. N, O: Chlorotic patterns, rings, and uneven surface on Tomato (<em>Solanum lycopersicum</em>) fruits T263 and T303.
Figure 2. Diverse Symptoms of Impatiens necrotic spot virus (INSV) in Multiple Hosts Confirmed by ELISA and RT-PCR/Sequencing. A: Necrotic concentric rings on Impatiens (Impatiens sp.) T031. B, C: Chlorotic rings and spots on Snapdragons (Antirrhinum majus) T057. D: Chlorotic and necrotic striate on orchid leaves T024. E, F: Chlorotic mosaic on Amaryllis (Hippeastrum sp.) T161 and Iris (Iris sp.) T184. G: Necrotic concentric rings on Coleus (Plectranthus scuttellarioides) T157. H: Chlorotic patterns on Basil (Ocimum basilicum) T156. I, M: Chlorotic concentric ring patterns on Sweet Pepper (Capsicum annuum) leaves T250 and T092. J, K, L: Uneven ripening, ring patterns, and deformation on Sweet Pepper fruits T092, T107, T094. N, O: Chlorotic patterns, rings, and uneven surface on Tomato (Solanum lycopersicum) fruits T263 and T303.
Figure 3. Long-Term Detection of impatiens necrotic spot and tomato spotted wilt viruses by ELISA. This graph presents the frequency of detection for both Impatiens necrotic spot virus and Tomato spotted wilt virus over a 23.5-year period (2000 to July 2023). The data, derived from samples submitted to the diagnostic services at the Cellular and Molecular Biology Research Center, University of Costa Rica, illustrate the temporal trends and occurrence patterns of these viruses in Costa Rica.
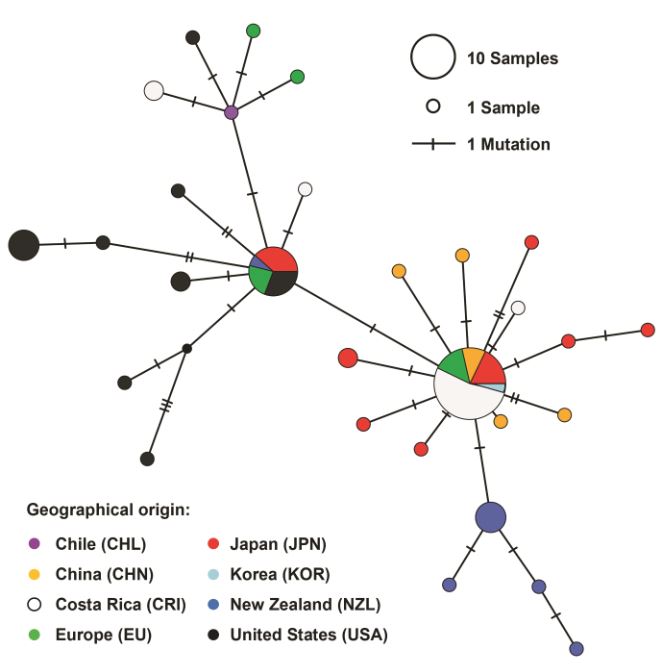
Figure 4. Haplotype Network Graph of Impatiens Necrotic Spot Virus. This graph is a haplotype network inferred using the TCS method, based on a 261 bp sequence alignment of the nucleocapsid protein ORF (S[N] segment) of Impatiens necrotic spot virus. The network includes data from 81 isolates, visually representing the genetic relationships and diversity among the different haplotypes of the virus.
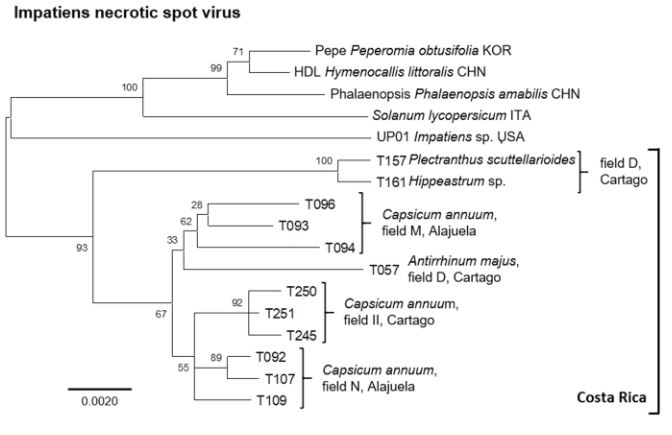
Figure 5. Comprehensive phylogenetic analysis of impatiens necrotic spot virus isolates. This figure illustrates a phylogenetic tree constructed from an alignment of concatenated sequences (2945 positions) encompassing regions of the nucleocapsid [S(N)], glycoprotein precursor [M(G)], movement protein [M(NSM)], and viral polymerase [L(L)] ORFs. The tree includes isolates from various countries, identified by ISO 3166-1 three- letter codes: CHN (China), ITA (Italy), KOR (South Korea), and USA (United States of America). For Costa Rican isolates, additional distinct letter codes in parenthesis signify separate geographic locations. The analysis, executed in MEGA X, utilized the Maximum Likelihood method with a Tamura-3-parameter model and a gamma-distributed rate of variation in nucleotides (+G), involving 2000 permutations. The scale bar indicates the number of nucleotide substitutions per site.
Table 4. Partial nucleotide sequences and virus identity determined for a subset of INSV ELISA-positive samples
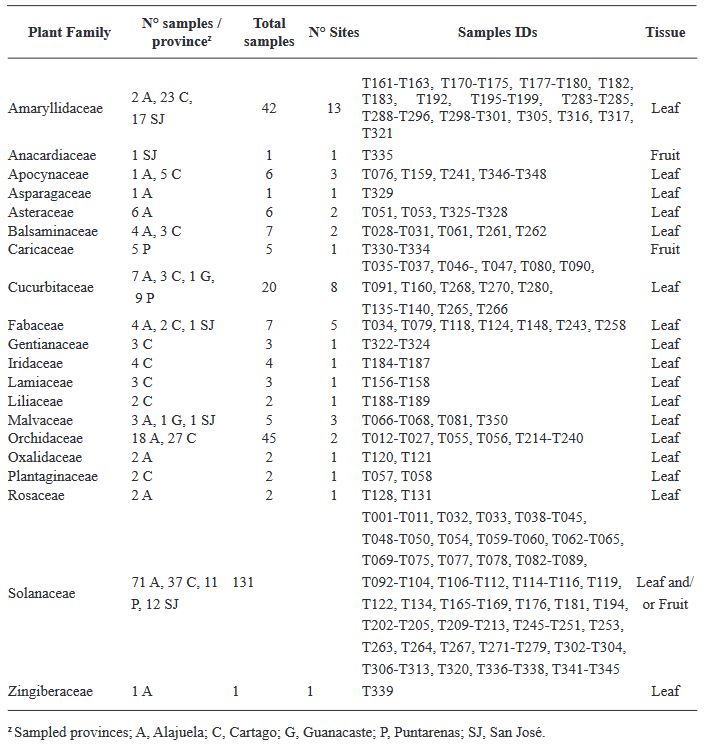
Table 1. Samples collected from five provinces of Costa Rica to analyze the presence of species of Orthotospvirus
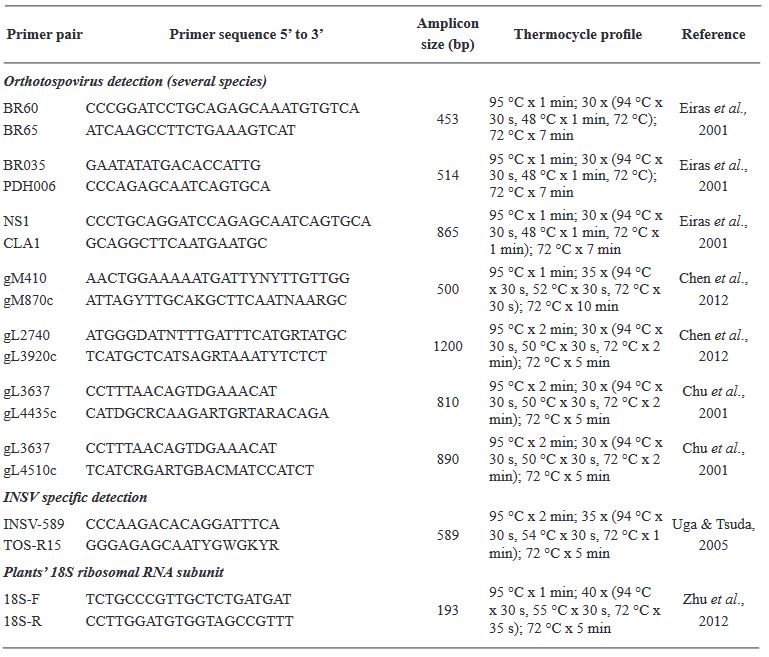
Table 2. Primer pairs and thermocycle profiles used for the detection of <em>Orthotospovirus</em>es
Table 2. Primer pairs and thermocycle profiles used for the detection of Orthotospoviruses
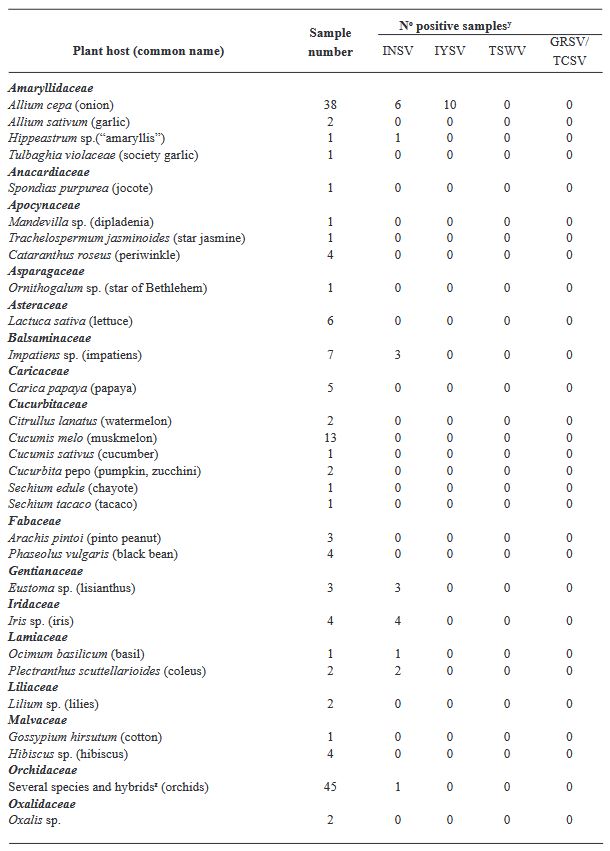
Table 3. Number of total and positive samples per plant species tested by ELISA to detect three <em>Orthotospovirus</em>es in Costa Rica.
Table 3. Number of total and positive samples per plant species tested by ELISA to detect three Orthotospoviruses in Costa Rica.
  • Vol. 2023, 41(4)
  • Scientific Article
  • Special Issue

Virome of the vegetable prickly pear cactus in the central zone of Mexico

byCandelario Ortega Acosta, Daniel L Ochoa Martínez*, Reyna I Rojas Martínez, Cristian Nava Díaz, Rodrigo A Valverde

Received: 31/July/2023 – Published: 27/December/2023
DOI: https://doi.org/10.18781/R.MEX.FIT.2023-2

Abstract Background/Objective. In this study, the ability of high-throughput sequencing (HTS) to detect viruses in vegetable prickly pear cactus was exploited.

Materials and Methods. Samples from State of Mexico (EDMX), Hidalgo, and Morelos, as well as Mexico City (CDMX), were analyzed.

Results. In the sample from EDMX, the genomes of Opuntia virus 2 (OV2, genus Tobamovirus) and Cactus carlavirus 1 (CCV-1, genus Carlavirus) were detected and recovered. In the sample from CDMX, in addition to OV2 and CCV-1, a new viroid and potexvirus were detected. The former has a circular RNA genome with a length of 412 nt for which the name “Opuntia viroid I” (OVd-I) is proposed. The primary structure of this viroid showed a nucleotide sequence identity of less than 80% with any of the currently known viroids and a phylogenetic relationship with the genus Apscaviroid (Family Pospiviroidae) with which it shares conserved structural motifs.

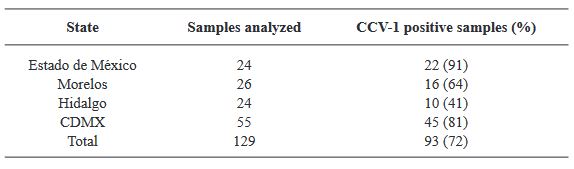
Conclusion. The new potexvirus was named Opuntia potexvirus A (OPV-A), whose viral replicase sequence has a 77.7 % amino acid identity with Schlumbergera virus X. Finally, CCV-1 was detected in 93 (72 %) of 129 vegetable prickly pear cactus samples collected in the four entities.

Show Figures and/or Tables
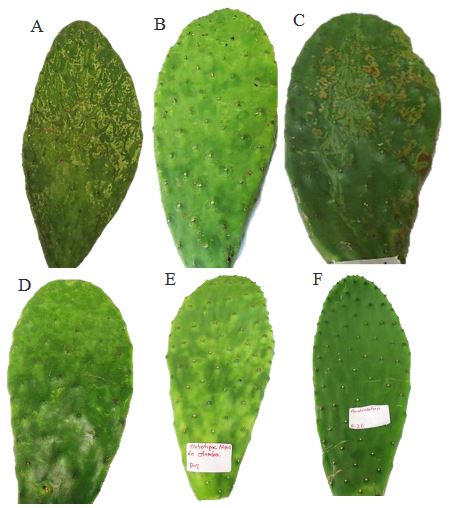
Figure 1. Symptoms associated with virosis in vegetable prickly pear cactus cladodes. (A-D) Samples of prickly pear cactus collected in Mexico City, Milpa Alta Borough, (E) Prickly pear cactus sample collected in the State of Mexico, Otumba Municipality, (F) Healthy prickly pear cactus sample from the State of Mexico.
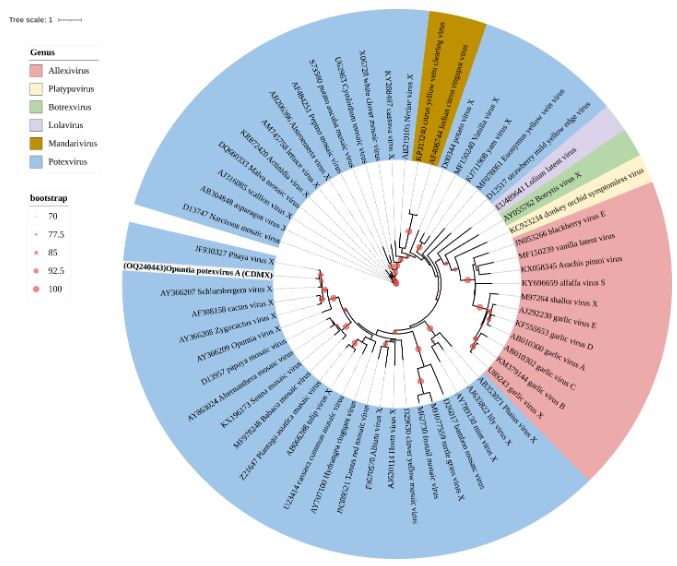
Figure 10. Maximum Likelihood phylogenetic tree of the Alphaflexiviridae family based on amino acid se- quences of the coat protein; the <em>Opuntia</em> potexvirus A sequence is highlighted in bold. Tree colors represent different genera within this family. Circles on branches indicate UFBoot support values >70%.
Figure 10. Maximum Likelihood phylogenetic tree of the Alphaflexiviridae family based on amino acid se- quences of the coat protein; the Opuntia potexvirus A sequence is highlighted in bold. Tree colors represent different genera within this family. Circles on branches indicate UFBoot support values >70%.
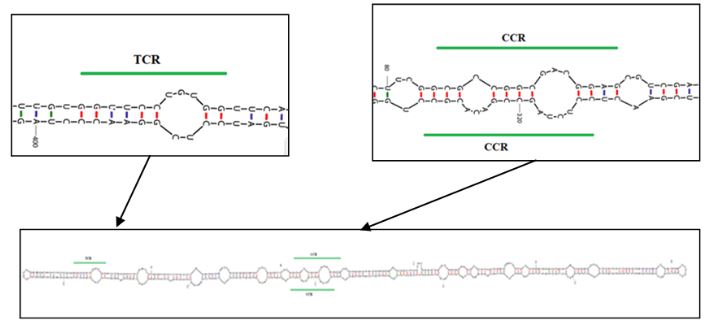
Figure 11. Predicted secondary structure using the UNAFold web server (UNAFold tool available online: www. mfold.org) for OVd-I. Highlighted are the sites forming the terminal conserved region (TCR) at positions 16 to 26 and the central conserved region (CCR) at positions 84 to 100 and 313 to 329
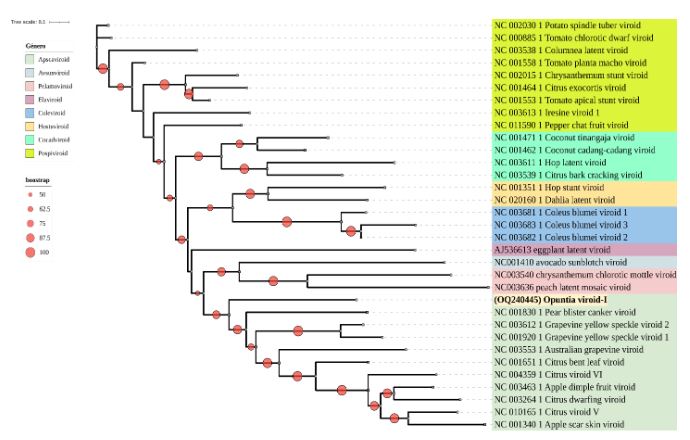
Figure 12. Maximum Likelihood phylogenetic tree of the Pospiviroidae and Avsunviroidae families based on nucleotide sequences of complete genomes from representative species of different genera. The sequence obtained from OVd-I is highlighted in bold. Various colors represent viroid genera. Circles on branches indicate UFBoot support values >50%.
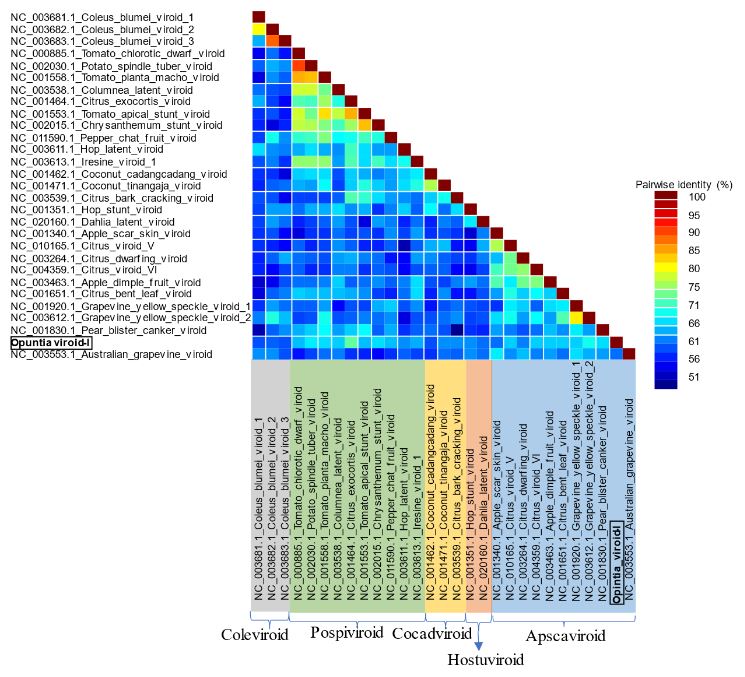
Figure 13. Pairwise identity frequency distribution obtained using the Sequence Demarcation Tool (SDT) (Muhire <em>et al.,</em> 2014) from complete genome sequences of Pospiviroidae family species to support the demarcation of <em>Opuntia</em> viroid I as a new species
Figure 13. Pairwise identity frequency distribution obtained using the Sequence Demarcation Tool (SDT) (Muhire et al., 2014) from complete genome sequences of Pospiviroidae family species to support the demarcation of Opuntia viroid I as a new species
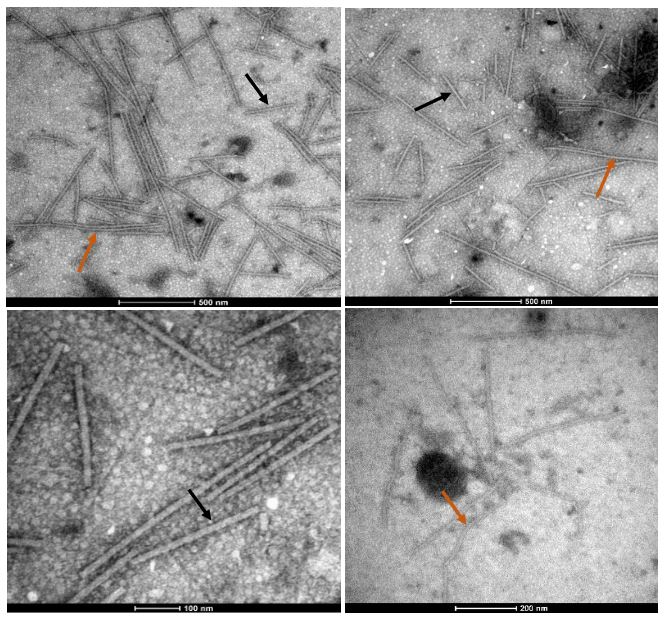
Figure 14. Viral particles in the form of rigid rods (®) and flexible filaments (®) of varying lengths were observed through transmission electron microscopy in vegetable prickly pear cactus exhibiting irregular yellow patterns, yellow rings, mosaic patterns, and chlorotic spots around the spines, employing the “leaf dip” technique
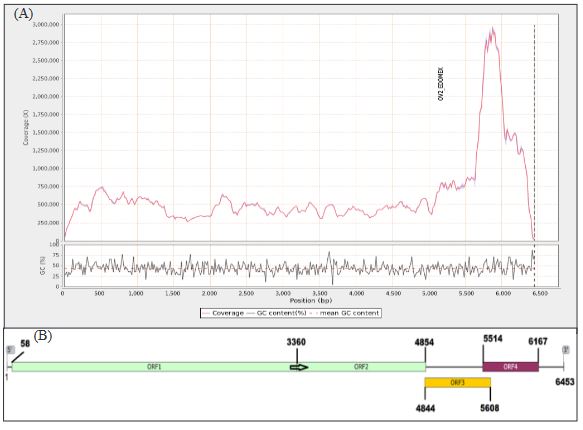
Figure 2. (A) Read coverage across the genome of the OV2-Edo-Mex isolate and the percentage of guanine-cytosine content, (B) Genomic map of OV2-Edo-Mex. The arrow indicates the termination codon site of the complete 128 kDa protein, with readthroughs
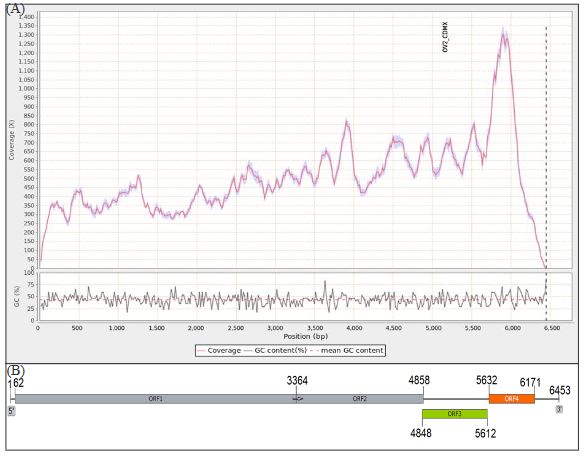
Figure 3. (A) Read coverage across the genome of the OV2-CDMX isolate and the percentage of guanine-cytosine content. (B) Genomic map of OV2-CDMX. The arrow indicates the termination codon site of the complete 128 kDa protein, with readthroughs.
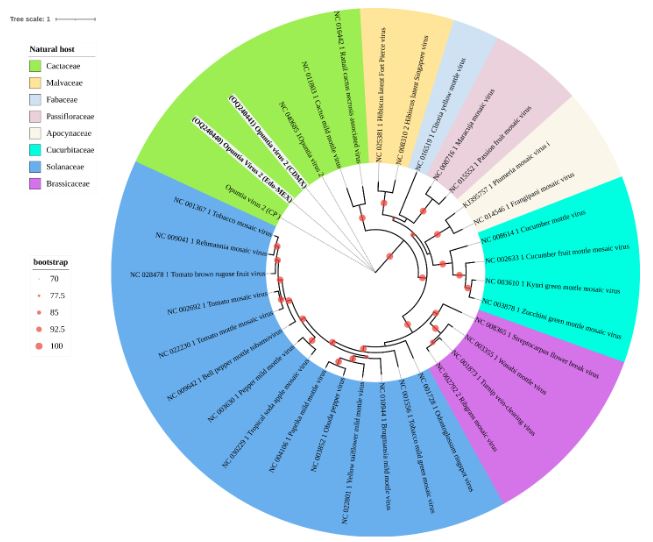
Figure 4. Maximum Likelihood phylogenetic tree of the Tobamovirus genus showing the relationships between genomes obtained in this study (in bold) for OV2 and those of previously reported isolates. Different colors represent botanical families as natural hosts where each virus has been reported. Circles on branches indicate UFBoot support values > 70%.
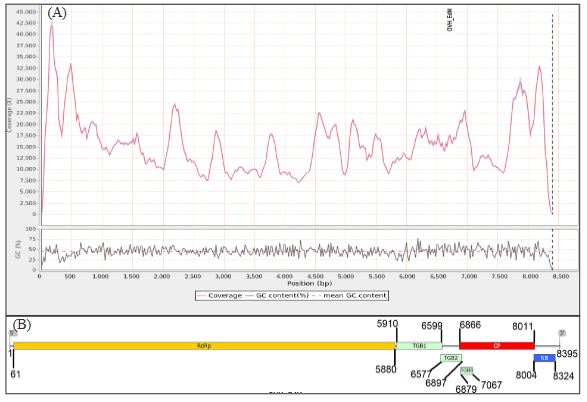
Figure 5. (A) Read coverage across the genome of the CCV-1-Edo-Mex isolate and the percentage of guanine-cytosine content. (B) Genome organization of CCV1-Edo-Mex, depicting six open reading frames and their corresponding products. RNA-dependent RNA polymerase (RdRp); coat protein (CP); nucleic acid-binding protein (NB); triple gene block (TGB)
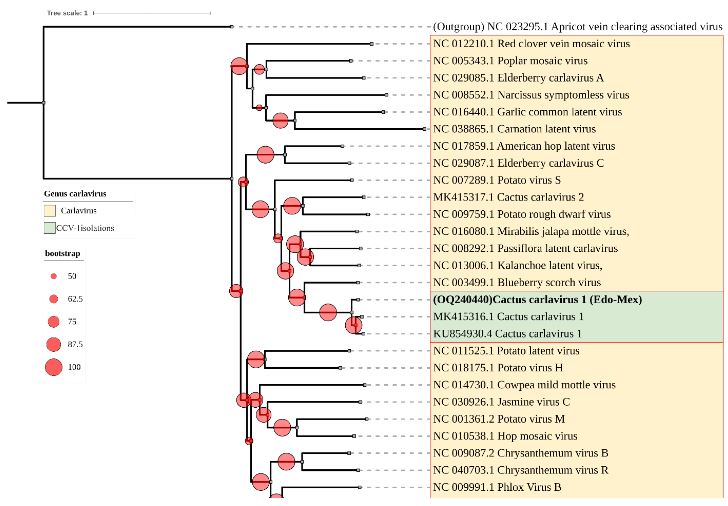
Figure 6. Maximum Likelihood phylogenetic tree of complete nucleotide sequences of CCV-1 genomes from this study (in bold), along with other isolates, and various species within the Carlavirus genus. Apricot vein clearing associated virus, Prunevirus genus, was used as an outgroup. Circles on branches indicate UFBoot support values > 50%.
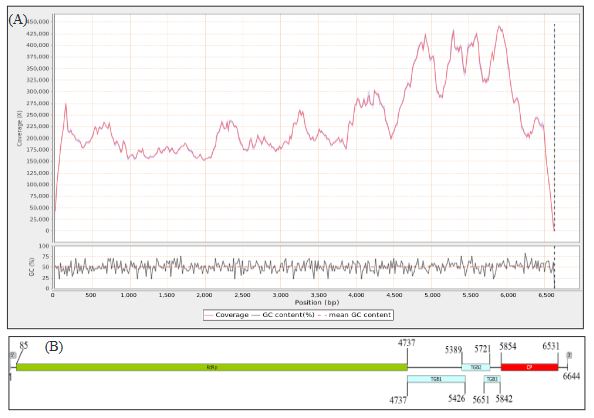
Figure 7. (A) Read coverage across the genome of <em>Opuntia potexvirus A (OPV-A)</em> and guanine/ cytosine percentage. (B) Genome organization of OPV-A, displaying five open reading frames and their corresponding products: RdRp, viral replicase; TGB, triple gene block; CP, coat protein.
Figure 7. (A) Read coverage across the genome of Opuntia potexvirus A (OPV-A) and guanine/ cytosine percentage. (B) Genome organization of OPV-A, displaying five open reading frames and their corresponding products: RdRp, viral replicase; TGB, triple gene block; CP, coat protein.
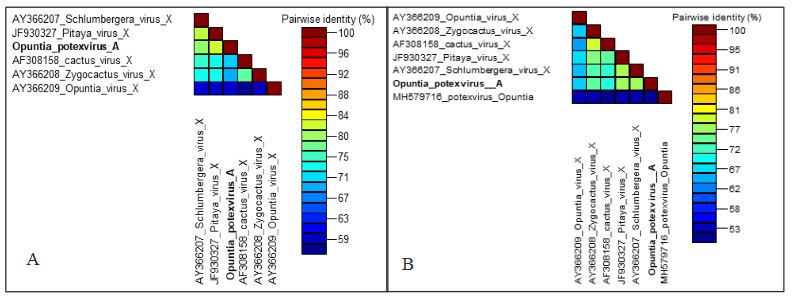
Figure 8. Matrix of amino acid identity percentage for the coat protein (A) and viral replicase (B) of species within the Potexvirus genus closest to <em>Opuntia</em> potexvirus A (in bold)
Figure 8. Matrix of amino acid identity percentage for the coat protein (A) and viral replicase (B) of species within the Potexvirus genus closest to Opuntia potexvirus A (in bold)
Figure 9. Maximum Likelihood phylogenetic tree of the Alphaflexiviridae family based on viral replicase amino acid sequences; the <em>Opuntia</em> potexvirus A sequence is highlighted in bold. Tree colors rep- resent different genera within this family. Circles on branches indicate UFBoot support values >70%
Figure 9. Maximum Likelihood phylogenetic tree of the Alphaflexiviridae family based on viral replicase amino acid sequences; the Opuntia potexvirus A sequence is highlighted in bold. Tree colors rep- resent different genera within this family. Circles on branches indicate UFBoot support values >70%
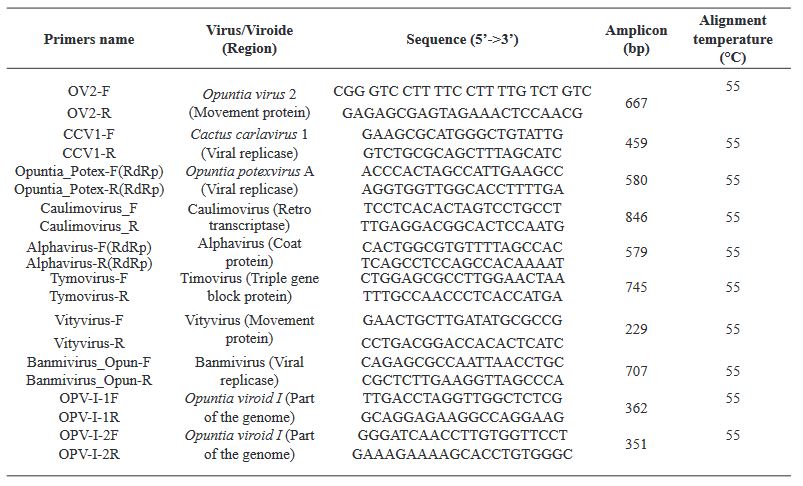
Table 1. Primers used in RT-PCR assays for the validation of viruses/viroids detected in the HTS data from two vegetable prickly pear cactus libraries
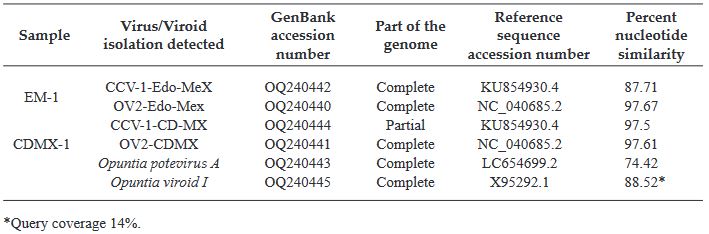
Table 2. Comparison of the complete or partial genome of the viruses identified through HTS in the two vegetable prickly pear cactus libraries with the most closely related reference sequence from GenBank.
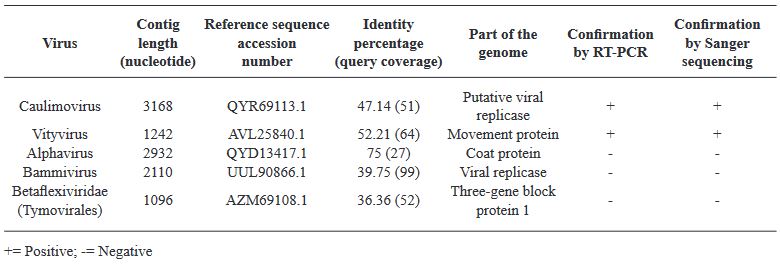
Table 3. Result of Blastx analysis for potentially present viruses in the CDMX-1 library, confirmed through RT-PCR and sequencing
Table 4. Detection of CCV-1 in four vegetable prickly pear cactus producing states in Mexico
  • Vol. 2024, 42(1)
  • Review Article

Aspergillus oryzae: An opportunity for agriculture

byKaren Berenice García Conde, Ernesto Cerna Chávez, Yisa María Ochoa Fuentes*, Jazmín Janet Velázquez Guerrero

Received: 23/February/2023 – Published: 14/November/2023
DOI: https://doi.org/10.18781/R.MEX.FIT.2302-2

Abstract Aspergillus oryzae is a filamentous fungus capable of degrading various substances employing enzymes, which is why it is widely used in the biotechnological industry, pharmaceutical products, enzymes for industrial use, bleaching agents, anti-pollution textile treatments. However, few works focus on these microorganism’s field applications. This manuscript reviews the potentially beneficial applications of A. oryzae and some by-products in agriculture as biological control, growth inducer, and bioremediation for soils contaminated with heavy metals.

Show Figures and/or Tables
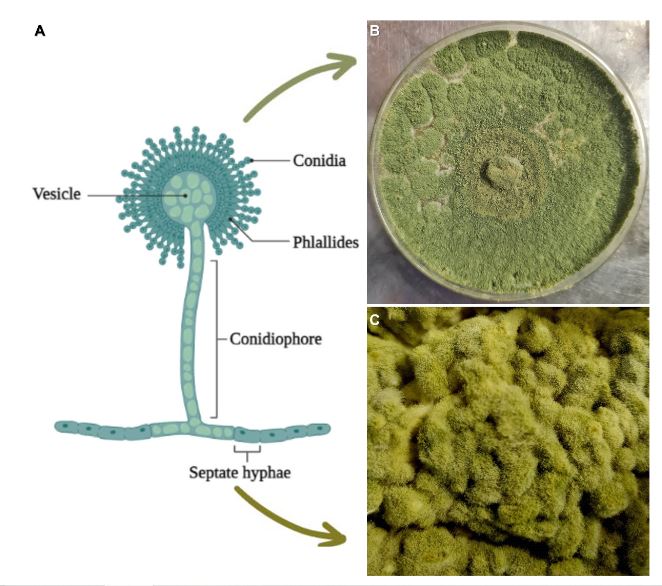
Figure 1. Morphology of A. oryzae; A) Parts and structures of the fungus (Adapted from “Structure of <em>Aspergillus</em> spp.”, 2023), B) A. oryzae planted in a PDA medium and C) Growth of A. oryzae in steamed rice (köji)
Figure 1. Morphology of A. oryzae; A) Parts and structures of the fungus (Adapted from “Structure of Aspergillus spp.”, 2023), B) A. oryzae planted in a PDA medium and C) Growth of A. oryzae in steamed rice (köji)
Figure 2. Areas of application of <em>Aspergillus oryzae</em>
Figure 2. Areas of application of Aspergillus oryzae
Figure 3. Characteristics and basics of kojic acid based on reports by Phasha et al. (2022) and Siddiquee (2018)
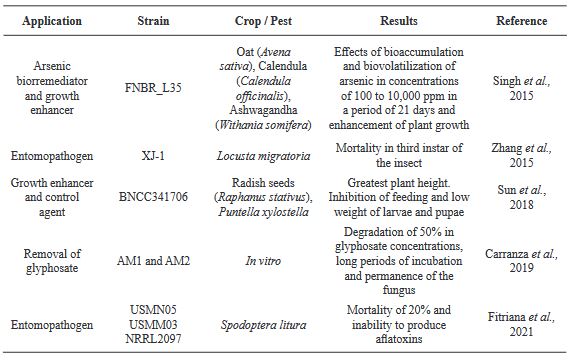
Table 1. Use of A. oryzae as a growth enhancer, pest control agent and bioremediator od contaminated soils
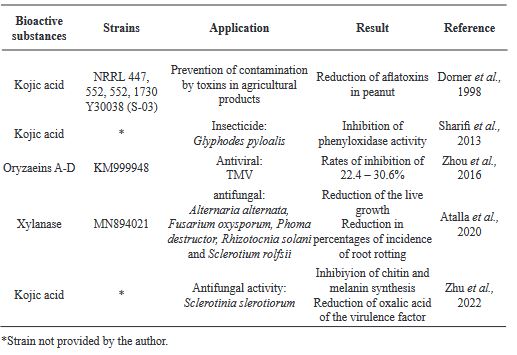
Table 2. Activity of bioactive substances produced by A. oryzae against plant pathogens.

Page 14 of 16