RMF Logo

Article filters

Search Papers:

For searching before 2024 see Archive (2000-2023)

All the Articles

  • Vol. 2025, 43(4)
  • Scientific Article
  • Special Issue

Wheat leaf blight-associated fungi and their biological control

byMariana Guadalupe Sánchez Alonso, Patricia Rivas Valencia*, Leticia Robles Yerena, Raúl Asael Rodríguez Villareal, María Florencia Rodríguez García, Raúl Rodríguez Guerra

Received: 18/November/2024 – Published: 26/June/2025
DOI: https://doi.org/10.18781/R.MEX.FIT.2024-26

Abstract Background/Objective. The objective was to determine the inhibitory effect of actinobacterial morphotypes on mycelial growth of fungi associated with wheat leaf blight.

Materials and methods. A total of 136 samples of wheat leaves were processed from the highlands of Mexico. They were sectioned, washed and placed in a humid chamber; fungi were isolated on potato dextrose agar. A morphological identification was carried out and the incidence of diseases was recorded by federal entity. Actinobacteria were isolated from soil samples using the dilution technique and microcolonies were isolated on nutrient agar. Preliminary in vitro bioassays were established at 27 °C with 144 actinobacteria and a dual confrotation with morphotypes presented a percentage of inhibition of mycelial growth (PIMG) greater than 40% and to identify those with potential for the control of fungi associated with leaf spots. The experimental design was completely randomized and an analysis of variance (p ≤ 0.05) and mean test (Tukey p ≤ 0.05) were performed.

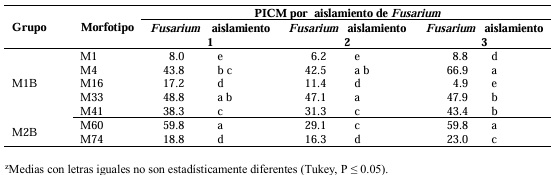
Results. At least three actinobacteria inhibited mycelial growth of Fusarium spp. in a range of 42.5 - 66.9 %. The inhibitory efficacy of strain M2B M60 was highest with Fusarium isolate 1, that of M1B33 with Fusarium isolate 2 and that of M1B M4 was most effective with Fusarium isolate 3.

Conclusion. The use of actinobacteria represents an alternative for integrated management in the control of fungi associated with foliar blight in wheat, as they present an inhibitory effect on mycelial growth.

Show Figures and/or Tables
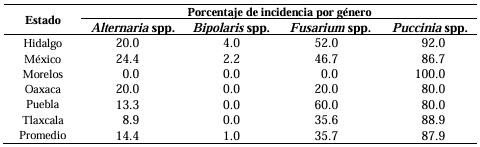
Table 1. Percentage of incidence of fungi associated with diseases in wheat crops sampled in the main producing states.
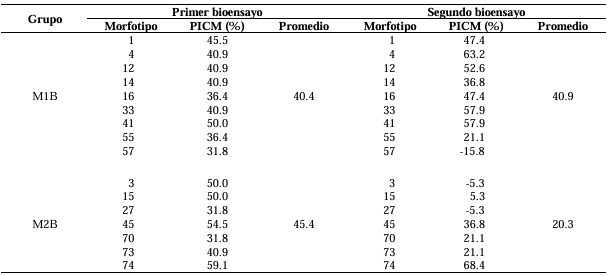
Table 2. Percentage inhibition of mycelial growth (PIMG) of preliminary bioassays of actinobacterial morphotypes against <em>Fusarium</em> isolate 1.
Table 2. Percentage inhibition of mycelial growth (PIMG) of preliminary bioassays of actinobacterial morphotypes against Fusarium isolate 1.
Table 3. Percentage inhibition of mycelial growth (PIMG) of three <em>Fusarium</em> isolates from wheat confronted with seven actinobacteria morphotypes.
Table 3. Percentage inhibition of mycelial growth (PIMG) of three Fusarium isolates from wheat confronted with seven actinobacteria morphotypes.
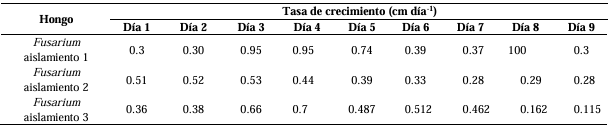
Table 4. Growth rate of <em>Fusarium</em> isolates from wheat leaves.
Table 4. Growth rate of Fusarium isolates from wheat leaves.
Figure 1. <em>Alternaria</em> spp. colonies. A) Colony on PDA culture medium. B) Colony on APZ culture medium. C) Early-stage mycelial growth on PDA culture medium. D) Colony on PDA medium showing one or two concentric rings observed under backlighting. E) Colony on PZA medium showing several concentric rings observed under backlighting. F-I) Conidia and conidial chains.
Figure 1. Alternaria spp. colonies. A) Colony on PDA culture medium. B) Colony on APZ culture medium. C) Early-stage mycelial growth on PDA culture medium. D) Colony on PDA medium showing one or two concentric rings observed under backlighting. E) Colony on PZA medium showing several concentric rings observed under backlighting. F-I) Conidia and conidial chains.
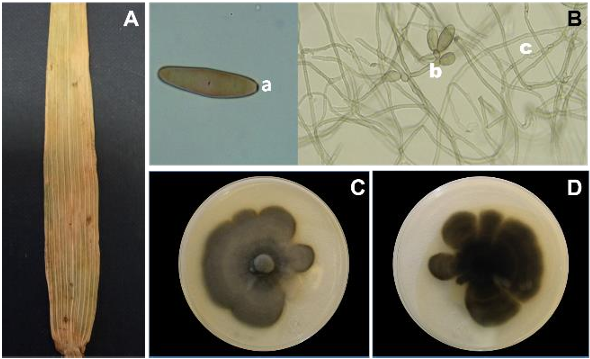
Figure 2. Symptoms and colonies of <em>Bipolaris</em> sp. A) Symptom of <em>Bipolaris</em> sp., of wheat leaf blight. B) Conidium with three slightly marked septa (a. basal scar), conidiophores (b), and mycelium (c). C) Colony on PDA culture medium. D) Reverse side of the Petri dish on PDA culture medium.
Figure 2. Symptoms and colonies of Bipolaris sp. A) Symptom of Bipolaris sp., of wheat leaf blight. B) Conidium with three slightly marked septa (a. basal scar), conidiophores (b), and mycelium (c). C) Colony on PDA culture medium. D) Reverse side of the Petri dish on PDA culture medium.
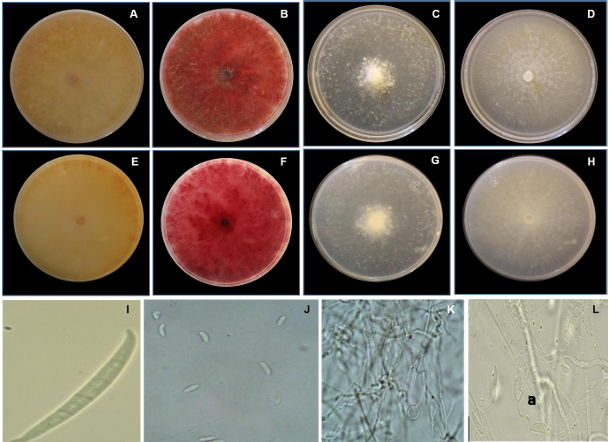
Figure 3. Characteristics of <em>Fusarium</em> spp. A and E) Front and reverse view of the colony on PDA culture medium of <em>Fusarium</em> isolate 1. B and F) Front and reverse view of the colony on SNA culture medium of <em>Fusarium</em> isolate 1. C and G) Front and reverse view of the colony on PDA culture medium of <em>Fusarium</em> isolate 2. D and H) Front and reverse view of the colony on SNA culture medium of <em>Fusarium</em> isolate 2. I) Macroconidium of <em>Fusarium</em> isolate 1. J) Microconidia of <em>Fusarium</em> isolate 2. K) Chlamydospores of <em>Fusarium</em> isolate 2. L) Microconidia and phialides (a) of isolate 2.
Figure 3. Characteristics of Fusarium spp. A and E) Front and reverse view of the colony on PDA culture medium of Fusarium isolate 1. B and F) Front and reverse view of the colony on SNA culture medium of Fusarium isolate 1. C and G) Front and reverse view of the colony on PDA culture medium of Fusarium isolate 2. D and H) Front and reverse view of the colony on SNA culture medium of Fusarium isolate 2. I) Macroconidium of Fusarium isolate 1. J) Microconidia of Fusarium isolate 2. K) Chlamydospores of Fusarium isolate 2. L) Microconidia and phialides (a) of isolate 2.
Figure 4. Rust pustules. A) Rust pustules on a wheat leaf. B) Urediniospore of <em>Puccinia</em> 1. C) Urediniospore of <em>Puccinia</em> 2. D) Teliospore of <em>Puccinia</em> 1. E) Teliospore of <em>Puccinia</em> 2.
Figure 4. Rust pustules. A) Rust pustules on a wheat leaf. B) Urediniospore of Puccinia 1. C) Urediniospore of Puccinia 2. D) Teliospore of Puccinia 1. E) Teliospore of Puccinia 2.
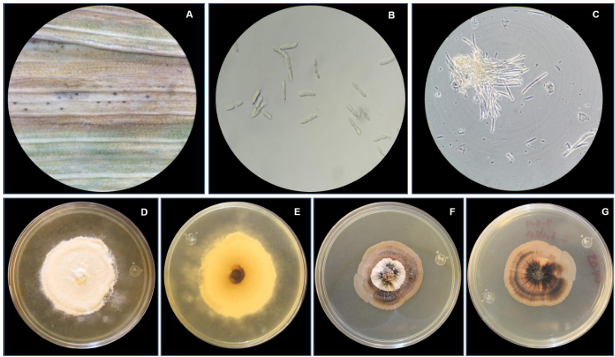
Figure 5. A) Chlorotic halos with pycnidia. B) Conidia of <em>Septoria</em> sp. C) Conidia of <em>Zymoseptoria</em> sp. observed under contrast phase. D) Front view of <em>Septoria</em> sp. colony on PDA. E) Reverse view of <em>Septoria</em> sp. colony on PDA. F) Front view of <em>Zymoseptoria</em> sp. colony on PDA. G) Reverse view of <em>Zymoseptoria</em> sp. colony.
Figure 5. A) Chlorotic halos with pycnidia. B) Conidia of Septoria sp. C) Conidia of Zymoseptoria sp. observed under contrast phase. D) Front view of Septoria sp. colony on PDA. E) Reverse view of Septoria sp. colony on PDA. F) Front view of Zymoseptoria sp. colony on PDA. G) Reverse view of Zymoseptoria sp. colony.
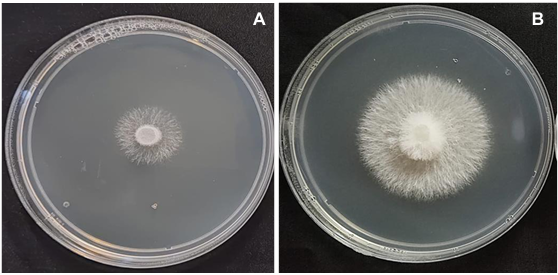
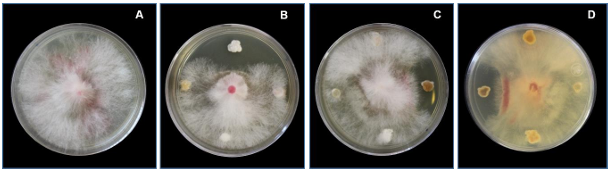
Figure 6. <em>Fusarium</em> isolate 1, nine days old. A) Control. B) and C) Interaction of the fungus with four actinobacteria, front view. D) Interaction of the fungus with four actinobacteria, back of the Petri dish.
Figure 6. Fusarium isolate 1, nine days old. A) Control. B) and C) Interaction of the fungus with four actinobacteria, front view. D) Interaction of the fungus with four actinobacteria, back of the Petri dish.
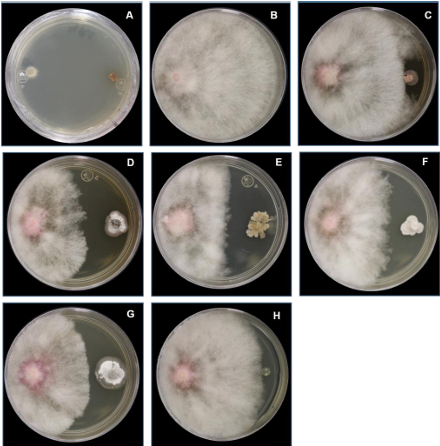
Figure 7. Dual confrontation with Fusarium isolate 1. A) Distribution of <em>Fusarium</em> discs. B) Growth of the control colony of <em>Fusarium</em> isolate 1. C) <em>Fusarium</em> isolate 1 and morphotype M1B M1. D) <em>Fusarium</em> isolate 1 and morphotype M1B M4. G) <em>Fusarium</em> isolate 1 and morphotype M2B M60. H) <em>Fusarium</em> isolate 1 and morphotype M2B M74. I) Mycelial growth of control <em>Fusarium</em> isolate 1.
Figure 7. Dual confrontation with Fusarium isolate 1. A) Distribution of Fusarium discs. B) Growth of the control colony of Fusarium isolate 1. C) Fusarium isolate 1 and morphotype M1B M1. D) Fusarium isolate 1 and morphotype M1B M4. G) Fusarium isolate 1 and morphotype M2B M60. H) Fusarium isolate 1 and morphotype M2B M74. I) Mycelial growth of control Fusarium isolate 1.
  • Vol. 2025, 43(4)
  • Scientific Article
  • Special Issue

Actinomycete extracts against Pseudomonas syringae pv. phaseolicola in Phaseolus vulgaris

byEvangelina Esmeralda Quiñones Aguilar, Alfredo Reyes Tena, Gabriel Rincón Enriquéz, Juan Carlos Rico Aguilar, Luis López Pérez*

Received: 02/November/2024 – Published: 25/June/2025
DOI: https://doi.org/10.18781/R.MEX.FIT.2024-02

Abstract Background/Objective. Common bean (Phaseolus vulgaris) is mainly affected by the bacterium Pseudomonas syringae pv. phaseolicola (PSPH), which can cause severe economic losses. A sustainable alternative for its control is the use of antimicrobial agents such as actinomycetes. This study aimed to evaluate the effect of extracts from three actinomycete strains (ED65, ED66, and ED67) on the control of Pseudomonas syringae pv. phaseolicola in Phaseolus vulgaris under controlled conditions.

Materials and Methods. Two mL of the actinomycete extracts were sprayed onto Azufrado bean plants, inoculated with PSPH. After 16 days, symptoms were assessed by the number of leaves showing spots, defoliation, number of spots per leaf, and disease severity using a damage scale.

Results. A statistically significant reduction (P < 0.05), was found in the number of spots and disease lesions in plants sprayed with the extracts. The level of damage decreased significantly in plants treated with the ED65 and ED67 extracts, and the ED66 treatment showed no damage.

Conclusion. According to the results of this study, strain ED66 showed the greatest potential for use as a source of antimicrobial substances for managing halo blight in beans, followed by ED65 and ED67.

Show Figures and/or Tables
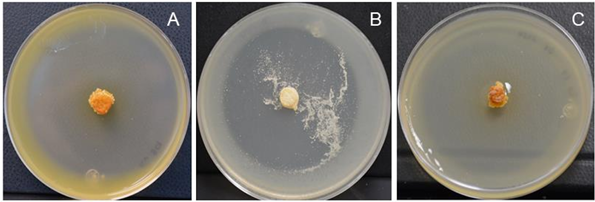
Figure 1. Strains ED65 (A), ED66 (B), and ED67 (C), showing typical morphological characteristics of actinobacteria.
Figure 2. Number of leaves with necrosis at 16 days after inoculation with <em>Pseudomonas syringae</em> pv. <em>phaseolicola</em> in bean plants. DP = diseased plant; HP = healthy plant. Different letters above the bars indicate statistically significant differences (Tukey, P<0.05). The line above the bars (Ɪ) represents the standard error.
Figure 2. Number of leaves with necrosis at 16 days after inoculation with Pseudomonas syringae pv. phaseolicola in bean plants. DP = diseased plant; HP = healthy plant. Different letters above the bars indicate statistically significant differences (Tukey, P<0.05). The line above the bars (Ɪ) represents the standard error.
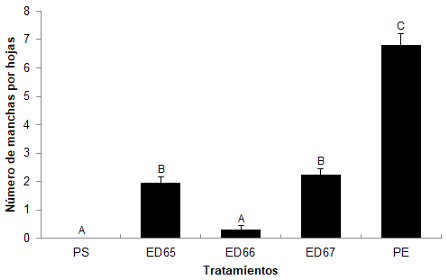
Figure 3. Number of spots per leaf at 16 days after inoculation with <em>Pseudomonas syringae</em> pv. <em>phaseolicola</em> in bean plants. DP = diseased plant; HP = healthy plant. Different letters above the bars indicate statistically significant differences (Tukey, P<0.05). The line above the bars (Ɪ) represents the standard error.
Figure 3. Number of spots per leaf at 16 days after inoculation with Pseudomonas syringae pv. phaseolicola in bean plants. DP = diseased plant; HP = healthy plant. Different letters above the bars indicate statistically significant differences (Tukey, P<0.05). The line above the bars (Ɪ) represents the standard error.
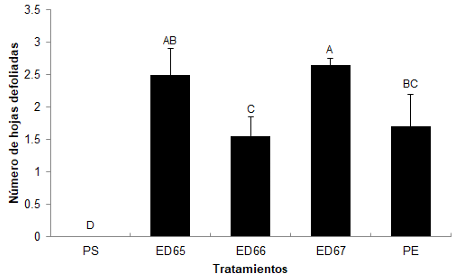
Figure 4. Number of defoliated leaves in bean plants at 16 days after inoculation with <em>Pseudomonas syringae</em> pv. <em>phaseolicola</em>. DP = diseased plant; HP = healthy plant. Different letters above the bars indicate statistically significant differences (Tukey, P<0.05). The line above the bars (Ɪ) represents the standard error.
Figure 4. Number of defoliated leaves in bean plants at 16 days after inoculation with Pseudomonas syringae pv. phaseolicola. DP = diseased plant; HP = healthy plant. Different letters above the bars indicate statistically significant differences (Tukey, P<0.05). The line above the bars (Ɪ) represents the standard error.
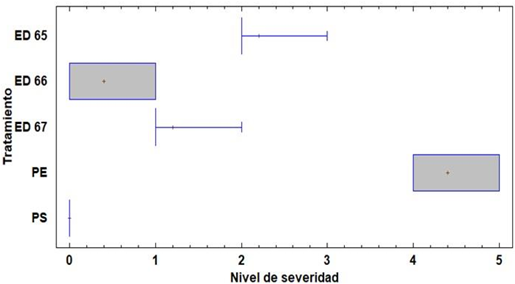
Figure 5. Severity level of halo blight in <em>Phaseolus vulgaris</em> at 16 days after inoculation with<em> Pseudomonas syringae</em> pv. <em>phaseolicola</em>. DP = Diseased plant; HP = Healthy plant.
Figure 5. Severity level of halo blight in Phaseolus vulgaris at 16 days after inoculation with Pseudomonas syringae pv. phaseolicola. DP = Diseased plant; HP = Healthy plant.
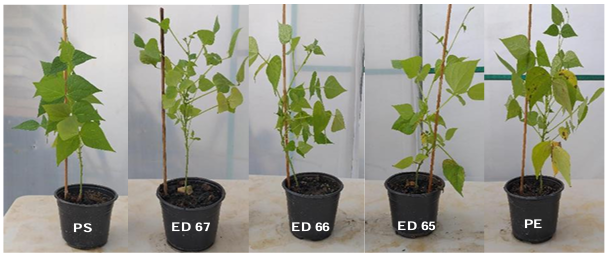
Figure 6. Damage caused by halo blight in bean plants at 16 days after inoculation with <em>Pseudomonas syringae</em> pv. <em>phaseolicola</em> in plants treated with actinomycetes (ED67, ED66, and ED65). HP = healthy plant (negative control); DP = diseased plant (positive control).
Figure 6. Damage caused by halo blight in bean plants at 16 days after inoculation with Pseudomonas syringae pv. phaseolicola in plants treated with actinomycetes (ED67, ED66, and ED65). HP = healthy plant (negative control); DP = diseased plant (positive control).
  • Vol. 2025, 43(4)
  • Scientific Article
  • Special Issue

Effect of ornamental plants on the rhizospheric fungal microbiome and soil properties

byRamón Alejandro Murillo Chaidez, Mirella Romero Bastidas*, Alejandra Nieto Garibay, Alejandro Palacios Espinosa

Received: 12/November/2024 – Published: 06/June/2025
DOI: https://doi.org/10.18781/R.MEX.FIT.2024-06

Abstract Antecedent/Objective. Ornamental plants are important for the aesthetics of green areas in Baja California Sur. However, there are few studies related to their influence on soil fungal diversity and edaphological characteristics. Therefore, the objective of this study was to evaluate the effect of six ornamental (Euphorbia mili, Ruellia simplex, Catharantus roseus, Centaurea cyanus, Tagetes erecta and Calendula officinalis) on the population, diversity and richness of fungi, as well as their relationship with soil physical and chemical characteristics.

Materials and Methods. Randomly obtained rhizospheric soil samples were subjected to serial dilutions for isolation, population counting, morphological identification, and the diversity and richness of fungi associated with each ornamental species. In addition, the soil's physical and chemical characteristics were determined at the beginning and end of the experiment. A Person correlation between the variables was also evaluated.

Results. The highest fungal population was in C. cyanus with 8,096.66 CFU g-1 of soil. While, in E. mili and T. erecta it was reduced to 3,333.33 CFU g-1 of soil. Seven genus were identified, with Aspergillus spp. being the most predominant. While, E. mili and C. cyanus stimulated the greatest diversity (12 and 13 isolates). The correlation analysis was negative.

Conclusion. This information confirms that the ornamental species C. cyanus has a significant influence on soil ecology by increasing the microbial population (from 2,833.33 to 8,096.66 CFU g-1 of soil) and greatly stimulating its diversity (with seven isolates at the beginning and 13 at the end)

Show Figures and/or Tables
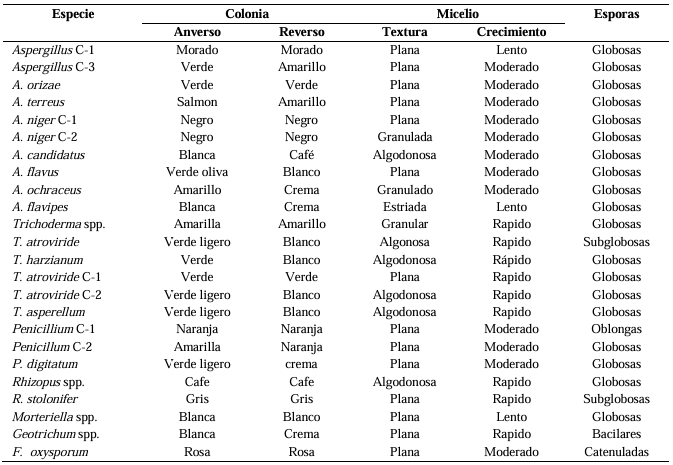
Table 1. Morphology of the rhizospherical fungi associated to ornamental plants.
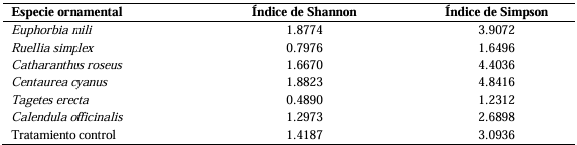
Table 2. Fungal diversity and richness of the rhizosphere of ornamental plants.
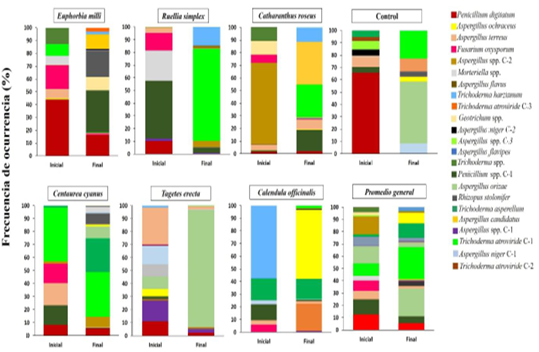
Figure 1. Effect of ornamental plants on the fungal population of the rhizosphere of plants.
Figure 2. Microbiota corresponding to the <em>Aspergillus</em> genus found in the rhizosphere of ornamental plants.
Figure 2. Microbiota corresponding to the Aspergillus genus found in the rhizosphere of ornamental plants.
Figure 3. Microbiota corresponding to the <em>Trichoderma</em> and <em>Penicillium</em> genera of the rhizosphere in ornamental plants.
Figure 3. Microbiota corresponding to the Trichoderma and Penicillium genera of the rhizosphere in ornamental plants.
Figure 4. Microbiota corresponding to the genus with the least diversity in the rhizosphere of ornamental plants.
Figure 5. Fungal diversity and richness in the soil of ornamental plants.
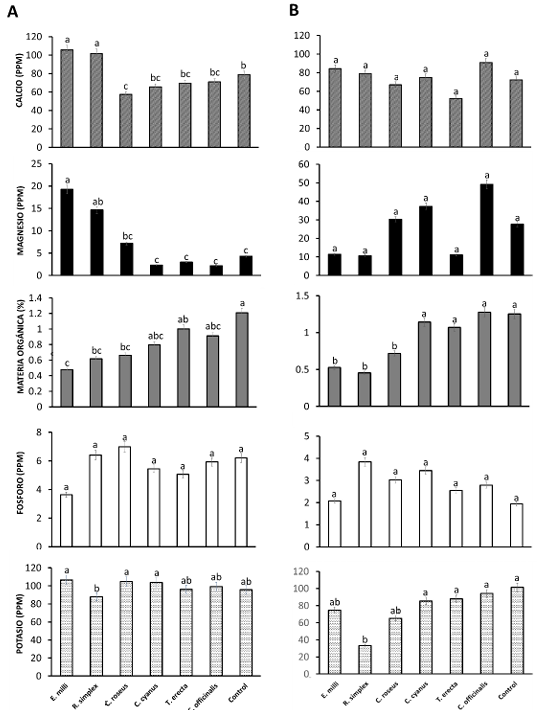
Figure 6. Effect of ornamental plants on soil nutrients. A) Initial and B) final analyses. The values are means ± standard deviation. a b c d; means followed by the same letter for a given factor are not significantly different (p < 0,05; Tukey’s HSD test).
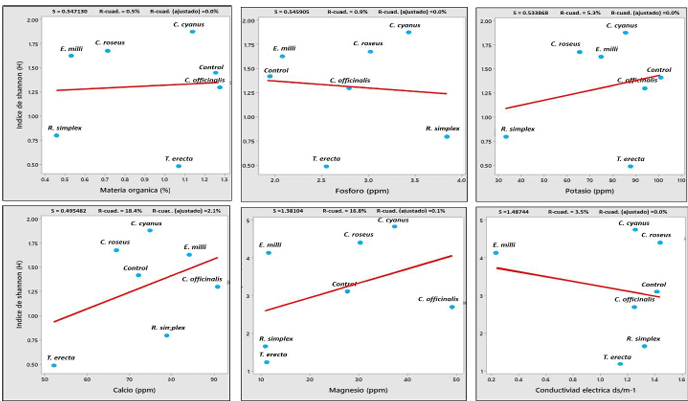
Figure 7. Correlation between Shannon’s fungal diversity index and the characteristics of the soil associated to ornamental plants.
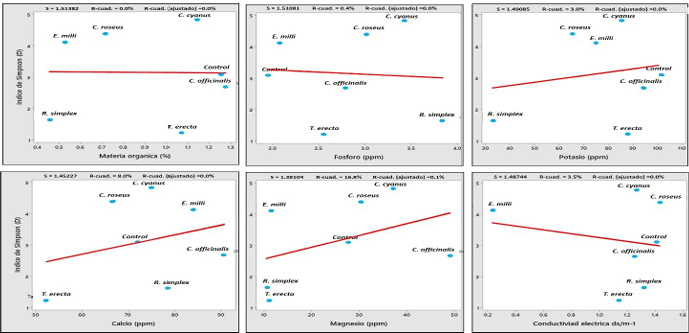
Figure 8. Correlation between Simpson’s fungal diversity index and the characteristics of the soil associated to ornamental plants.
  • Vol. 2025, 43(4)
  • Scientific Article
  • Special Issue

Biocontrol of Fusarium oxysporum and growth promotion in chili pepper using Bacillus cereus and B. thuringiensis

byMaribel Mendoza Alatorre, Aldo Gutiérrez Chávez, Angélica Anahí Acevedo Barrera, Loreto Robles Hernández, Jared Hernández Huerta*

Received: 20/November/2024 – Published: 06/June/2025
DOI: https://doi.org/10.18781/R.MEX.FIT.2024-15

Abstract Background/Objective. Fusarium oxysporum is the causal agent of chili wilt, and an ecological strategy for its management may involve the use of Bacillus spp., as they have demonstrated both biocontrol activity against phytopathogenic fungi and plant growth promoting (PGP) abilities. The objective was to evaluate the biocontrol and PGP capacity of B. cereus and B. thuringiensis and their effect on morphological variables in jalapeño pepper and the reduction of wilt severity.

Materials and Methods. Pathogenicity and virulence tests were conducted on jalapeño seedlings using six F. oxysporum strains isolated from pepper plants. In vitro antagonism assays were performed between native strains B. cereus Bc28-2 (Bc28-2), B. cereus Bc28 5 (Bc28-5), and B. thuringiensis Bt24 (Bt24), using Bacillus subtilis QST713 as a positive control (PC), against the F. oxysporum strains. PGP assays were also conducted on pepper seedlings using the Bacillus strains. Additionally, biocontrol tests against F. oxysporum FL2 were conducted under greenhouse conditions. Data were analyzed using ANOVA, mean separation tests (p < 0.05), and a principal component analysis (PCA). R

esults. All F. oxysporum strains were pathogenic, with 100% incidence and 89.9% severity. The PC strain achieved the highest fungal spore degradation (86.7%), followed by Bc28-2 and Bc28-5 (84.2%). Bt24 and Bc28-2 promoted the best development of pepper seedlings, showing increases in vegetative parameters. In the biocontrol of F. oxysporum FL2, Bc28-2, and Bc28-5 reduced disease severity by 60.4% and promoted growth comparable to the control, whereas Bt24 showed no efficacy in controlling wilt.

Conclusion. The results indicate the potential of Bacillus cereus Bc28-2 and Bc28-5 as biocontrol agents against F. oxysporum in jalapeño pepper. However, field validation and exploration of their integration into sustainable agricultural management are necessary.

Show Figures and/or Tables
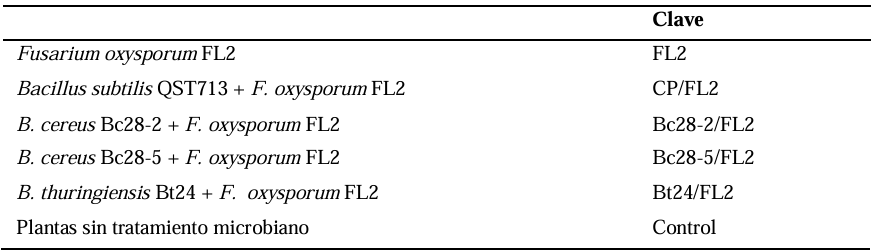
Table 1. reatments used for the biocontrol of <em>Fusarium oxysporum</em> FL2 applied to jalapeño chili plants grown under greenhouse conditions.
Table 1. reatments used for the biocontrol of Fusarium oxysporum FL2 applied to jalapeño chili plants grown under greenhouse conditions.
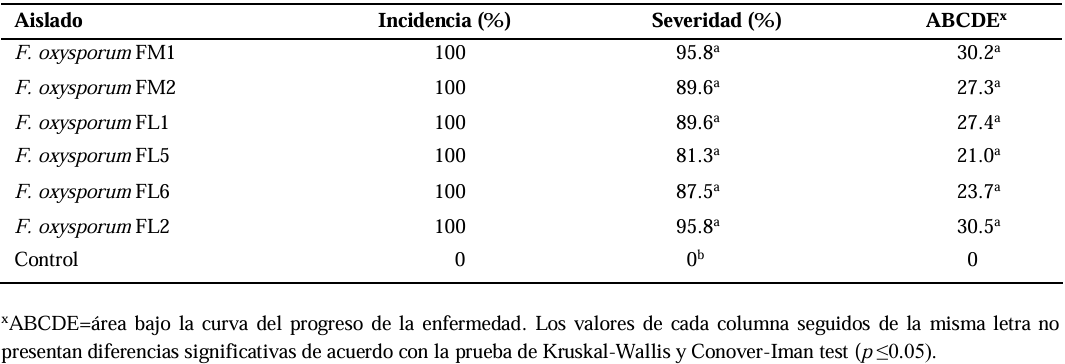
Table 2. Incidence, severity, and progression of wilt in chili seeds 10 days after inoculation with <em>Fusarium oxysporum</em>.
Table 2. Incidence, severity, and progression of wilt in chili seeds 10 days after inoculation with Fusarium oxysporum.
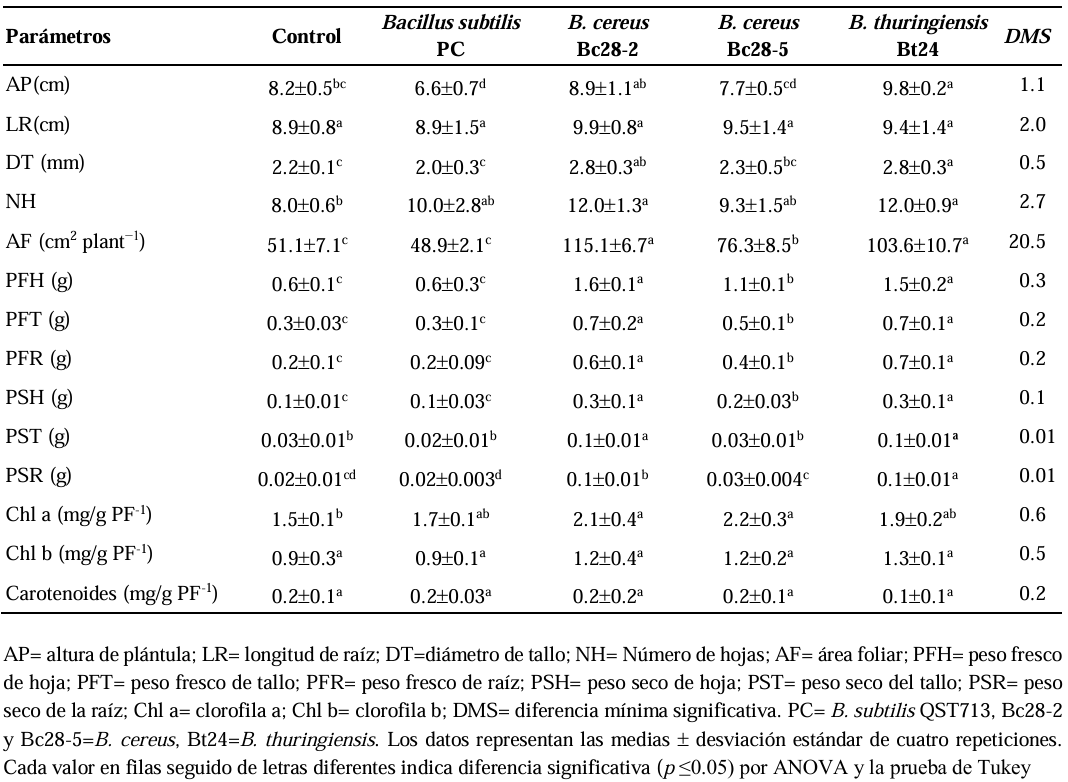
Table 3. Effect of <em>Bacillus</em> spp. on the growth of jalapeño chili seedlings under controlled conditions 30 days after inoculation.
Table 3. Effect of Bacillus spp. on the growth of jalapeño chili seedlings under controlled conditions 30 days after inoculation.
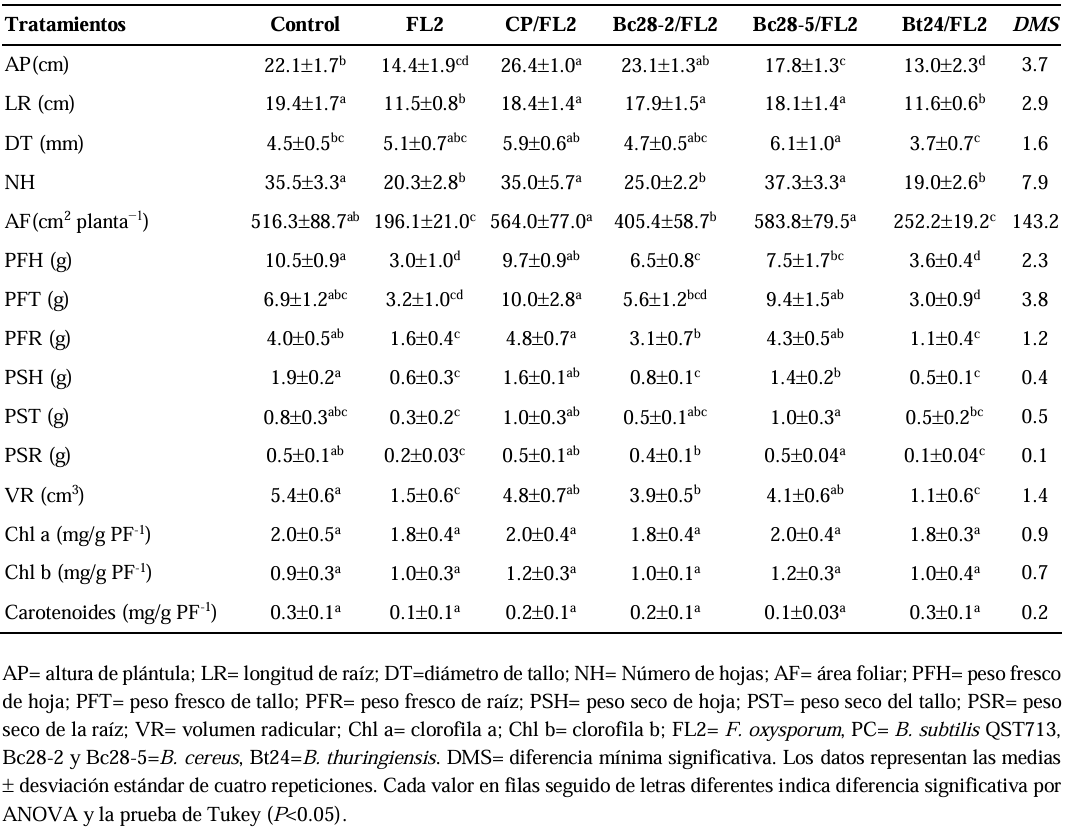
Table 4. Effect of <em>Bacillus</em> spp. on the growth of chili plants under greenhouse conditions 30 days after inoculation with <em>Fusarium oxysporum</em> FL2, the causal agent of chili wilt.
Table 4. Effect of Bacillus spp. on the growth of chili plants under greenhouse conditions 30 days after inoculation with Fusarium oxysporum FL2, the causal agent of chili wilt.
Figure 1. Spore degradation of <em>Fusarium oxysporum</em> by <em>Bacillus</em> spp. in nutrient broth after 48 hours of <em>in vitro</em> interaction. PC = <em>B. subtilis</em> QST713; Bc28-2 and Bc28-5 =<em> B. cereus</em>; Bt24 = B. thuringiensis; <em>F. oxysporum</em> = FM1, FM2, FL1, FL5, FL6, FL2. Bars with different letters indicate significant differences according to the Scott-Knott test (p < 0.05).
Figure 1. Spore degradation of Fusarium oxysporum by Bacillus spp. in nutrient broth after 48 hours of in vitro interaction. PC = B. subtilis QST713; Bc28-2 and Bc28-5 = B. cereus; Bt24 = B. thuringiensis; F. oxysporum = FM1, FM2, FL1, FL5, FL6, FL2. Bars with different letters indicate significant differences according to the Scott-Knott test (p < 0.05).
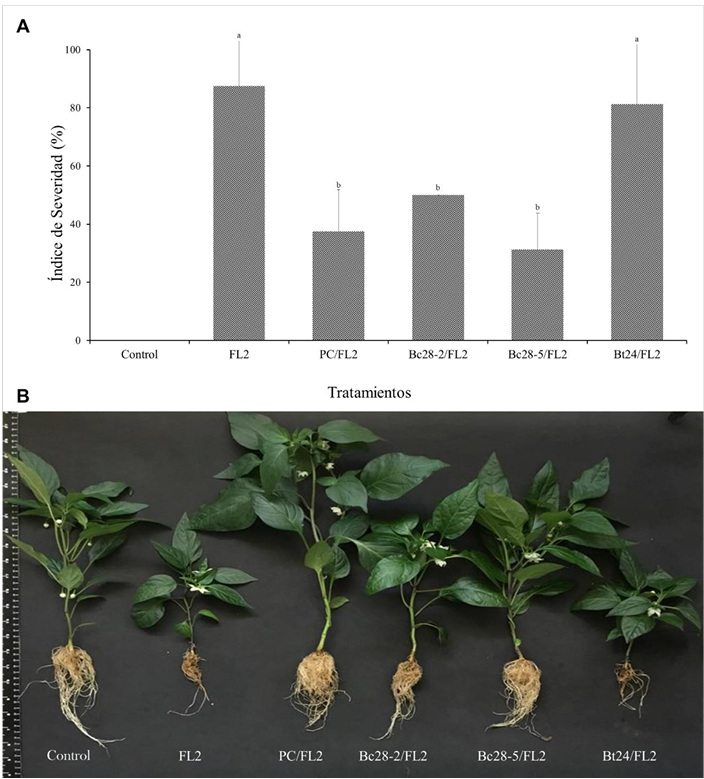
Figure 2. Effect of Bacillus spp. on the control of chili wilt caused by <em>Fusarium oxysporum</em> FL2 under greenhouse conditions, 30 days after inoculation. A) Severity index of chili wilt in interaction with <em>Bacillus</em> spp. F = <em>Fusarium</em> sp. FL2; PC = commercial product (<em>B. subtilis</em> QST713®); Bc28-2 and Bc28-5 = <em>B. cereus</em>; Bt24 = <em>B. thuringiensis</em>. Error bars represent standard deviation. Columns with different letters indicate significant differences according to the Kruskal Wallis and Conover-Iman tests (p < 0.05). B) Symptoms of chili wilt caused by <em>F. oxysporum</em> FL2 and its interaction with Bacillus spp. under greenhouse conditions.
Figure 2. Effect of Bacillus spp. on the control of chili wilt caused by Fusarium oxysporum FL2 under greenhouse conditions, 30 days after inoculation. A) Severity index of chili wilt in interaction with Bacillus spp. F = Fusarium sp. FL2; PC = commercial product (B. subtilis QST713®); Bc28-2 and Bc28-5 = B. cereus; Bt24 = B. thuringiensis. Error bars represent standard deviation. Columns with different letters indicate significant differences according to the Kruskal Wallis and Conover-Iman tests (p < 0.05). B) Symptoms of chili wilt caused by F. oxysporum FL2 and its interaction with Bacillus spp. under greenhouse conditions.
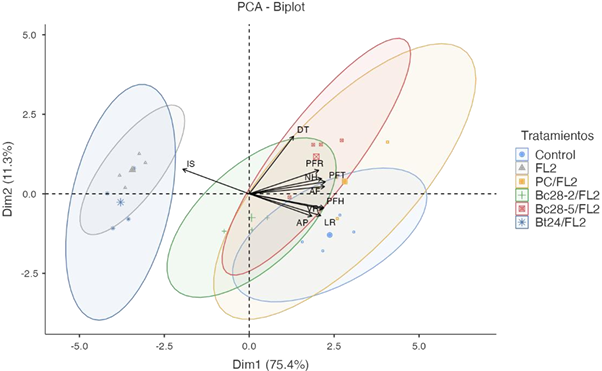
Figure 3. Principal Component Analysis (PCA) of chili plant growth inoculated with Fusarium sp. FL2 (F), commercial product (PC; <em>B. subtilis</em> QST713), <em>B. cereus</em> (Bc28-2, Bc28-5), or <em>B. thuringiensis</em> (Bt24) (χ² = 291, df = 45, p < .001). SI = severity index; SH = seedling height; RL = root length; SD = stem diameter; NL = number of leaves; LA = leaf area; LFW = leaf fresh weight; SFW = stem fresh weight; RFW = root fresh weight; RV = root volume.
Figure 3. Principal Component Analysis (PCA) of chili plant growth inoculated with Fusarium sp. FL2 (F), commercial product (PC; B. subtilis QST713), B. cereus (Bc28-2, Bc28-5), or B. thuringiensis (Bt24) (χ² = 291, df = 45, p < .001). SI = severity index; SH = seedling height; RL = root length; SD = stem diameter; NL = number of leaves; LA = leaf area; LFW = leaf fresh weight; SFW = stem fresh weight; RFW = root fresh weight; RV = root volume.
  • Vol. 2025, 43(2)
  • Scientific Article

Cloning, expression, and serological detection of the putative RNA polymerase of Papaya meleira virus Mexican variant in Escherichia coli

byWendy Serra, Jeanin A Arguelles Quintal, Mildred Carrillo Pech, Alethia F Toriz, Enrique Castaño, Ignacio Islas Flores, Luisa A Lopez Ochoa*

Received: 01/May/2024 – Published: 30/April/2025
DOI: https://doi.org/10.18781/R.MEX.FIT.2405-00

Abstract Background/Objective. Papaya meleira disease in Mexico is associated to Papaya meleira virus Mexican variant (PMeV-Mx) and is characterized by the spontaneous exudation of latex in fruits. PMeV-Mx ORF2 encodes a protein with RNA-dependent RNA polymerase (RdRp) motifs, which is essential for viral replication. This study aimed to develop a method for producing and purifying recombinant PMeV-Mx ORF2 encoded protein (pORF2) in E. coli and generate specific antibodies for its detection.

Materials and Methods. The PMeV-Mx genome was analyzed using UGENE to predict ORFs and identify the putative slippery site. ORF1 and ORF2 were amplified by PCR from cDNA obtained from infected papaya latex, cloned into pGEM-T Easy, and subsequently transferred into pDONR221 and pDEST17 for expression in E. coli. Recombinant 6xHis-pORF2 was expressed in E. coli BL21 strain, induced with IPTG, and purified under denaturing conditions. The purified protein was used to generate polyclonal antibodies, with immunizations conducted at different time points. Antisera specificity and optimal working dilutions were evaluated by immunodetection assays, using recombinant 6xHis-pORF2 as the target and His-tagged proteins as negative controls. Additionally, papaya plants were inoculated with latex from symptomatic fruits as virus reservoir and PMeV-Mx infection was confirmed by RT-PCR.

Results. The recombinant 6xHis-pORF2 protein of PMeV-Mx was expressed in E. coli and purified. A ~46.5 kDa band was detected, consistent with its estimated molecular weight. The protein expression increased between 2- and 6-hours post-induction with IPTG. Western blot analysis confirmed the presence of the His tag and the integrity of the recombinant protein. Purification using Ni-NTA resin resulted in a strong ~46.5 kDa band along with light bands ranging from 15 to 150 kDa. Polyclonal antibodies against pORF2 were generated and specifically recognized the purified protein in immunoassays, with detection observed at dilutions from 1:500 to 1:3000. No cross-reactivity was observed with negative controls, but a non-specific ~75 kDa band was detected in E. coli extracts.

Conclusion. A protocol for expressing, detecting, and purifying the recombinant 6xHis-pORF2 protein from PMeV-Mx in E. coli was established. Rabbit polyclonal antibodies recognized the target protein in bacterial fractions, though further optimization is needed to enhance specificity. These antibodies will support future diagnostic development and protein characterization in plants.

Show Figures and/or Tables
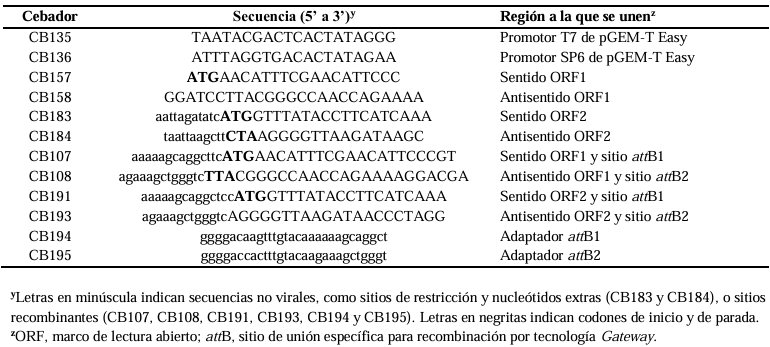
Table 1. Primers used TO clone PMeV-Mx ORF1 AND ORF2 IN pDEST17 vector, TO generate plasmids pCB252 AND pCB253, respectively.
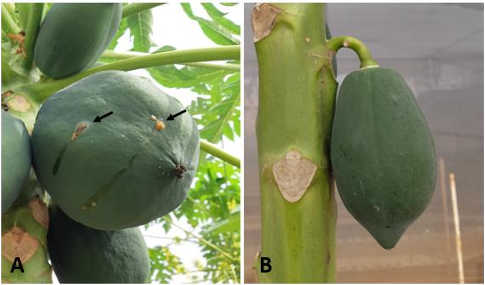
Figure 1. Fruits of <em>Carica papaya</em> cv. Maradol plants grown in the screen house. A) Papaya fruits infected with PMeV-Mx showing the typical meleira disease symptom of spontaneous latex exudation. B) Fruit of mock-inoculated papayas (Healthy).
Figure 1. Fruits of Carica papaya cv. Maradol plants grown in the screen house. A) Papaya fruits infected with PMeV-Mx showing the typical meleira disease symptom of spontaneous latex exudation. B) Fruit of mock-inoculated papayas (Healthy).
Figure 2. Genomic organization of PMeV-Mx. Numbers indicate the nucleotide (nt) positions and the total number of nt in the genome. Solid boxes in the genome represent ORF1 and ORF2, respectively. Solid boxes below indicate the putative proteins, product of ORF1 and ORF2 (pORF1 and pORF2, respectively) and the putative fusion product of -1 ribosomal frameshifting (pORF1/pORF2). The arrow indicates the position of the heptanucleotide.
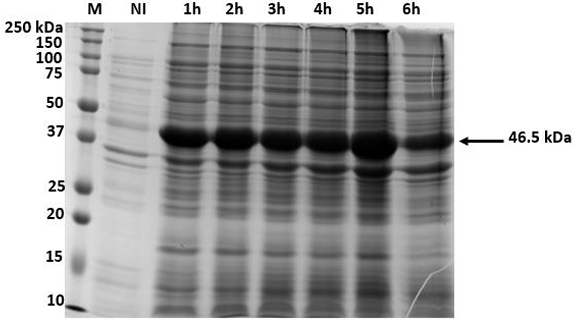
Figure 3. Time course of PMeV-Mx 6xHis-pORF2 expression using insoluble crude <em>E. coli</em> lysate to establish the optimal induction period for expression. Expression of 6xHis-pORF2 was induced with 1 mM IPTG, at 37 ºC. Aliquots were removed at the times indicated (1 to 6 h after IPTG induction) and proteins were visualized by Coomassie-stained SDS gel. M, Bio-Rad 10-250 kDa marker; NI, non-induced control. The arrow indicates the 46.5 kDa 6xHis-pORF2 protein.
Figure 3. Time course of PMeV-Mx 6xHis-pORF2 expression using insoluble crude E. coli lysate to establish the optimal induction period for expression. Expression of 6xHis-pORF2 was induced with 1 mM IPTG, at 37 ºC. Aliquots were removed at the times indicated (1 to 6 h after IPTG induction) and proteins were visualized by Coomassie-stained SDS gel. M, Bio-Rad 10-250 kDa marker; NI, non-induced control. The arrow indicates the 46.5 kDa 6xHis-pORF2 protein.
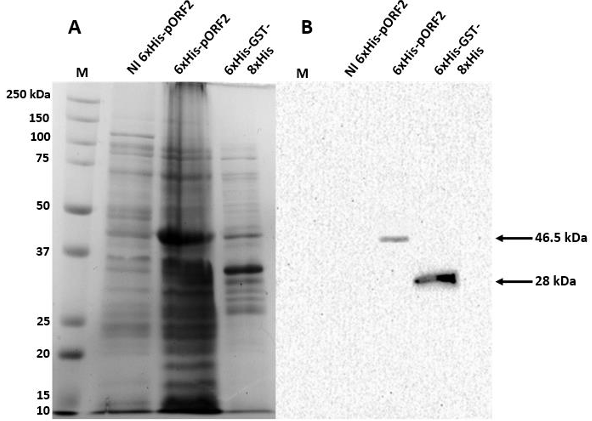
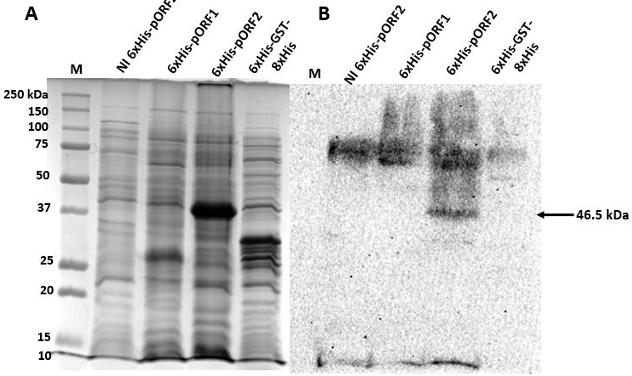
Figure 4. Detection of PMeV-Mx 6xHis-pORF2 in <em>E. coli</em> crude lysates by monoclonal anti-His antibodies. A) Coomassie stained SDS gel. B) Western blot in PVDF membranes incubated with a 1:1000 dilution of the anti-His tag monoclonal antibody coupled to horseradish peroxidase (HRP). M, Bio-Rad 10-250 kDa marker; NI and 6xHis GST-8xHis, non-induced and positive controls, respectively; 6xHis-pORF2, cellular fraction with recombinant PMeV-Mx pORF2 expressed in BL21 cells. The arrows indicate the 46.5 kDa 6xHis-pORF2 and the 28 kDa 6xHis GST-8xHis proteins, respectively.
Figure 4. Detection of PMeV-Mx 6xHis-pORF2 in E. coli crude lysates by monoclonal anti-His antibodies. A) Coomassie stained SDS gel. B) Western blot in PVDF membranes incubated with a 1:1000 dilution of the anti-His tag monoclonal antibody coupled to horseradish peroxidase (HRP). M, Bio-Rad 10-250 kDa marker; NI and 6xHis GST-8xHis, non-induced and positive controls, respectively; 6xHis-pORF2, cellular fraction with recombinant PMeV-Mx pORF2 expressed in BL21 cells. The arrows indicate the 46.5 kDa 6xHis-pORF2 and the 28 kDa 6xHis GST-8xHis proteins, respectively.
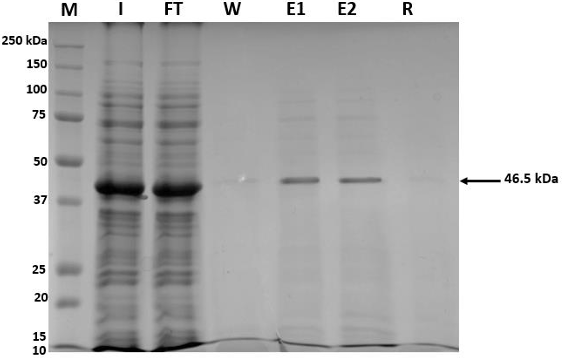
Figure 5. Purification of PMeV-Mx 6xHis-pORF2 with Ni-NTA Agarose under denaturing conditions. M, Bio-Rad 10-250 kDa marker; I, <em>input</em>; Ft, <em>flow-through</em>; E1 and E2, first and second eluates, respectively; R, resin. The arrow indicates the 46.5 kDa 6xHis-pORF2 protein.
Figure 5. Purification of PMeV-Mx 6xHis-pORF2 with Ni-NTA Agarose under denaturing conditions. M, Bio-Rad 10-250 kDa marker; I, input; Ft, flow-through; E1 and E2, first and second eluates, respectively; R, resin. The arrow indicates the 46.5 kDa 6xHis-pORF2 protein.
Figure 6. Detection of PMeV-Mx 6xHis-pORF2 in <em>E. coli</em> crude lysate with anti-pORF2 antibodies. A) Coomassie-stained SDS gel. B) Western blot (Nitrocellulose membrane) incubated with the anti- PMeV-Mx pORF2 polyclonal antibody (dilution 1:1000), and the anti-rabbit coupled to horseradish peroxidase (HRP) secondary antibody (dilution 1:3000). M, Bio-Rad 10-250 kDa marker; NI, non-induced cellular fraction. 6xHis-pORF1 and 6xHis GST-8xHis were used as negative controls. The arrow indicates the 46.5 kDa 6xHis-ORF2 protein.
Figure 6. Detection of PMeV-Mx 6xHis-pORF2 in E. coli crude lysate with anti-pORF2 antibodies. A) Coomassie-stained SDS gel. B) Western blot (Nitrocellulose membrane) incubated with the anti- PMeV-Mx pORF2 polyclonal antibody (dilution 1:1000), and the anti-rabbit coupled to horseradish peroxidase (HRP) secondary antibody (dilution 1:3000). M, Bio-Rad 10-250 kDa marker; NI, non-induced cellular fraction. 6xHis-pORF1 and 6xHis GST-8xHis were used as negative controls. The arrow indicates the 46.5 kDa 6xHis-ORF2 protein.
  • Vol. 2025, 43(2)
  • Phytopathological Note

First report of Fusarium sulawesiensis (FIESC 16) and Fusarium pernambucanum (FIESC 17) as causal agents of blight in roselle (Hibiscus sabdariffa) calyces in Mexico

byCandelario Ortega Acosta, Daniel Leobardo Ochoa Martínez*, Santo Ángel Ortega Acosta, Javier Hernández Morales, Francisco Palemón Alberto

Received: 28/February/2025 – Published: 30/April/2025
DOI: https://doi.org/10.18781/R.MEX.FIT.2502-1

Abstract Background/Objective. In the roselle (Hibiscus sabdariffa) producing area of the state of Guerrero, Mexico, plantations with a high incidence of calyx blight were detected. The aim of this study was to know the causal agent of this disease.

Materials and Methods. Calyces with and without symptoms of the “Criolla de Guerrero”, “Sudán” and “China Negra” cultivars were gathered from the municipal areas of Ayutla and Tecoanapa, Guerrero. Out of the calyces with symptoms, different fungal strains were isolated, out of which two were selected to perform pathogenicity tests under greenhouse conditions and identified with the amplification and sequencing of the elongation factor -1α (EF-1α) with the primers EF1-728F/EF1-986R.

Results and discussion. The sequences obtained were compared with the ones in the NCBI and Fusarium MLST databases and they corresponded with the Fusarium incarnatum-equiseti (FIESC) 16 and 17 species complexes, currently known as Fusarium sulawesiensis and Fusarium pernambucanum, respectively. In the pathogenicity tests, the inoculated strains induced similar symptoms to those observed in the field. The FIESC complex has been proven to produce the mycotoxin trichothecene. Therefore, studies to determine the presence of this toxin in roselle are required, considering that its main use is the preparation of refreshing beverages, which may be a health risk.

Conclusion. This is the first report of Fusarium sulawesiensis and Fusarium pernambucanum as causal agents of the roselle calyx blight in Mexico and in the world.

Show Figures and/or Tables
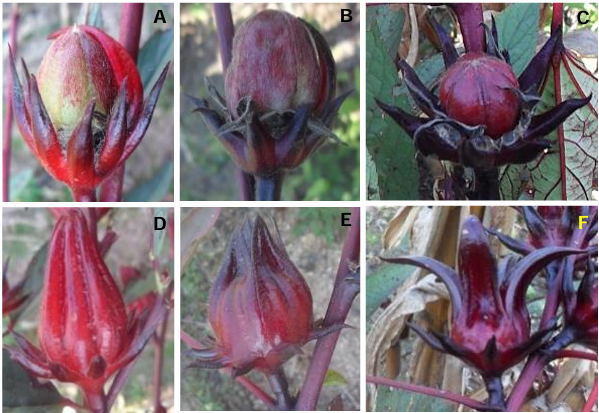
Figure 1. Symptoms of calyx blight in the three roselle cultivars; it can be observed that the capsule is exposed due to the blighting of the calyces; A. “Criolla de Guerrero”. B. “China Negra”. C. “Sudán”. Asymptomatic calyces of the different cultivars; D. “Criolla de Guerrero”, E= “China Negra” and F= “Sudán”.
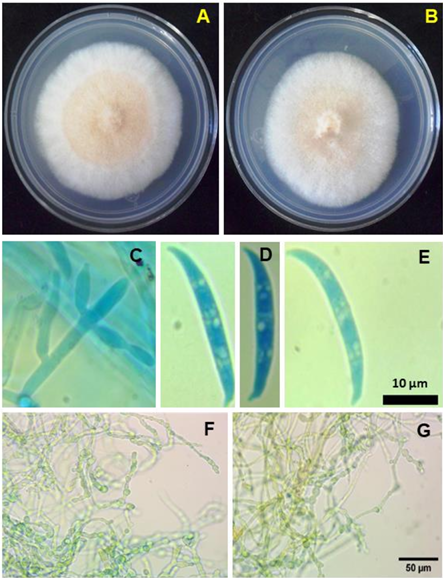
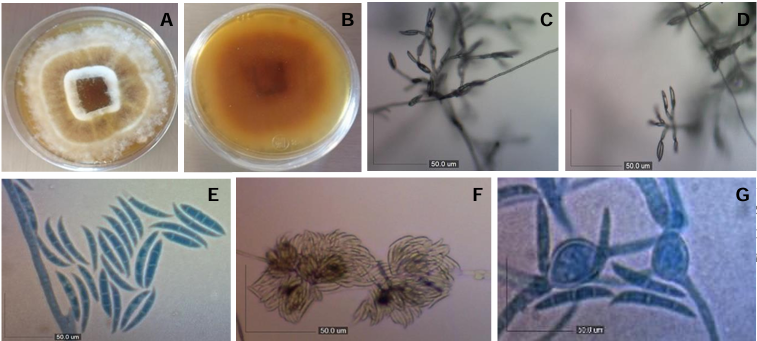
Figure 2. Morphological species of the <em>Fusarium</em> <em>incarnatum</em>-<em>equiseti</em> species complex. A-B = Colonies grown in PDA for one week at 28 °C. A = <em>F. sulawesiensis</em> isolate BOLCHIN. B = F. pernambucanum isolate BOLCRIO. C = Monophialids from the isolate BOLCHIN. D and E = Macroconidia with a foot-shaped <em>F. sulawesiensis</em> and <em>F. pernambucanum</em> basal cells, respectively. F and G = <em>F. sulawesiensis</em> and <em>F. pernambucanum</em>, chain chlamidospores, respectively.
Figure 2. Morphological species of the Fusarium incarnatum-equiseti species complex. A-B = Colonies grown in PDA for one week at 28 °C. A = F. sulawesiensis isolate BOLCHIN. B = F. pernambucanum isolate BOLCRIO. C = Monophialids from the isolate BOLCHIN. D and E = Macroconidia with a foot-shaped F. sulawesiensis and F. pernambucanum basal cells, respectively. F and G = F. sulawesiensis and F. pernambucanum, chain chlamidospores, respectively.
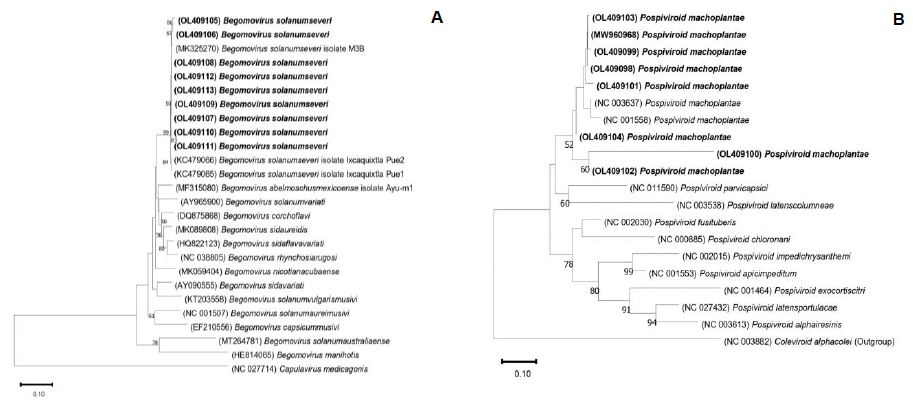
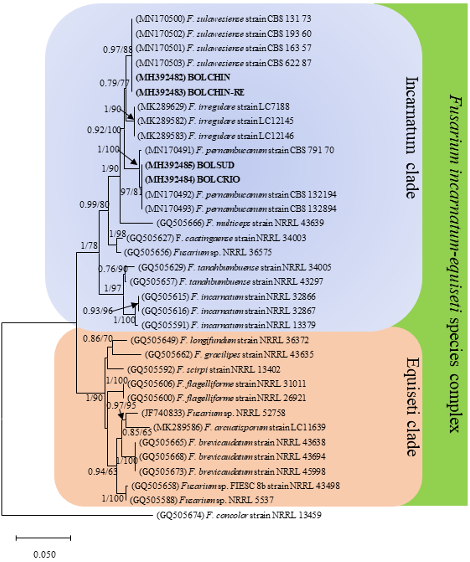
Figure 3. Maximum likelihood (ML) tree, from the <em>Fusarium incarnatum-equiseti</em> species complex, from partial gene EF-1α. A similar topology was generated using Bayesian Inference (BI). Subsequent Bayesian probabilities (PP> 0.5) and the Bootstrap support values (BS> 50) are shown in the nodes (PP/BS). The sequences of this study are in bold. The scale bar indicates the number of expected changes per site. *<em>F. sulawesiense</em> currently recognized as <em>F. sulawesiensis</em> (Xia <em>et al</em>., 2019).
Figure 3. Maximum likelihood (ML) tree, from the Fusarium incarnatum-equiseti species complex, from partial gene EF-1α. A similar topology was generated using Bayesian Inference (BI). Subsequent Bayesian probabilities (PP> 0.5) and the Bootstrap support values (BS> 50) are shown in the nodes (PP/BS). The sequences of this study are in bold. The scale bar indicates the number of expected changes per site. *F. sulawesiense currently recognized as F. sulawesiensis (Xia et al., 2019).
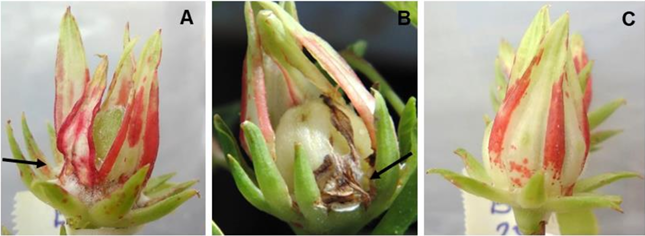
Figure 4. Pathogenicity tests in roselle calyces 12 days after artificial inoculation under greenhouse conditions. A= <em>F. sulawesiensis</em> isolate BOLCHIN. B= <em>F. pernambucanum</em> isolate BOLCRIO. C=Calyx in which only the basal part was injured with a sterile toothpick.
Figure 4. Pathogenicity tests in roselle calyces 12 days after artificial inoculation under greenhouse conditions. A= F. sulawesiensis isolate BOLCHIN. B= F. pernambucanum isolate BOLCRIO. C=Calyx in which only the basal part was injured with a sterile toothpick.
  • Vol. 2025, 43(2)
  • Phytopathological Note

Morphological and molecular characterization of Fusarium incarnatum associated to the malformation of mango (Mangifera indica) in Sinaloa, Mexico

byLeonardo Román Román, Tomás Aarón Vega Gutiérrez, Martín Abraham Tirado Ramírez, Luz Llarely Cázarez Flores, Lorena Molina Cárdenas*, Indira Rojo Báez

Received: 01/July/2024 – Published: 29/April/2025
DOI: https://doi.org/10.18781/R.MEX.FIT.2407-1

Abstract Background/Objective. The malformation in mango is one of the main diseases to attack this crop, and therefore limits its worldwide production. The aim of this study was to identify, morphologically and molecularly, the phytopathogen associated to the malformation of mango in Sinaloa, Mexico.

Materials and methods. In 2018, samples showing malformation symptoms, such as compacted panicles and the eruption of multiple vegetative shoots, were collected from mango orchards in Sinaloa. Based on morphological characteristics, the isolates were identified as Fusarium incarnatum. The molecular identification was carried out by amplifying the partial sequence of the elongation factor gene (TEF-1α) and conducting a phylogenetic analysis. Pathogenicity tests were performed on mango plants through artificial inoculation.

Results. Symptoms on the inoculated plants were observed seven weeks after inoculation, with a disease severity scale rating between 2 and 4; no symptoms were observed in the control plants. The pathogen was re-isolated from symptomatic tissue and identified based on morphology, thus fulfilling Koch’s postulates.

Conclusion. Fusarium incarnatum is repored for the first time as associated with mango malformation in Sinaloa, Mexico.

Show Figures and/or Tables
Table 1. Scale of severity of the malformation disease proposed by Iqbal <em>et al</em>. (2006).
Table 1. Scale of severity of the malformation disease proposed by Iqbal et al. (2006).
Figure 1. A-G. Morphological characteristics of <em>Fusarium incarnatum</em>. A and B) Culture in PDA; C and D) <em>In situ</em> microconidia; E) Microconidia and macroconidia; F) Brown sporodochia; G) Alternated and lone chlamidospores in a CLA culture medium. Bars= 50 μm.
Figure 1. A-G. Morphological characteristics of Fusarium incarnatum. A and B) Culture in PDA; C and D) In situ microconidia; E) Microconidia and macroconidia; F) Brown sporodochia; G) Alternated and lone chlamidospores in a CLA culture medium. Bars= 50 μm.
Figure 2. A–D) Symptoms of malformation in common mango plants inoculated with <em>Fusarium incarnatum</em> (95VESIN and 121FRSIN); E) Control mango plant.
Figure 2. A–D) Symptoms of malformation in common mango plants inoculated with Fusarium incarnatum (95VESIN and 121FRSIN); E) Control mango plant.
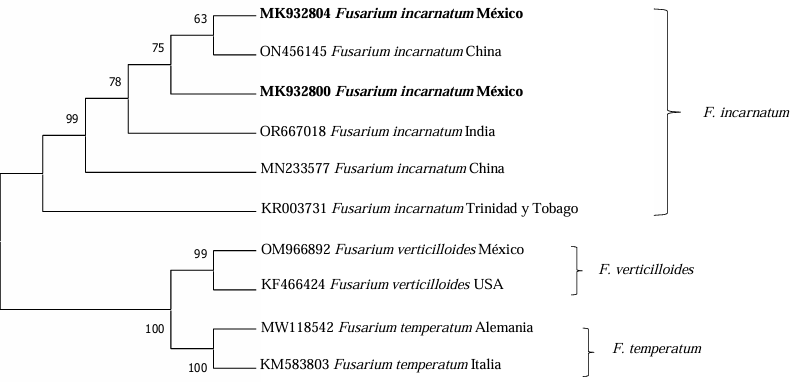
Figure 3. Phylogram inferred by Neighbor Joining for partial sequenced of the TEF-1α gene of <em>Fusarium</em> species. The values in the nodes represent bootstrap scores based on 1000 replicates. Sequences MK932800 and MK932804 originate from the present study.
Figure 3. Phylogram inferred by Neighbor Joining for partial sequenced of the TEF-1α gene of Fusarium species. The values in the nodes represent bootstrap scores based on 1000 replicates. Sequences MK932800 and MK932804 originate from the present study.
  • Vol. 2025, 43(2)
  • Scientific Article

Competitive interaction between Rotylenchulus reniformis and Meloidogyne enterolobii in tomato and cucumber plants

byMaría Trinidad Valdez Morales, José Armando Carrillo Fasio, Raymundo Saúl García Estrada, Josefina León Félix, José Ángel Martínez Gallardo, Juan Manuel Tovar Pedraza*

Received: 22/September/2024 – Published: 29/April/2025
DOI: https://doi.org/10.18781/R.MEX.FIT.2409-2

Abstract Background/Objective. The production of tomato (Solanum lycopersicum) and cucumber (Cucumis sativus) is affected by the nematodes Rotylenchulus reniformis and Meloidogyne enterolobii; however, the interaction between these two nematodes on these plant species is unknown. The aim of this study was to determine the interaction of R. reniformis and M. enterolobii in tomato and cucumber plants through artificial inoculations under greenhouse conditions.

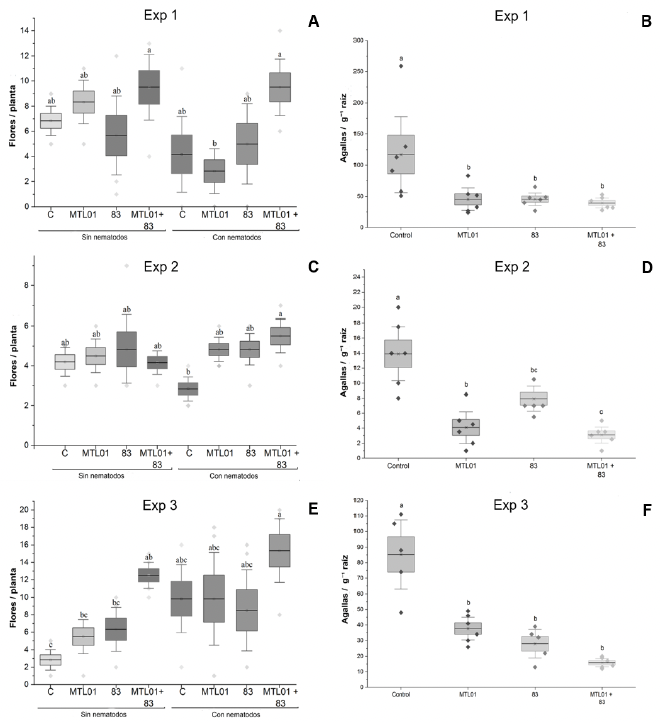
Materials and Methods. Twenty-one-day-old seedlings were inoculated with 2000 juveniles (J2) of each nematode per plant. The experiment followed a completely randomized three-factor design with six treatments: T1= R. reniformis; T2= M. enterolobii; T3= R. reniformis was inoculated and 15 days later M. enterolobii was added; T4 = M. enterolobii was inoculated and 15 days later R. reniformis was added; T5 = both species were inoculated on the same day; T6 = uninoculated control. The reproduction factor (RF) of both nematodes, galling index for M. enterolobii, and root necrosis percentage for R. reniformis were recorded at 30 and 50 days after inoculation.

Results. In cucumber plants, M. enterolobii reduced its reproduction by up to 73% in the presence of R. reniformis, while in tomato plants, its reproduction decreased by 52%, with a reduction in the galling index of 72 and 60% in cucumber and tomato plants, respectively, compared to T1 and T2. On the other hand, R. reniformis reduced its reproduction by 72% in cucumber plants and 67% in tomato plants in the presence of M. enterolobii, and a reduction in symptom severity was observed by 78 and 77% in cucumber and tomato plants, respectively, compared to T1 and T2.

Conclusion. In treatments where one species was inoculated before the other, the species inoculated first showed a higher RF and caused greater disease severity. In simultaneous co-inoculations, both nematodes reduced their RF and caused lower symptom severity in tomato and cucumber plants.

Show Figures and/or Tables
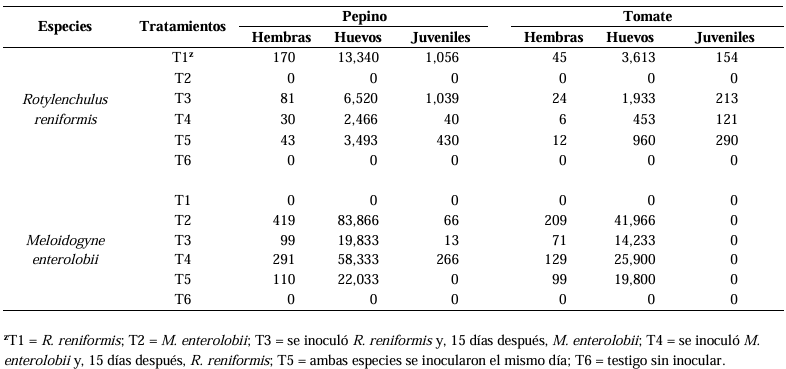
Table 1. Number of females, eggs, and juveniles of <em>R. reniformis</em> and <em>M. enterolobii</em> by treatment in cucumber and tomato plants at 50 days after inoculation.
Table 1. Number of females, eggs, and juveniles of R. reniformis and M. enterolobii by treatment in cucumber and tomato plants at 50 days after inoculation.
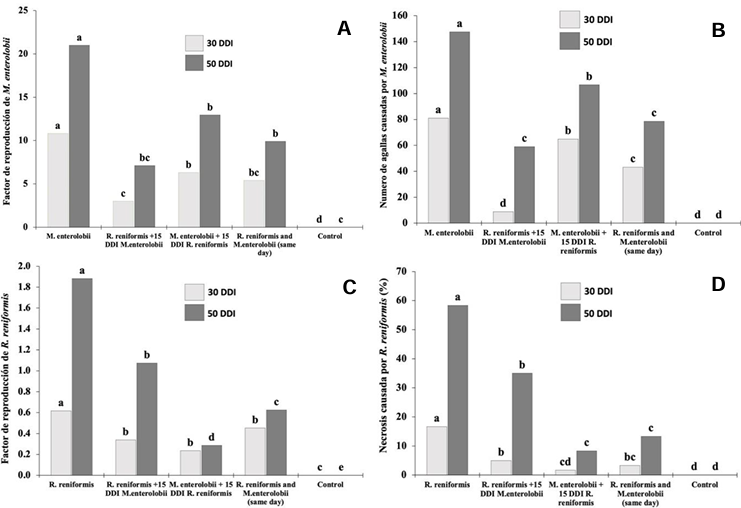
Figure 1. Reproduction and severity of <em>R. reniformis</em> and <em>M. enterolobii</em> in cucumber plants at 30 and 50 days after inoculation (DAI). A) Reproduction factor of <em>M. enterolobii</em>. B) Number of galls caused by <em>M. enterolobii</em>. C) Reproduction factor of <em>R. reniformis</em>. D) Percentage of root necrosis caused by <em>R. reniformis</em>. The comparison of means was conducted between bars of the same color; means that do not share a letter are significantly different.
Figure 1. Reproduction and severity of R. reniformis and M. enterolobii in cucumber plants at 30 and 50 days after inoculation (DAI). A) Reproduction factor of M. enterolobii. B) Number of galls caused by M. enterolobii. C) Reproduction factor of R. reniformis. D) Percentage of root necrosis caused by R. reniformis. The comparison of means was conducted between bars of the same color; means that do not share a letter are significantly different.
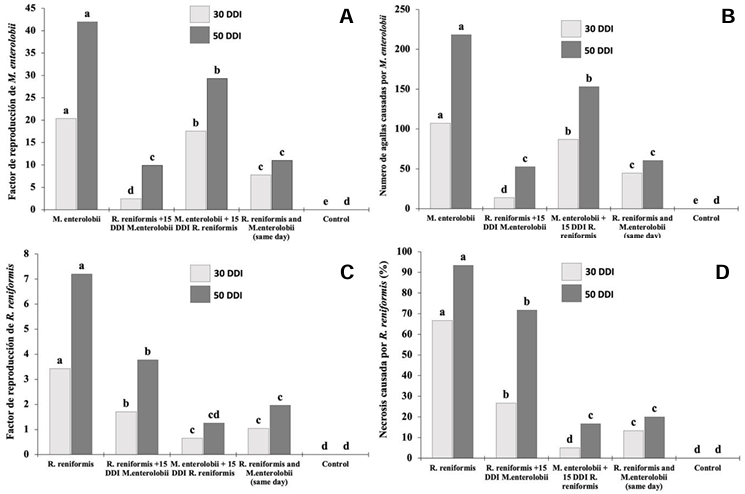
Figure 2. Reproduction and severity of <em>R. reniformis</em> and <em>M. enterolobii</em> in tomato plants at 30 and 50 days after inoculation (DAI). A) Reproduction factor of <em>M. enterolobii</em>. B) Number of galls caused by <em>M. enterolobii</em>. C) Reproduction factor of <em>R. reniformis</em>. D) Percentage of root necrosis caused by <em>R. reniformis</em>. The comparison of means was conducted between bars of the same color; means that do not share a letter are significantly different.
Figure 2. Reproduction and severity of R. reniformis and M. enterolobii in tomato plants at 30 and 50 days after inoculation (DAI). A) Reproduction factor of M. enterolobii. B) Number of galls caused by M. enterolobii. C) Reproduction factor of R. reniformis. D) Percentage of root necrosis caused by R. reniformis. The comparison of means was conducted between bars of the same color; means that do not share a letter are significantly different.
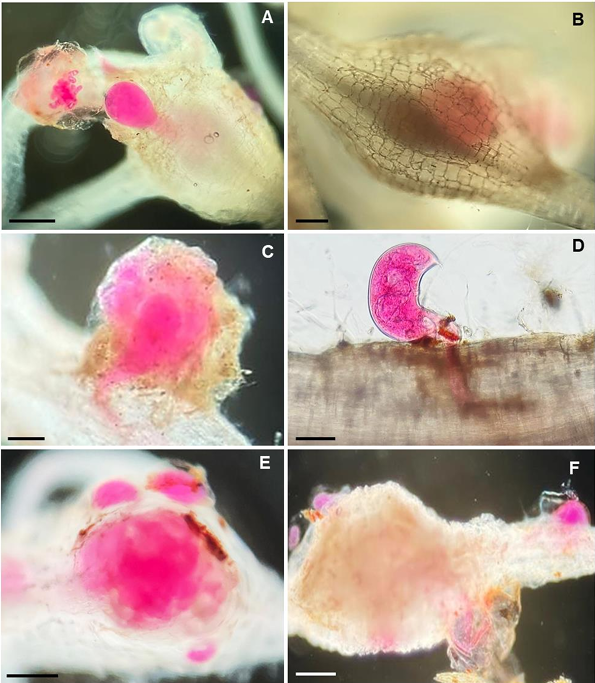
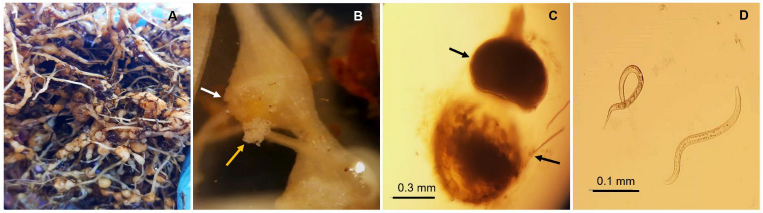
Figure 3. Micrographs of <em>Rotylenchulus reniformis</em> and <em>Meloidogyne enterolobii</em> parasitizing cucumber and tomato roots at 50 days after inoculation (DAI). A) Female of <em>M. enterolobii</em> in cucumber root. B) Female of <em>M. enterolobii</em> causing galls in tomato root. C) Female of <em>R. reniformis</em> affecting cucumber roots. D) Female of <em>R. reniformis</em> in tomato root. E) Cucumber root with a gall caused by <em>M. enterolobii</em> and three mature females of <em>R. reniformis</em> around it. F) Tomato root with a gall from <em>M. enterolobii</em> and necrosis caused by <em>R. reniformis</em>. Scale Bars: A= 300 μm; B, E, F= 500; C, D= 100 μm.
Figure 3. Micrographs of Rotylenchulus reniformis and Meloidogyne enterolobii parasitizing cucumber and tomato roots at 50 days after inoculation (DAI). A) Female of M. enterolobii in cucumber root. B) Female of M. enterolobii causing galls in tomato root. C) Female of R. reniformis affecting cucumber roots. D) Female of R. reniformis in tomato root. E) Cucumber root with a gall caused by M. enterolobii and three mature females of R. reniformis around it. F) Tomato root with a gall from M. enterolobii and necrosis caused by R. reniformis. Scale Bars: A= 300 μm; B, E, F= 500; C, D= 100 μm.
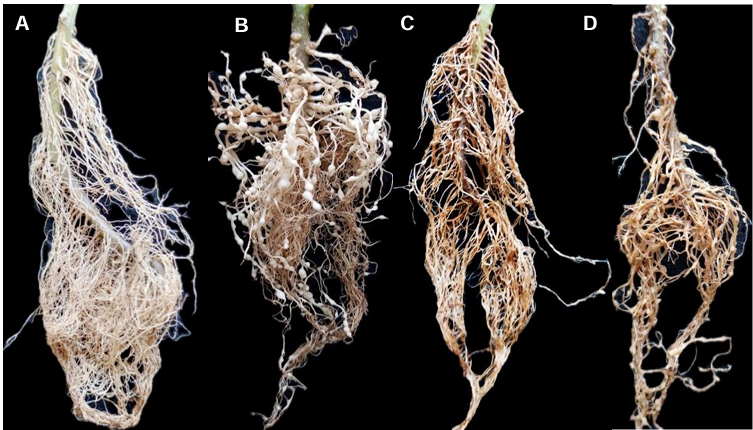
Figure 4. Tomato roots at 50 days after inoculation (DAI). A) Control without inoculation. B) Root with galls caused by <em>M. enterolobii</em>. C) Root with stunting and necrosis caused by R. reniformis. D) Root with galls, necrosis, and stunting symptoms, inoculated with <em>R. reniformis</em> and <em>M. enterolobii</em> simultaneously.
Figure 4. Tomato roots at 50 days after inoculation (DAI). A) Control without inoculation. B) Root with galls caused by M. enterolobii. C) Root with stunting and necrosis caused by R. reniformis. D) Root with galls, necrosis, and stunting symptoms, inoculated with R. reniformis and M. enterolobii simultaneously.
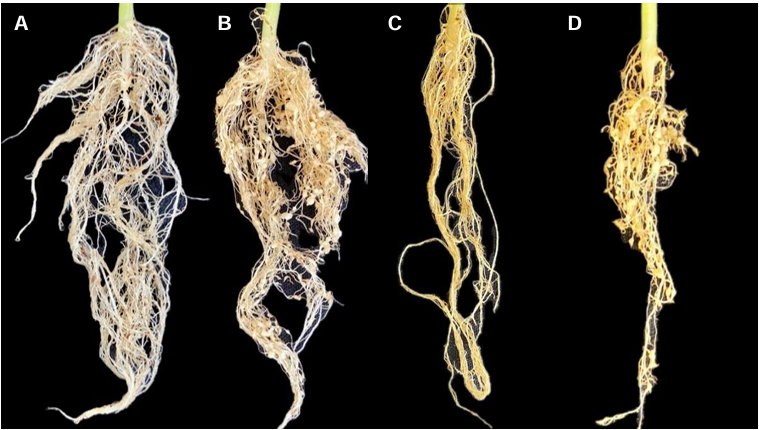
Figure 5. Cucumber roots at 50 days after inoculation (DAI). A) Control without inoculation. B) Root with galls caused by <em>M. enterolobii</em>. C) Root with symptoms of stunting and necrosis caused by <em>R. reniformis</em>. D) Root with galls, necrosis, and stunting symptoms, inoculated with R. reniformis and <em>M. enterolobii</em> simultaneously.
Figure 5. Cucumber roots at 50 days after inoculation (DAI). A) Control without inoculation. B) Root with galls caused by M. enterolobii. C) Root with symptoms of stunting and necrosis caused by R. reniformis. D) Root with galls, necrosis, and stunting symptoms, inoculated with R. reniformis and M. enterolobii simultaneously.
  • Vol. 2025, 43(2)
  • Scientific Article

Etiology of the peduncle ringing of avocado (Persea americana) fruits cv. Hass

byMaría del Carmen Ramírez Mendoza, Rómulo García Velasco*, Juan Carlos Reyes Alemán, Gerardo Justino González Díaz

Received: 02/October/2024 – Published: 24/April/2025
DOI: https://doi.org/10.18781/R.MEX.FIT.2310-3

Abstract Background/Objective. In recent years, a phytopathological problem has manifested itself in avocado cultivation whose etiology is unknown, this disease is known as peduncle ringing, mainly affects fruits of the cv. Hass. The objective of this research was to determine the etiological agent involved in the development of the disease.

Materials and Methods. A collection of avocado fruits was carried out with characteristic symptoms of peduncle ringing: brown peduncle and reddish to purple coloration in the pericarp, the collections were made in the municipalities of Coatepec Harinas, Donato Guerra and Malinalco State of Mexico. In the laboratory, fungi were isolated in PDA medium. Three species of fungi were identified by morphological analysis and confirmed at the DNA level by PCR. Pathogenicity tests were performed on the three species identified individually and in combinations. The variables evaluated were incidence, severity, days at symptom manifestation and percentage of fruits with damaged mesocarp.

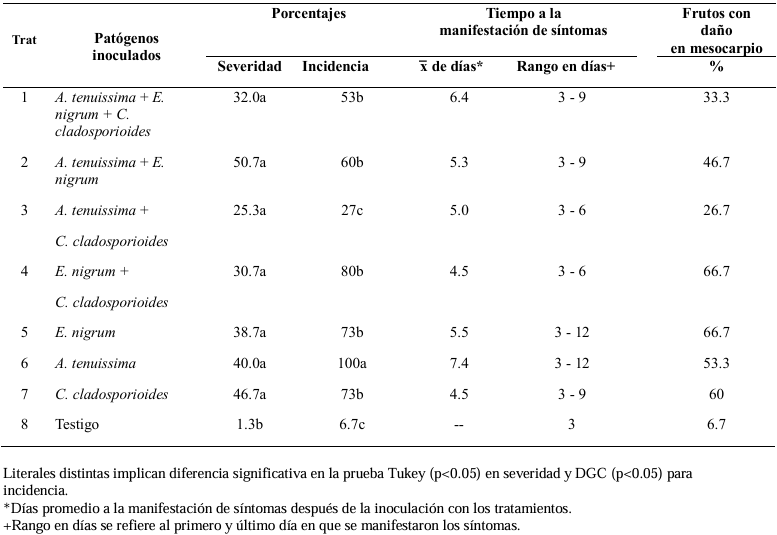
Results. Fungi associated with peduncle ringing damage in avocado fruits cv. Hass were identified as Alternaria tenuissima, Cladosporium cladosporioides and Epicoccum nigrum. A. tenuissima showed its high pathogenic capacity to induce peduncle ringing in avocado fruits with 100% incidence and 40% severity. It should be noted that the data on incidence, severity and mesocarp damage are higher in treatments when A. tenuissima, C. cladosporioides and E. nigrum act independently than in consortia.

Conclusion. A. tenuissima, C. cladosporioides and E. nigrum inoculated independently and in consortia were shown to replicate the symptoms of ringing: peduncle in brown-colored fruits and reddish to purple coloration on the pericarp and the mummification of fruits.

Show Figures and/or Tables
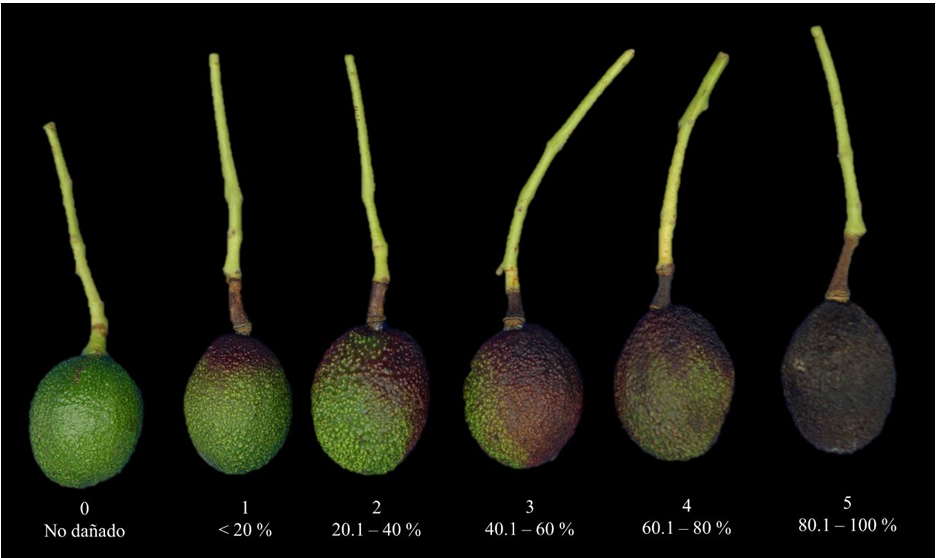
Figure 1. Severity scale for peduncle ringing symptoms in avocado fruits cv. Hass, proposed for assessing lesions in inoculated fruits.
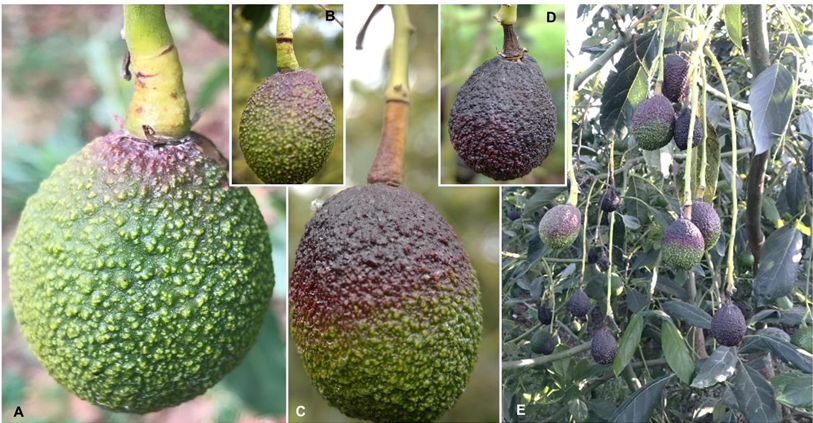
Figure 2. Typical symptoms of peduncle ringing in avocado fruits cv. Hass. A and B) Fruits with dark brown ringing on the peduncle; C) Corky peduncle and fruit with purple coloration on the exocarp; D) Final stage of the ringing symptom, mummified avocado fruit with necrotic peduncle; E) Branch with fruits in different stages of ringing development.
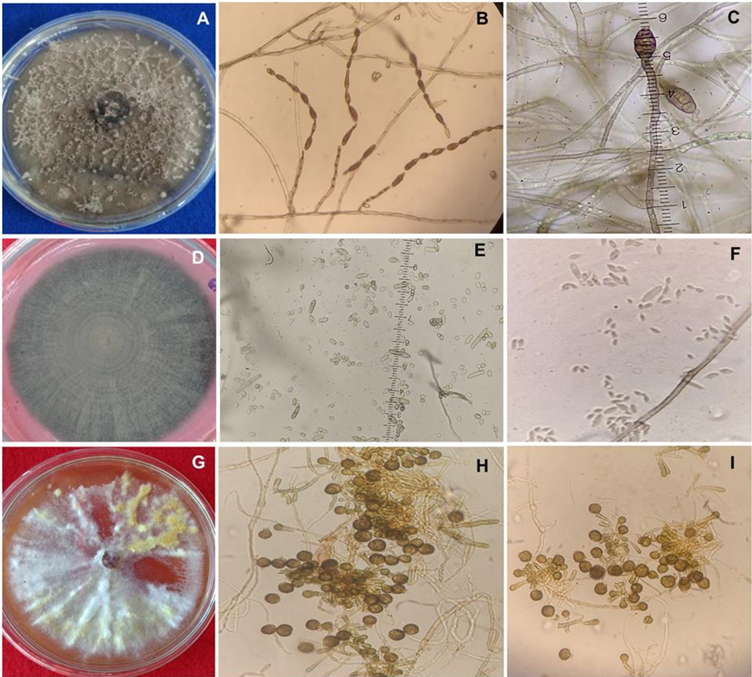
Figure 3. Cultural and morphometric characteristics of <em>Alternaria tenuissima</em>, <em>C. cladosporioides</em> and <em>E. nigrum</em>. A) Colony of <em>A. tenuissima</em> flat growth grown in PCA medium. B) Chain conidia of 4-13 originating from primary conidiophores of erect growth. C) Measurement of muriform conidia with micrometric ruler. D) Colony of <em>C. cladosporioides</em> with flocy micelium grown in PDA medium, front. E) Measurement of unicellular-cell conidia. F) Solitary conidia detached from the conidiophore. G) Colony of <em>Epicoccum nigrum</em> flat growth and development of cottony mycelium in PDA medium. H) Formation of multicelular chlamydospores. I) Septate mycelium and globose chlamydospores of <em>E. nigrum</em>.
Figure 3. Cultural and morphometric characteristics of Alternaria tenuissima, C. cladosporioides and E. nigrum. A) Colony of A. tenuissima flat growth grown in PCA medium. B) Chain conidia of 4-13 originating from primary conidiophores of erect growth. C) Measurement of muriform conidia with micrometric ruler. D) Colony of C. cladosporioides with flocy micelium grown in PDA medium, front. E) Measurement of unicellular-cell conidia. F) Solitary conidia detached from the conidiophore. G) Colony of Epicoccum nigrum flat growth and development of cottony mycelium in PDA medium. H) Formation of multicelular chlamydospores. I) Septate mycelium and globose chlamydospores of E. nigrum.
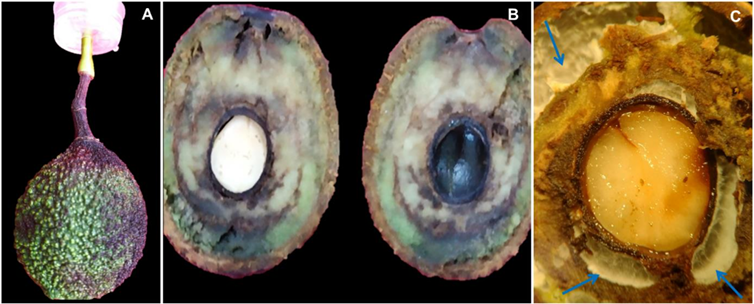
Figure 4. Symptomatology developed in fruits inoculated with <em>Epicoccum nigrum</em>. A) Fruit with peduncle damage and purplish discoloration on the exocarp. B) Longitudinal section of the fruit showing brown to dark lesions in the mesocarp. C) Mycelial growth in the cavities of the fruit mesocarp, observed under a stereoscopic microscope.
Figure 4. Symptomatology developed in fruits inoculated with Epicoccum nigrum. A) Fruit with peduncle damage and purplish discoloration on the exocarp. B) Longitudinal section of the fruit showing brown to dark lesions in the mesocarp. C) Mycelial growth in the cavities of the fruit mesocarp, observed under a stereoscopic microscope.
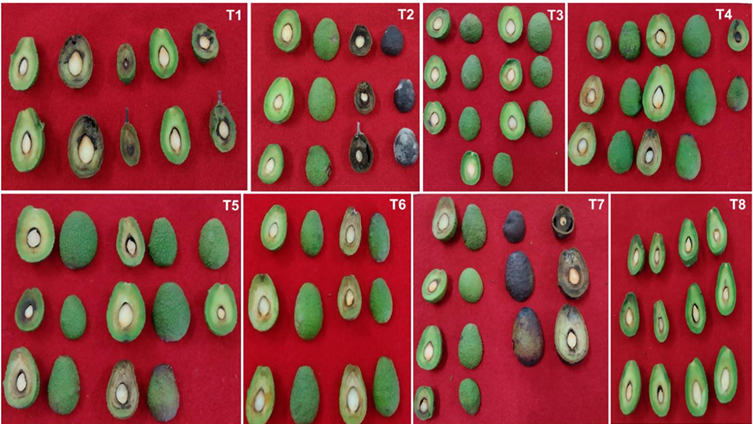
Figure 5. Symptoms observed in fruits inoculated with the different fungi, both in combination and individually: T1) <em>A. tenuissima</em> + <em>E. nigrum</em> + <em>C. cladosporioides</em>. T2) <em>A. tenuissima</em> + <em>E. nigrum</em>. T3) <em>A. tenuissima</em> + <em>C. cladosporioides</em>. T4) <em>E. nigrum</em> + <em>C. cladosporioides</em>. T5) <em>E. nigrum</em>. T6) <em>A. tenuissima</em>. T7) <em>C. cladosporioides</em>. T8) Control.
Figure 5. Symptoms observed in fruits inoculated with the different fungi, both in combination and individually: T1) A. tenuissima + E. nigrum + C. cladosporioides. T2) A. tenuissima + E. nigrum. T3) A. tenuissima + C. cladosporioides. T4) E. nigrum + C. cladosporioides. T5) E. nigrum. T6) A. tenuissima. T7) C. cladosporioides. T8) Control.
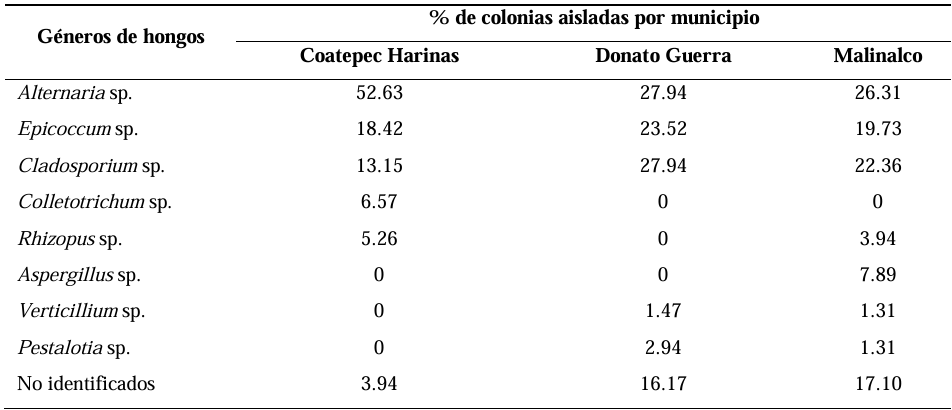
Table 1. Frequency of fungi isolated from peduncles of avocado fruits cv. Hass collected from commercial orchards in the municipalities of Coatepec Harinas, Donato Guerra, and Malinalco, State of Mexico, Mexico.
Table 2. Incidence, severity, and time to symptom appearance in avocado fruits cv. Hass inoculated with A. tenuissima, <em>C. cladosporioides</em>, <em>E. nigrum</em>, and their combinations.
Table 2. Incidence, severity, and time to symptom appearance in avocado fruits cv. Hass inoculated with A. tenuissima, C. cladosporioides, E. nigrum, and their combinations.
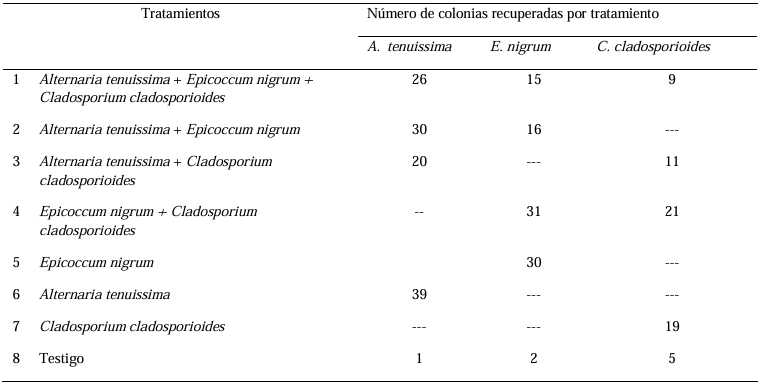
Table 3. Number of colonies and fungal species recovered from <em>in vitro</em> pathogenicity tests on avocado fruits cv. Hass.
Table 3. Number of colonies and fungal species recovered from in vitro pathogenicity tests on avocado fruits cv. Hass.
  • Vol. 2025, 43(2)
  • Scientific Article

Characterization and identification of Burkholderia glumae in seeds of rice (Oryza sativa) varieties planted in Mexico

byGabriel Alejandro Hernández Nava, Sergio Aranda Ocampo*, Guadalupe Valdovinos Ponce, Obdulia Segura León, Mónica Osnaya González, Eridani García Vázquez, Sergio Ramírez Rojas, Leonardo Hernández Aragón

Received: 19/August/2024 – Published: 21/April/2025
DOI: https://doi.org/10.18781/R.MEX.FIT.2408-3

Abstract Backgrounds/Objectives. Burkholderia glumae is the most important pathogen transmitted through seeds that reduces the yield of rice (Oryza sativa). In 2022, seeds were found with symptoms of glume blotch in Mexico. The aim of this investigation was to characterize and identify the causal agent of the symptoms of glume blotch of 11 varieties of rice planted in Mexico.

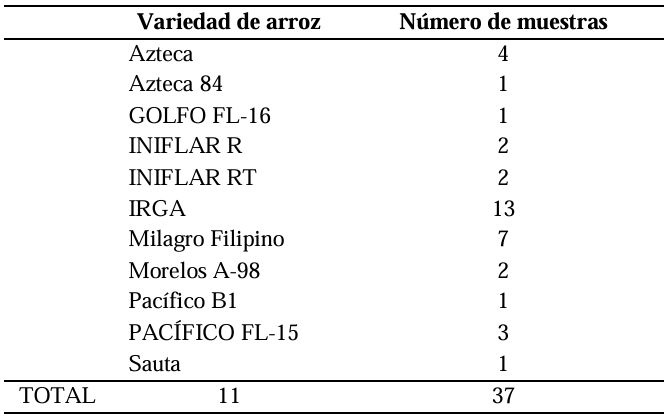
Materials and Methods. A total of 37 seeds samples were analyzed. From each sample, 1 g of seed was disinfested with sodium hypochlorite and macerated in a PBS buffer and subsequently streaked onto SPG, B de King and Wilbrinks culture media. The isolated bacterial strains were characterized by API20 and identified by amplification and partial sequencing of universal and specific genes. Pathogenicity was evaluated using a 3.5 x 10⁸ CFU mL-1 suspension on rice seeds and seedlings of the Milagro Filipino and INIFLAR R varieties.

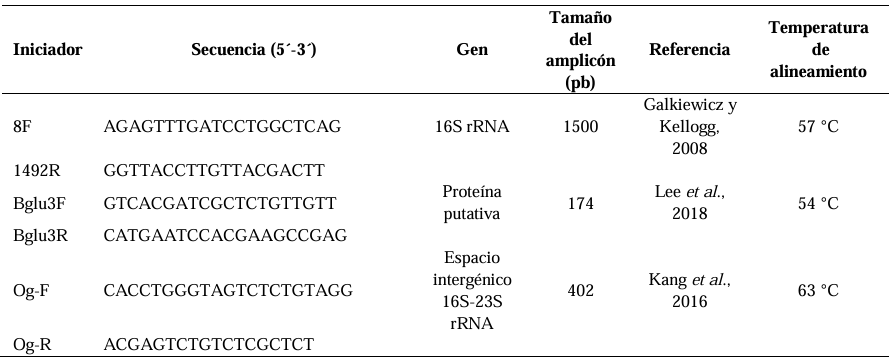
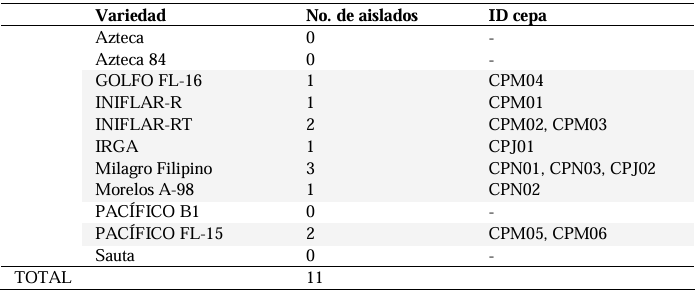
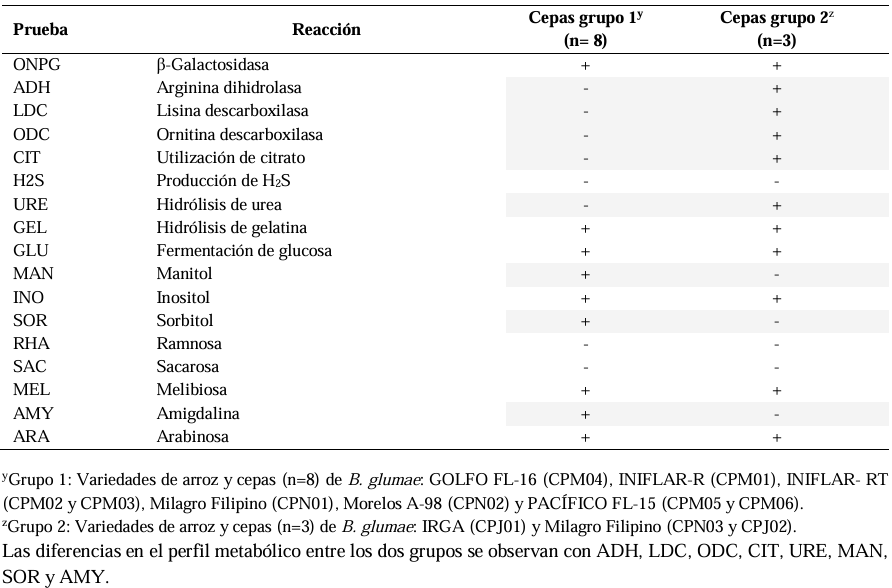
Results. Out of 37 samples, in nine (24.3 %), 11 isolates were taken with the morphology described for B. glumae. Characterization by API20 identified two groups with different metabolic profiles between the 11 strains. With PCR, the 11 strains were identified with a coverage of 100% as B. glumae with the universal primers 8F-1492R, and specific to B. glumae Bglu3F-Bglu3R and OgF-OgR. The pathogenicity of B. glumae was confirmed in rice seeds and seedlings of the Milagro Filipino and INIFLAR-R varieties.

Conclusion. B. glumae is the causal agent of the symptoms of glume blotch in rice seeds, and it was detected in seeds from seven varieties (63.6 %): GOLFO FL-16, INIFLAR-R, INIFLAR-RT, IRGA, Milagro Filipino, Morelos A-98 and PACÍFICO FL-15 of 11 rice varieties planted in Mexico.

Show Figures and/or Tables
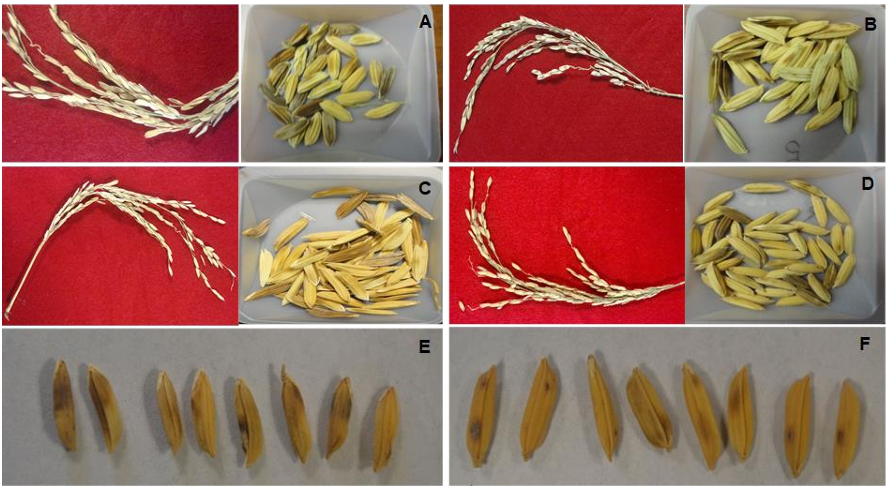
Figure 1. Symptoms of glume blotch in panicles and seeds in the rice varieties: <strong>A</strong>. MILAGRO FILIPINO, <strong>B</strong>. MORELOS A 98, <strong>C</strong>. PACÍFICO FL-15, <strong>D</strong>. IRGA. Symptoms of blotch in seeds of the rice varieties: <strong>E</strong>. MILAGRO FILIPINO, <strong>F</strong>. MORELOS A-98.
Figure 1. Symptoms of glume blotch in panicles and seeds in the rice varieties: A. MILAGRO FILIPINO, B. MORELOS A 98, C. PACÍFICO FL-15, D. IRGA. Symptoms of blotch in seeds of the rice varieties: E. MILAGRO FILIPINO, F. MORELOS A-98.
Figure 2. Morphological characteristics of the bacterial colonies isolated from rice seeds with symptoms of glume blotch. Culture of the colonies at 28 °C for 72 h in a culture medium. <strong>A</strong>. Sucrose-phosphate-glutamate (S-PG), <strong>B</strong>. King’s B, <strong>C</strong>. Wilbrinks.
Figure 2. Morphological characteristics of the bacterial colonies isolated from rice seeds with symptoms of glume blotch. Culture of the colonies at 28 °C for 72 h in a culture medium. A. Sucrose-phosphate-glutamate (S-PG), B. King’s B, C. Wilbrinks.
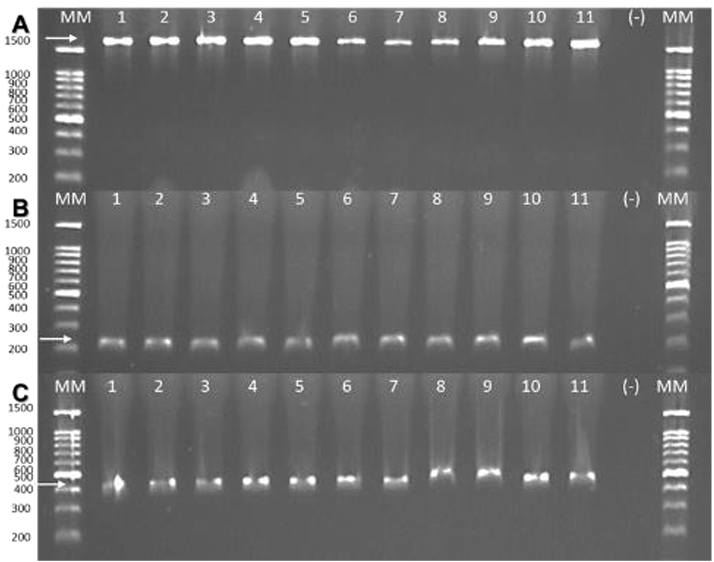
Figure 3. Detection of <em>B. glumae</em> by endpoint PCR. Partial amplification of the following genes: <strong>A</strong>. 16S rRNA with primers 8F-1492R (1500 bp). <strong>B</strong>. Putative protein with primers Bglu3 (174 bp). <strong>C</strong>. 16S-23S rRNA intergenic spacer region with primers Og (402 bp). Lane 1: INIFLAR-R (CPM01); lanes 2-3: INIFLAR-RT (CPM02 and CPM03, respectively); Lane 4: GOLFO FL-16 (CPM04); lanes 5-6: PACÍFICO FL-15 (CPM05 and CPM06, respectively); Lanes 7-9: Milagro Filipino (CPN01, CPN03 and CPJ02, respectively); Lane 10: IRGA (CPJ01) and lane 11: Morelos A-98 (CPN02). MM: Molecular marker 100 bp (GOLDBIO); (-): Negative control (sterile distilled water).
Figure 3. Detection of B. glumae by endpoint PCR. Partial amplification of the following genes: A. 16S rRNA with primers 8F-1492R (1500 bp). B. Putative protein with primers Bglu3 (174 bp). C. 16S-23S rRNA intergenic spacer region with primers Og (402 bp). Lane 1: INIFLAR-R (CPM01); lanes 2-3: INIFLAR-RT (CPM02 and CPM03, respectively); Lane 4: GOLFO FL-16 (CPM04); lanes 5-6: PACÍFICO FL-15 (CPM05 and CPM06, respectively); Lanes 7-9: Milagro Filipino (CPN01, CPN03 and CPJ02, respectively); Lane 10: IRGA (CPJ01) and lane 11: Morelos A-98 (CPN02). MM: Molecular marker 100 bp (GOLDBIO); (-): Negative control (sterile distilled water).
Figure 4. Phylogenetic analysis of the fragment of region 16S rRNA of 11 strains of <em>B. glumae</em> isolated in Mexico. Consensus phylogenetic tree inferred by the Maximum likelihood method. Model GTR+G+I and 500 Bootstrap replicates. The <em>Burkholderia gladioli</em> sequence CP098321.1 was included as an outgroup. = B. glumae strains isolated from seeds with symptoms of glume blotch from rice varieties planted in Mexico.
Figure 4. Phylogenetic analysis of the fragment of region 16S rRNA of 11 strains of B. glumae isolated in Mexico. Consensus phylogenetic tree inferred by the Maximum likelihood method. Model GTR+G+I and 500 Bootstrap replicates. The Burkholderia gladioli sequence CP098321.1 was included as an outgroup. = B. glumae strains isolated from seeds with symptoms of glume blotch from rice varieties planted in Mexico.
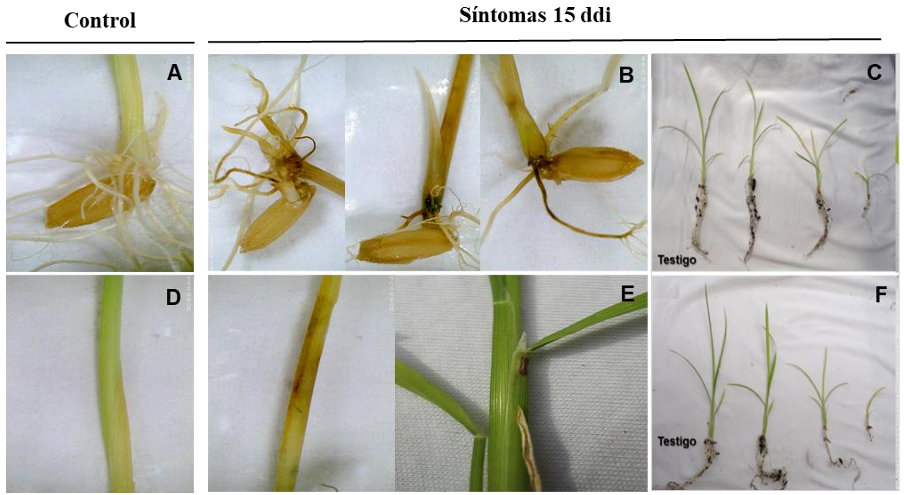
Figure 5. Symptoms induced by <em>B. glumae</em> CPM01 15 dai in rice seeds and seedlings. MILAGRO FILIPINO variety: <strong>A</strong>. Control, submersion of seed in sterile distilled water. <strong>B</strong>. Necrosis and rotting of seeds, roots and stem. <strong>C</strong>. Reduction in growth and abnormal root development. INIFLAR-R variety: <strong>D</strong>. Control, spraying of sterile distilled water on stem. <strong>E</strong>. Necrosis and rotting of seedling stems. F. Reduction in growth and abnormal development of roots.
Figure 5. Symptoms induced by B. glumae CPM01 15 dai in rice seeds and seedlings. MILAGRO FILIPINO variety: A. Control, submersion of seed in sterile distilled water. B. Necrosis and rotting of seeds, roots and stem. C. Reduction in growth and abnormal root development. INIFLAR-R variety: D. Control, spraying of sterile distilled water on stem. E. Necrosis and rotting of seedling stems. F. Reduction in growth and abnormal development of roots.
Table 1. Varieties of rice analyzed to identify the causal agent of the glume blotch in seeds.
Table 2. Primers used for the identification of bacteria isolated from seeds with symptoms of glume blotch in rice varieties planted in Mexico.
Table 3. Bacterial strains with a <em>B. glumae</em> phenotype isolated with symptoms of glume blotch in rice varieties planted in Mexico.
Table 3. Bacterial strains with a B. glumae phenotype isolated with symptoms of glume blotch in rice varieties planted in Mexico.
Table 4. Physiological and biochemical characterización with API 20E from 11 strains with a <em>B. glumae</em> phenotype of rice seeds with symptoms of necrosis in glumes.
Table 4. Physiological and biochemical characterización with API 20E from 11 strains with a B. glumae phenotype of rice seeds with symptoms of necrosis in glumes.
Table 5. Molecular identification of 11 strains isolated from seeds of rice varieties planted in Mexico with symptoms of glume blotch.

Page 7 of 16