RMF Logo

Article filters

Search Papers:

For searching before 2024 see Archive (2000-2023)
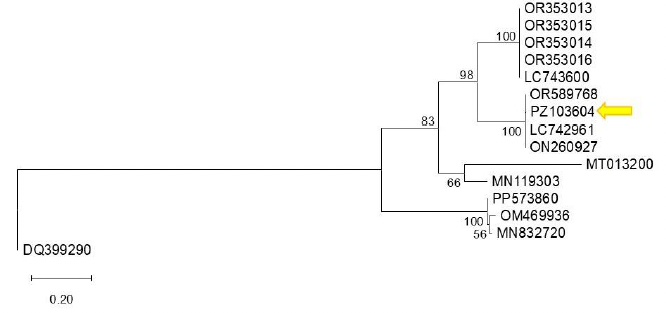
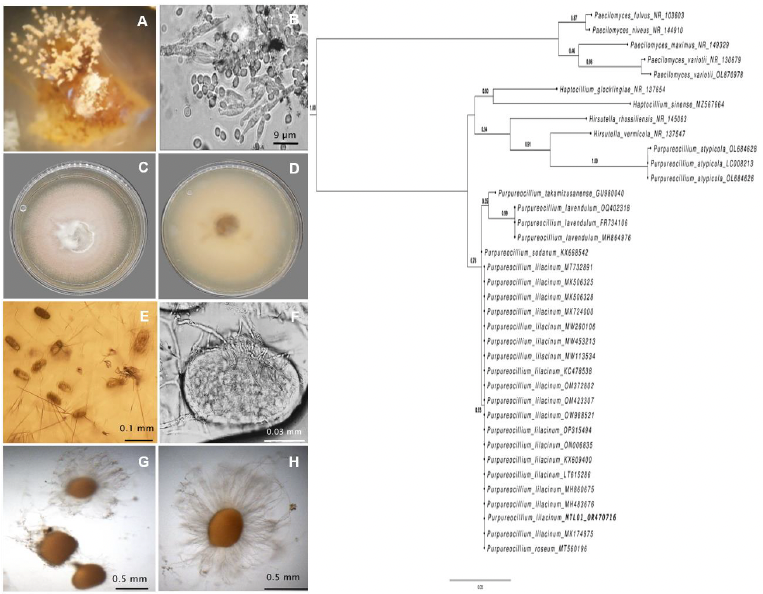
First detection of bell pepper endornavirus infecting bell pepper in Guanajuato, Mexico. Figure 1 - Phylogenetic tree constructed using the Maximum Likelihood method based on the bell pepper endornavirus (BPEV, <em>Alphaendornavirus capsici</em>) polyprotein sequence and other Alphaendornavirus sequences available in GenBank. Reference sequences were selected from GenBank based on their annotation as BPEV isolates and sequence availability. The analysis was performed using the corresponding nucleotide substitution model. Bootstrap support values (1,000 replicates) are indicated at the nodes, showing only those greater than 50%. Sequence PZ103604 (indicated by an arrow) clusters with closely related sequences with high bootstrap support, suggesting a close phylogenetic relationship. Sequence DQ399290 (<em>Betaendornavirus</em>) was used as the outgroup. The scale bar represents 0.20 substitutions per site.

All the Articles

  • Vol. 2025, 43(3)
  • Scientific Article

Identification of molecular markers associated with resistance genes to Puccinia triticina

byYérica Renata Valdez Rodríguez, Julio Huerta Espino, Luis Antonio Mariscal Amaro*, Héctor Eduardo Villaseñor Mir, Elizabeth García León, Eliel Martínez Cruz

Received: 01/May/2024 – Published: 27/August/2025
DOI: https://doi.org/10.18781/R.MEX.FIT.2405-4

Abstract Background/Objective. Wheat is affected by Puccinia triticina, which causes leaf rust, with yield losses exceeding 80% in susceptible varieties. The most viable strategy for managing the disease is the use of varieties with partial resistance, which is expressed with low severity intensity. This requires parents with genes that confer this type of resistance, so wheat materials must be analyzed with molecular markers associated with these genes.

Materials and Methods. In this study, the presence of these markers was determined in advanced wheat lines and recently released varieties. Thirty-four genotypes were evaluated against leaf rust at seedling and adult plant stages, assessing disease severity. Different molecular markers were used to determine the presence of resistance alleles for five genes.

Results. Of the genes analyzed with the markers, Lr34, Lr46, Lr68, and LrB1 were identified. These genes were found alone and in combinations, with lower levels of the disease observed in genotypes with a higher number of these genes.

Conclusion. The use of molecular markers associated with these genes will facilitate the selection of wheat genotypes that can be included in future crossing plans.

Show Figures and/or Tables
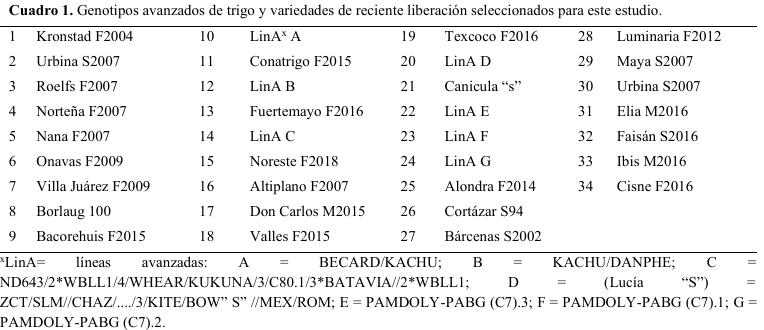
Table 1. Wheat genotypes used in the study.
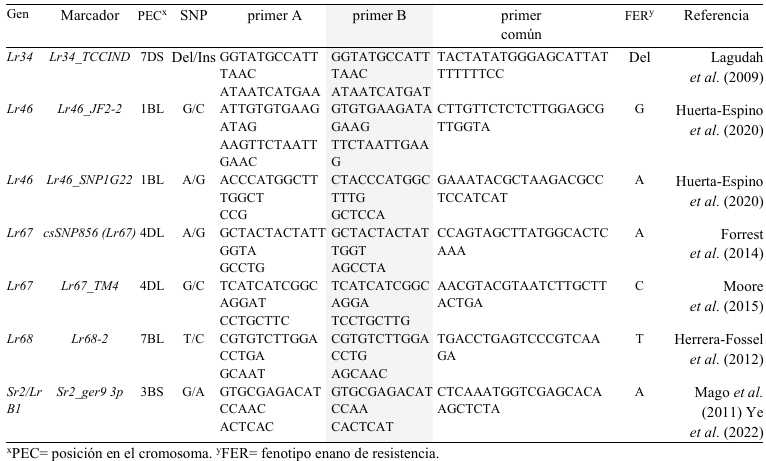
Table 2. Molecular markers used to detect resistance alleles in genes Lr34, Lr46, Lr67, Lr68 y Sr2/LrB1.
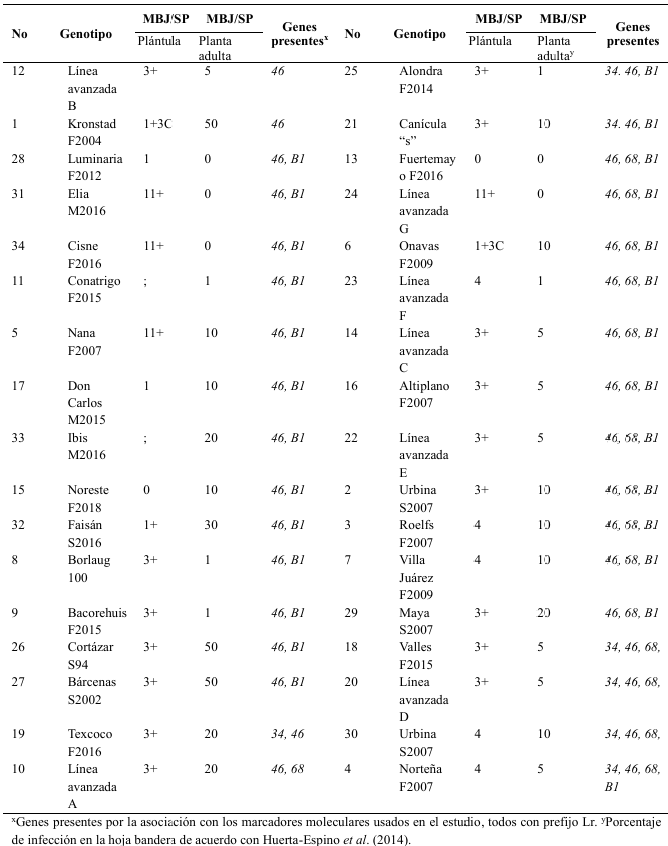
Table 3. Responses of the 34 genotypes evaluated to the race MBJ/SP <em>P. triticina</em> in the seedling and adult stages and the resistance genes.
Table 3. Responses of the 34 genotypes evaluated to the race MBJ/SP P. triticina in the seedling and adult stages and the resistance genes.
  • Vol. 2025, 43(3)
  • Phytopathological Note

Validation of a diagrammatic severity scale to quantify Botrytis fabae damage in faba bean

byErnesto Alonso López Reyes, Álvaro Castaneda Vildózola, Jesús Ricardo Sánchez Pale*, Juyma Mayvé Fragoso Benhumea, Rómulo García Velasco, Andrés Quezada Salinas

Received: 12/November/2024 – Published: 28/August/2025
DOI: https://doi.org/10.18781/R.MEX.FIT.2411-1

Abstract Background/Objective. Faba bean production (Vicia faba) in the Toluca Valley has been considerably affected by Botrytis fabae, therefore, it is necessary to have a diagrammatic severity scale designed to validated and to quantify its damage.

Materials and Methods. 150 leaflets were collected, extracted from three commercial plantations, a visual preselection was carried out based on the presence of symptoms. 138 leaves were digitized to quantify the value of the real damage with the APS PRESS ©Assess 2.0 software. A first visual evaluation (without diagrammatic scale) of the leaves with different degrees of damage was carried out by 20 inexperienced evaluators. A second evaluation was carried out with 10 evaluators, but with support from the scale. The obtained values were analyzed by means of a simple regression.

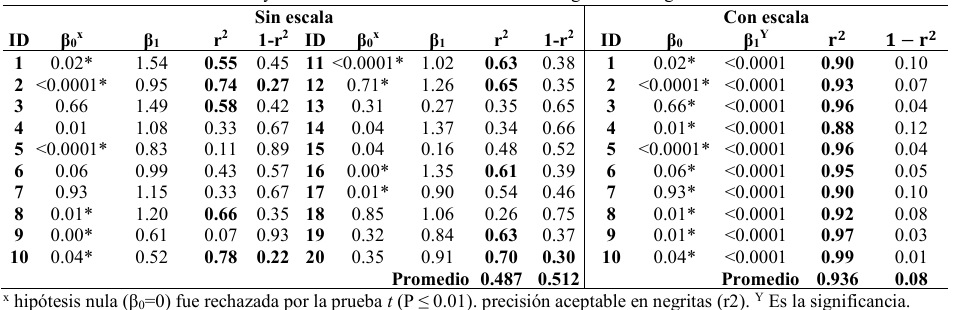
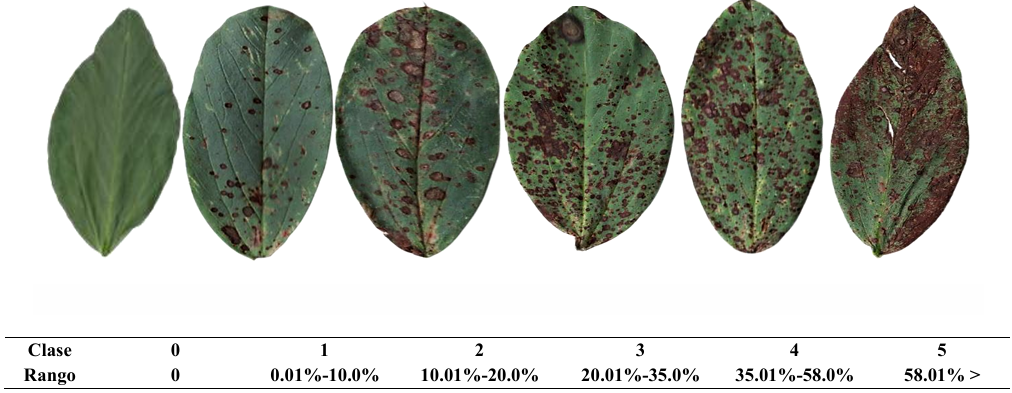
Results. A diagrammatic scale was generated consisting of 6 classes 0(0) 1(0.1-10.0), 2(10.1-20.0), 3(20.01-35.0), 4(35.01-58.0), 5(58.01-100). The results obtained of the simple linear regression, by evaluator, showed for the non-scale evaluation, values of r2 (accuracy) between 0.07-0.78, β1 (precision)=0.0001-0.85 and among evaluators β1 (reproducibility)=0.16-1.54. In contrast, the scale evaluation showed values of r2 =0.88 0.99, β0=0.0001-0.93 8 (by evaluator), and β1=<0.0001 (significant to slope 1.0). These results supported scale validation, respect to its accuracy, precision and reproducibility.

Conclusion. A reliable six-classes diagrammatic logarithmic scale was successfully developed and validated to assess disease severity of chocolate spot caused by Botrytis fabae.

Show Figures and/or Tables
Table 1. Values of the Intercept (β0), slope of the line (β1), determination coefficient (r²) and margin of error (1-r²) of the simple linear regression equation in the visual estimations of the severity of <em>Botrytis fabae</em>, with 20 evaluators without a scale and 10 evaluators with a scale.
Table 1. Values of the Intercept (β0), slope of the line (β1), determination coefficient (r²) and margin of error (1-r²) of the simple linear regression equation in the visual estimations of the severity of Botrytis fabae, with 20 evaluators without a scale and 10 evaluators with a scale.
Figure 1. Diagrammatic severity scale to evaluate chocolate spot caused by <em>Botrytis fabae</em> in faba bean leaves.
Figure 1. Diagrammatic severity scale to evaluate chocolate spot caused by Botrytis fabae in faba bean leaves.
Figure 2. Distribution of residuals (estimated severity-real severity) of the chocolate spot (<em>Botrytis fabae</em>) evaluations in fava bean leaflets. <strong>A</strong>) Evaluation without scale. <strong>B</strong>) Evaluation with scale.
Figure 2. Distribution of residuals (estimated severity-real severity) of the chocolate spot (Botrytis fabae) evaluations in fava bean leaflets. A) Evaluation without scale. B) Evaluation with scale.
  • Vol. 2025, 43(3)
  • Phytopathological Report

First record of Rhizoctonia solani AG-7 causing root rot of common bean in Mexico

byKaren Rabago Zavala, Blanca Elvira López Valenzuela, Fernando Alberto Valenzuela Escoboza*, Glenda Judith Lizárraga Sánchez

Received: 18/September/2024 – Published: 26/August/2025
DOI: https://doi.org/10.18781/R.MEX.FIT.2409-1

Abstract Background/Objective. In November 2020, in two bean (Phaseolus vulgaris) plantations in northern Sinaloa, symptoms of root rot and plant dieback were observed, with an incidence of up to 35% per plot. The present study was established with the aim of identifying, through the sequencing of ITS and RPB2, the pathogens associated with root rot in beans.

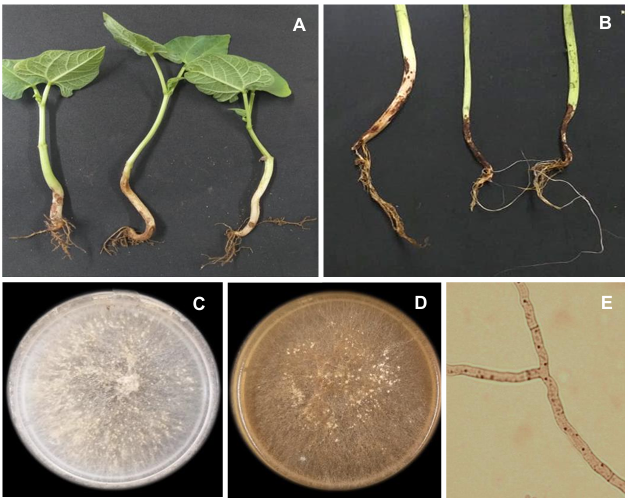
Materials and Methods. Plants with symptoms were selected from bean crops in Ahome, Sinaloa, Mexico. Samples of the lesion advances of the roots of the plants were taken, and fungi with typical morphological characteristics of Rhizoctonia spp. were isolated, which presented septate, hyaline mycelium, forming a right angle and constriction of the basal cell, did not produce spores, and formed sclerotia. Koch's postulates were performed in pots, the inoculum was placed alongside the seed at the time of planting to evaluate the effect on germination and severity in seedlings. Once its pathogenicity was demonstrated, the isolates FAVF397 and FAVF398 were identified molecularly.

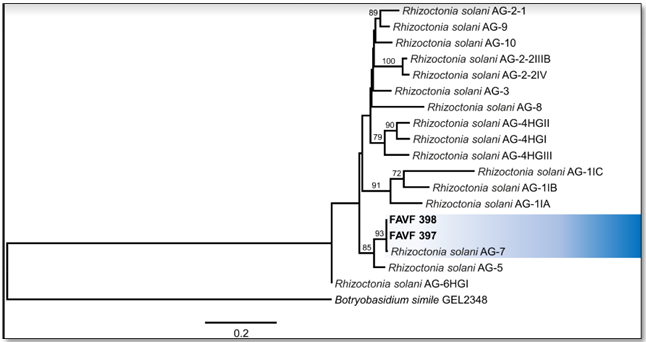
Results. The isolates FAVF397 and FAVF398 were molecularly identified as Rhizoctonia solani AG-7 and are responsible for the root rot of common bean.

Conclusion. The AG7 anastomosis group is reported for the first time in beans in Sinaloa. These findings represent a scientific contribution for the benefit of producers of this crop by allowing the design of relevant and effective management strategies.

Show Figures and/or Tables
Figure 1. <em>Rhizoctonia solani</em> AG-7 causing root rot of the common bean. <strong>A</strong>. Symptoms on naturally infected stems and roots. <strong>B</strong>. Symptoms in artificially inoculated plants, 30 days after inoculation. <strong>C.</strong> Colony on PDA after 7 days at 25 °C in the dark. <strong>D</strong>. Colony on PDA after 20 days. <strong>E</strong>. Hyphae stained with Safranin-O showing multinucleated cells and branching at right angles, slightly constricted at their base.
Figure 1. Rhizoctonia solani AG-7 causing root rot of the common bean. A. Symptoms on naturally infected stems and roots. B. Symptoms in artificially inoculated plants, 30 days after inoculation. C. Colony on PDA after 7 days at 25 °C in the dark. D. Colony on PDA after 20 days. E. Hyphae stained with Safranin-O showing multinucleated cells and branching at right angles, slightly constricted at their base.
Figure 2. Phylogeny by MV of the concatenated sequences of the ITS and RPB2 genes from two isolates of <em>Rhizoctonia</em> spp. obtained from bean plants with symptoms of wilting and root rot. Bootstrap of 1000 replicas; outgroup: <em>Botryobasidium simile</em>. AG=Anastomosis group.
Figure 2. Phylogeny by MV of the concatenated sequences of the ITS and RPB2 genes from two isolates of Rhizoctonia spp. obtained from bean plants with symptoms of wilting and root rot. Bootstrap of 1000 replicas; outgroup: Botryobasidium simile. AG=Anastomosis group.
  • Vol. 2025, 43(3)
  • Phytopathological Note

Genetic diversity of Fusarium oxysporum associated to the banana Fusarium wilt

byGilberto Manzo Sánchez*, Carlos Luis Leopardi Verde, Marco Tulio Buenrostro Nava, Mario Orozco Santos, Blondy Canto Canché

Received: 12/May/2024 – Published: 26/August/2025
DOI: https://doi.org/10.18781/R.MEX.FIT.2405-7

Abstract Background/Objective. The research objective was to analyze Fusarium oxysporum (Fo) isolates from different banana regions from México using SSR markers.

Materials and Methods. Pseudostems of Musa plants exhibiting wilt-disease were sampled from ‘Pisang Awak’ (ABB), ‘Silk’ (AAB), and ‘Bluggoe’ (ABB) varieties collected on commercial orchards of five banana-producing areas of México: Colima, Michoacán, Jalisco, Nayarit, and Yucatán states. Six SSR loci were analyzed for population structure based on 96 Fusarium oxysporum isolates. The number and frequency of haplotypes were calculated in POPGENE. With this data, using the dissimilarity index of Morisita in the R package vegan, the genetic similarity of the populations was estimated. With the haplotype data, we also conducted a molecular analysis of variance (AMOVA) to evaluate the genetic differentiation between regions (FCT), among populations in each region (FSC), and among all populations included in the analysis (FST). Additionally, to illustrate the relations among haplotypes, and their distribution and frequency among sampled populations we generate a minimum spanning network.

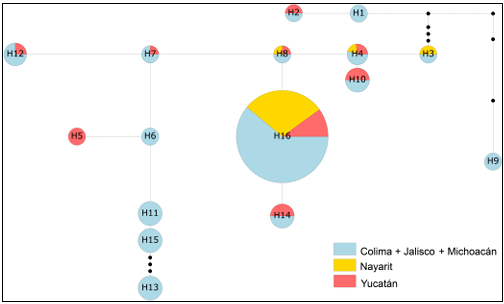
Results. After seven days of PDA culture, all isolates had cottony white mycelia, which can be flat to aerial, and can be colored on the upper surfaces from light violet to dark violet. But on the bottom surfaces, the colony can have colorations from orange to dark red. We observed short monophialides, unicellular or bicellular with oval microconidia. Macroconidia were falciform, and with three to four septa. Putatively, these characteristics fit the F. oxysporum taxonomic criteria. All tested loci were polymorphic across the 96 Foc. We detect 16 haplotypes, of which the most frequent and common was the H16; the others were rare and could be widely dispersed or restricted to one or two populations. Also, we did not find genetic differences among the three analyzed populations, as well as we did not find genetic structure or differentiation at any level. These findings are related to Foc isolates as a complex not necessarily to those related to Foc races.

Conclusion. Our analyses did not detect significant genetic differences between the Fo populations studied, nor did we find genetic structure or differentiation at any level. Therefore, our data suggests that the analyzed populations constitute a single metapopulation, despite the presence of infrequent or unique haplotypes.

Show Figures and/or Tables
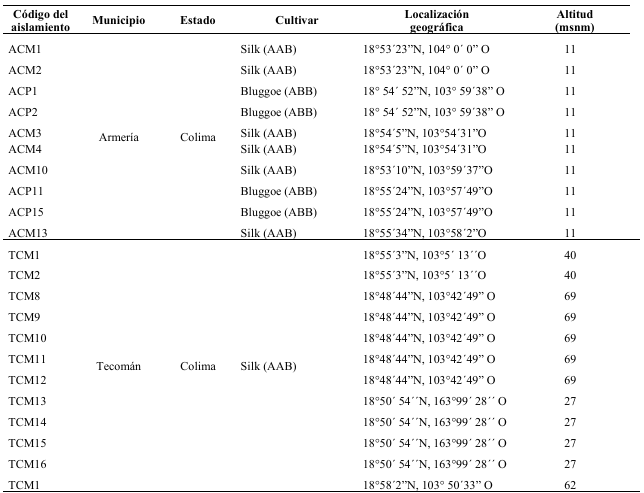
Table 1. Sampling for <em>F. oxysporum</em> from banana commercial orchards at five Mexican states.
Table 1. Sampling for F. oxysporum from banana commercial orchards at five Mexican states.
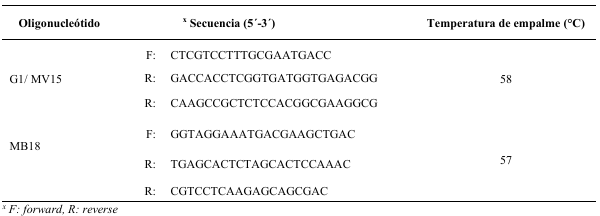
Table 2. Simple sequence repeat (SSR) primers used to analyze <em>Fusarium oxysporum</em> isolates genetic diversity (modified from Bogale <em>et al</em>., 2005).
Table 2. Simple sequence repeat (SSR) primers used to analyze Fusarium oxysporum isolates genetic diversity (modified from Bogale et al., 2005).
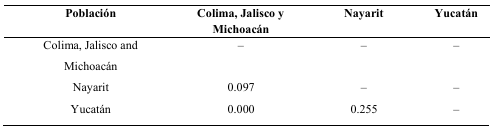
Table 3. Dissimilarity among sampled populations of <em>Fusarium oxysporum</em>.
Table 3. Dissimilarity among sampled populations of Fusarium oxysporum.
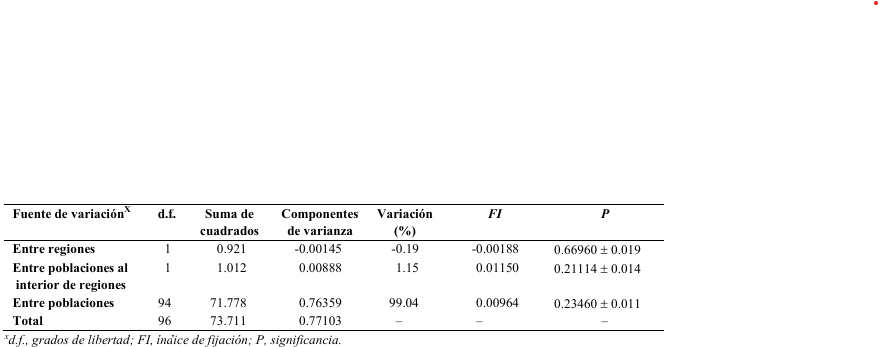
Table 4. Analysis of molecular variance (AMOVA) based on haplotypes associated to 96 isolates of <em>Fusarium oxysporum</em> from Colima, Jalisco, Michoacán, Nayarit and Yucatán state grouped into two regions (East and West México).
Table 4. Analysis of molecular variance (AMOVA) based on haplotypes associated to 96 isolates of Fusarium oxysporum from Colima, Jalisco, Michoacán, Nayarit and Yucatán state grouped into two regions (East and West México).
Figure 1. A minimum spanning network of 16 haplotypes found in the studied populations of <em>Fusarium oxysporum</em>. Small black dots along branches represent missing haplotypes. H withing circles is the ID haplotype, color denote population type, and circle size represents the haplotype frequency.
Figure 1. A minimum spanning network of 16 haplotypes found in the studied populations of Fusarium oxysporum. Small black dots along branches represent missing haplotypes. H withing circles is the ID haplotype, color denote population type, and circle size represents the haplotype frequency.
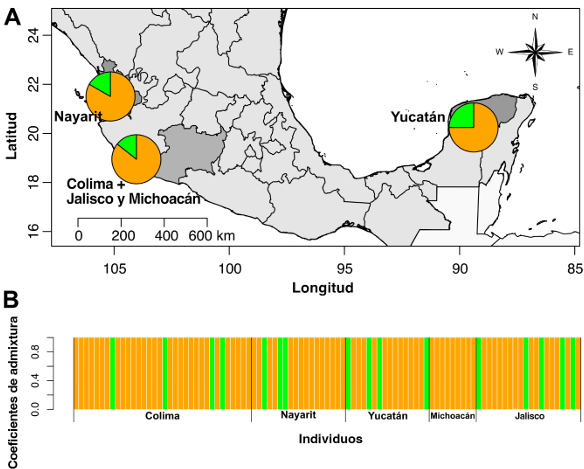
Figure 2. Genetic structure analysis of <em>Fusarium oxysporum</em> isolates from different locations based on sparse nonnegative matrix factorization (sNMF). (A) Population structure for K = 2 plotted on the map using the average ancestry coefficient values for each estimated population. (B) Group assignment probability of each sampled individual.
Figure 2. Genetic structure analysis of Fusarium oxysporum isolates from different locations based on sparse nonnegative matrix factorization (sNMF). (A) Population structure for K = 2 plotted on the map using the average ancestry coefficient values for each estimated population. (B) Group assignment probability of each sampled individual.
  • Vol. 2025, 43(3)
  • Scientific Article

Uromyces viciae-fabae inoculation under controlled conditions

byJorge Pérez Cárcamo*, José Sergio Sandoval Islas, María Florencia Rodríguez García, Serafín Cruz Izquierdo, Cristian Nava Díaz, Olga Gómez Rodríguez

Received: 14/May/2025 – Published: 01/August/2025
DOI: https://doi.org/10.18781/R.MEX.FIT.2505-4

Abstract Background/Objective. The objective was to evaluate incubation and post incubation temperatures, inoculum concentrations, and maleic acid effect to develop an efficient and reproducible method for U. viciae-fabae inoculation in broad bean genotypes.

Materials and methods. The evaluated factors were inoculum concentration, incubation and post-incubation temperatures, maleic acid concentration, and the inoculation method validation. The variables evaluated were type of infection, number of pustules, percentage of severity, pustule size, and latency period. Analysis of variance and comparison of means were performed using the Tukey test (p ≤ 0.05).

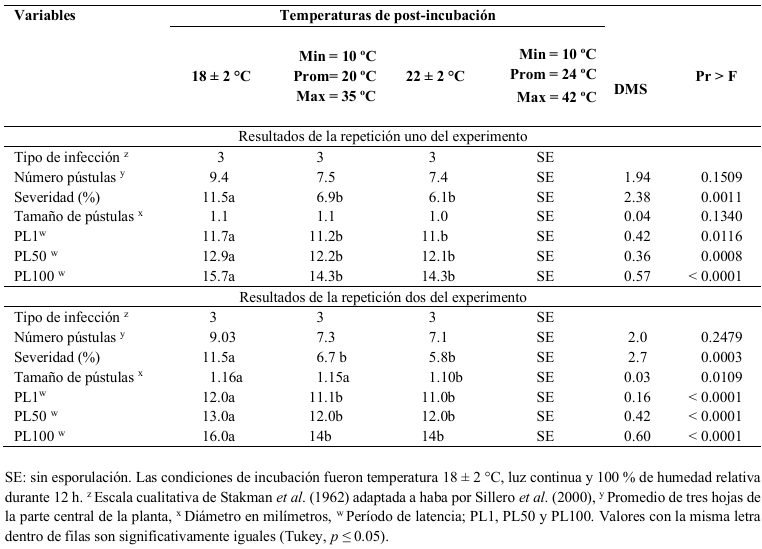
Results. Incubation temperatures of 7 and 18 °C showed no significant differences. A urediniospore concentration of 3 x 10⁶ showed significant differences in the number of pustules and severity. No symptoms were observed in the uncontrolled environment, averaging 24 °C. U. viciae-fabae was able to develop at controlled temperatures of 18 and 22 °C, and at uncontrolled temperatures averaging 20 °C.

Conclusions. Efficient inoculation was achieved with a concentration of 3 × 10⁶ urediniospores per mL-1 at an incubation and post-incubation temperature of 18 °C.

Show Figures and/or Tables
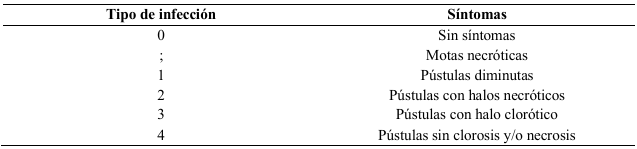
Table 1. Infection type scale proposed by Stakman <em>et al</em>. (1962), adapted to broad bean by Sillero<em> et al</em>. (2000).
Table 1. Infection type scale proposed by Stakman et al. (1962), adapted to broad bean by Sillero et al. (2000).
Table 2. Means of seven variables of the monocycle of the infection and values of p obtained from ICAMEX line 5 broad bean seedlings inoculated with 3 × 10<sup>6</sup> urediniospores mL<sup>-1</sup> of <em>Uromyces viciae-fabae</em> and placed under four post incubation temperatures of two experiments.
Table 2. Means of seven variables of the monocycle of the infection and values of p obtained from ICAMEX line 5 broad bean seedlings inoculated with 3 × 10⁶ urediniospores mL-1 of Uromyces viciae-fabae and placed under four post incubation temperatures of two experiments.
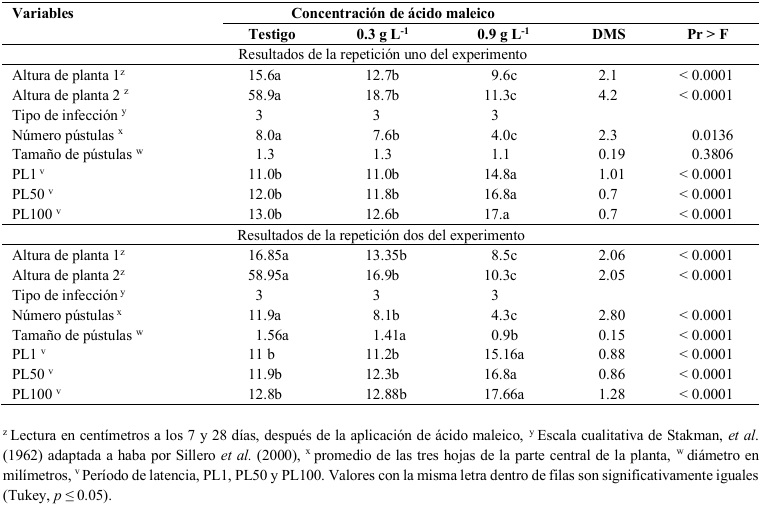
Table 3. Effect of applying maleic acid on the height of broad bean plants from ICAMEX line 5 and six variables of the monocycle of the infection of <em>Uromyces viciae-fabae</em> on two experiments.
Table 3. Effect of applying maleic acid on the height of broad bean plants from ICAMEX line 5 and six variables of the monocycle of the infection of Uromyces viciae-fabae on two experiments.
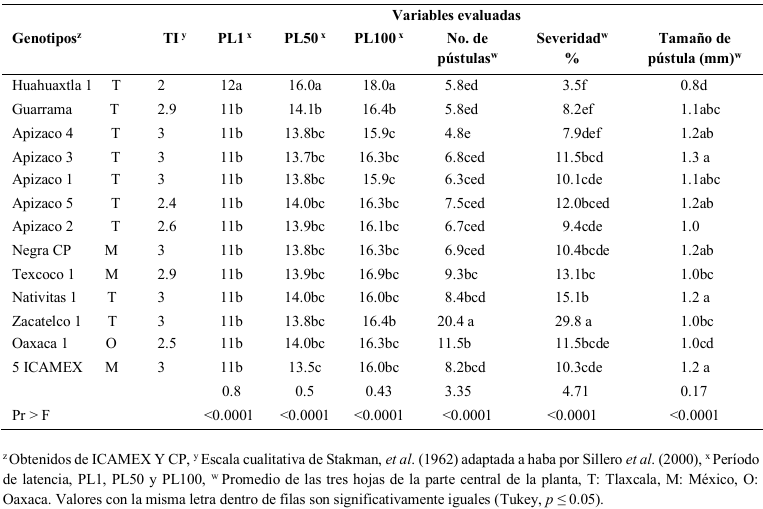
Table 4. Means of seven variables of the monocycle of the infection obtained in seedlings of 13 broad bean genotypes inoculated with <em>Uromyces viciae-fabae</em> urediniospores to know their level of resistance.
Table 4. Means of seven variables of the monocycle of the infection obtained in seedlings of 13 broad bean genotypes inoculated with Uromyces viciae-fabae urediniospores to know their level of resistance.
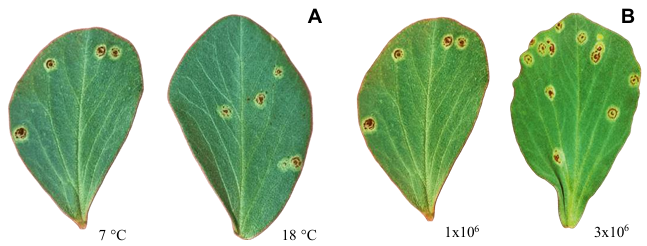
Figure 1. ICAMEX line 5 broad bean leaves with <em>Uromyces viciae-fabae</em> sporulation isolate CP21 28 days after inoculation. A) Leaves inoculated at a concentration of 1 × 10<sup>6</sup> and exposed to two post inoculation temperatures, B) Leaves inoculated with two inoculant concentrations and exposed at 18 °C in post-incubation.
Figure 1. ICAMEX line 5 broad bean leaves with Uromyces viciae-fabae sporulation isolate CP21 28 days after inoculation. A) Leaves inoculated at a concentration of 1 × 10⁶ and exposed to two post inoculation temperatures, B) Leaves inoculated with two inoculant concentrations and exposed at 18 °C in post-incubation.
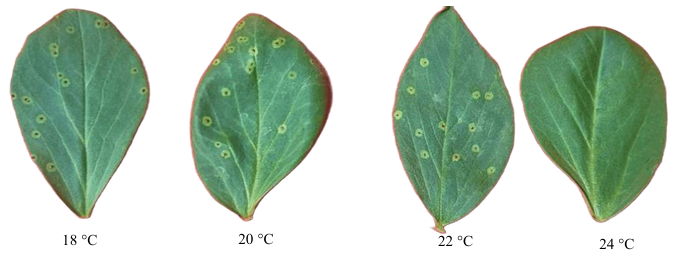
Figure 2. Broad bean leaves from ICAMEX line 5 showing the beginning of sporulation 13 days after being inoculated with 3 × 10<sup>6</sup> urediniospores mL<sup>-1</sup> of the CP21 isolate of de <em>Uromyces viciae-fabae</em> and kept in a greenhouse under four post-incubation temperatures.
Figure 2. Broad bean leaves from ICAMEX line 5 showing the beginning of sporulation 13 days after being inoculated with 3 × 10⁶ urediniospores mL-1 of the CP21 isolate of de Uromyces viciae-fabae and kept in a greenhouse under four post-incubation temperatures.
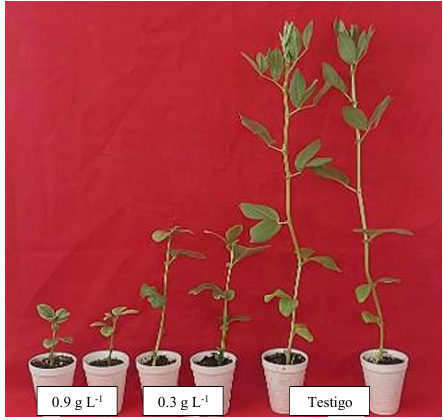
Figure 3. Differences in the growth of broad bean plants from ICAMEX line 5 treated with two maleic acid concentrations.
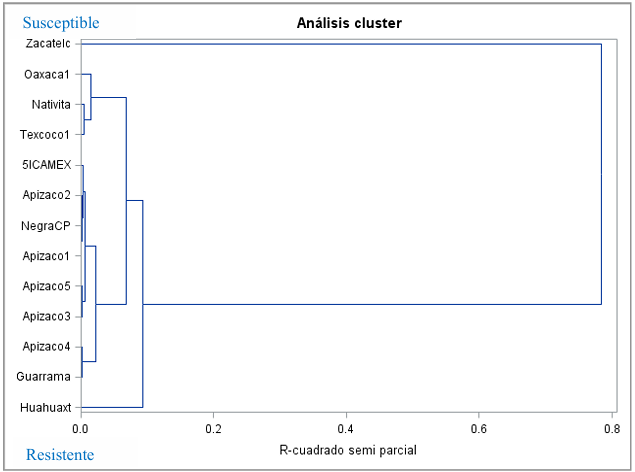
Figure 4. Dendrogram of the resistance and susceptibility of 13 broad bean genotypes to <em>U. viciae-fabae</em> under controlled conditions, created from the multivariate analysis of all the variables evaluated.
Figure 4. Dendrogram of the resistance and susceptibility of 13 broad bean genotypes to U. viciae-fabae under controlled conditions, created from the multivariate analysis of all the variables evaluated.
  • Vol. 2025, 43(4)
  • Review Article
  • Special Issue

Allspice (Pimenta dioica) in Mexico and the use of antagonistic microorganisms for rust and anthracnose control

byMarco Antonio Morales German, Marja Liza Fajardo Franco*, Martin Aguilar Tlatelpa

Received: 20/November/2024 – Published: 01/August/2025
DOI: https://doi.org/10.18781/R.MEX.FIT.2024-35

Abstract Background/Objective. The allspice (Pimenta dioica) has different uses as a spice and potential utility in the pharmaceutical and cosmetic industry, making it a species of economic importance. Mexico is the world's second largest producer of this spice, which is cultivated mainly by indigenous peoples. Allspice has a high potential to increase its production in Mexico, due to favorable agroclimatic conditions. However, the presence of diseases, especially anthracnose and rust, is a limitation. The objective was to document the production of allspice in Mexico and to identify management alternatives using antagonistic microorganisms against the occurrence of anthracnose (Colletotrichum sp.) and rust (Austropuccinia psidii).

Materials and Methods. An exhaustive search was carried out in digital platforms, particularly in Google Scholar, ResearchGate, SciELO and ScienceDirect, for which different combinations of keywords were used to facilitate the search, which were: Pimenta dioica, allspice, diseases, production, cultivation, pimienta and Jamaica pepper in spanish and english. The information was systematized and critically analyzed.

Results. Allspice production in Mexico has increased in recent years, but it is not sufficient to cover the market. Likewise, information regarding the management of anthracnose and rust in pepper is scarce; however, it has been documented that Bacillus sp., Trichoderma sp., Fusarium sp., Cladosporium sp., Simplicillium sp., Clonostachys sp., Lecanicillium sp., and Streptomyces sp. have antagonistic potential for the management of Colletotrichum sp. and Austropuccinia psidii.

Conclusion. Research is needed to evaluate the inhibitory capacity of these microorganisms, their mechanisms of action, and their synergistic effect on Colletotrichum sp. and A. psidii under in vitro and field conditions in allspice.

Show Figures and/or Tables
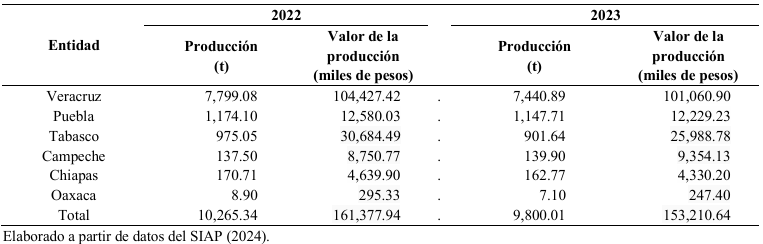
Table 1. Allspice (<em>Pimenta dioica</em>) production in Mexico during 2022 and 2023.
Table 1. Allspice (Pimenta dioica) production in Mexico during 2022 and 2023.
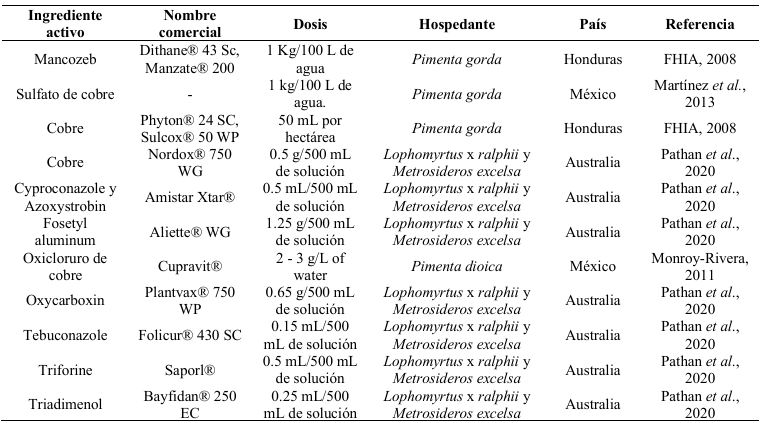
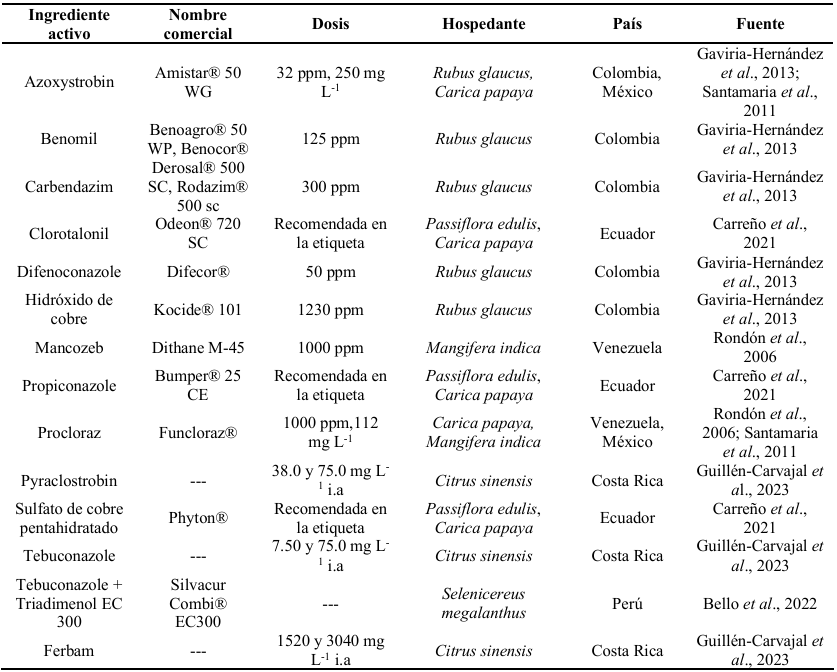
Table 2. Chemical control of <em>Austropuccinia psidii</em> in species of the Myrtaceae family.
Table 2. Chemical control of Austropuccinia psidii in species of the Myrtaceae family.
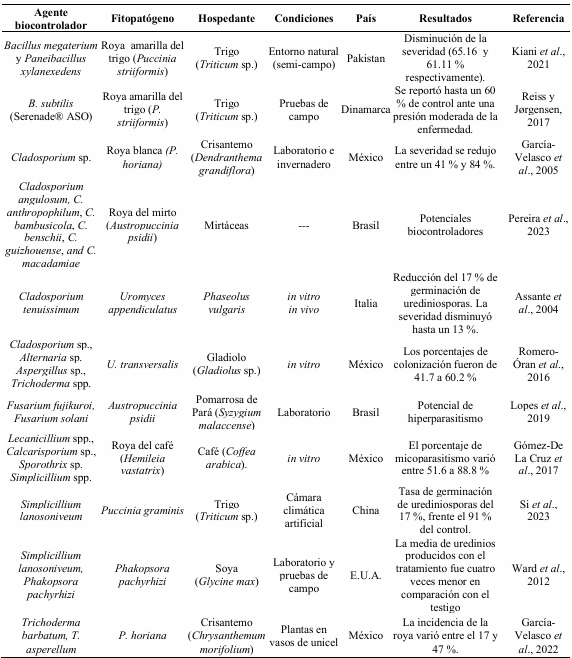
Table 3. Microorganisms reported as antagonists of rusts belonging to the order Pucciniales.
Table 4. Chemical control for the management of <em>Colletotrichum</em> sp. in different hosts.
Table 4. Chemical control for the management of Colletotrichum sp. in different hosts.
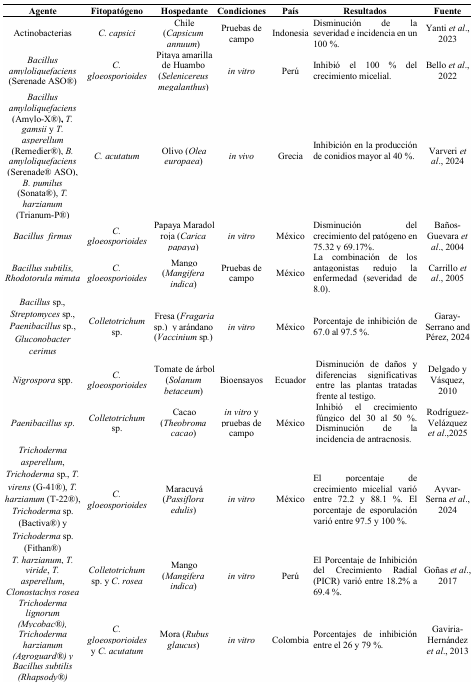
Table 5. Microorganisms reported as antagonists of <em>Colletotrichum</em> sp.
Table 5. Microorganisms reported as antagonists of Colletotrichum sp.
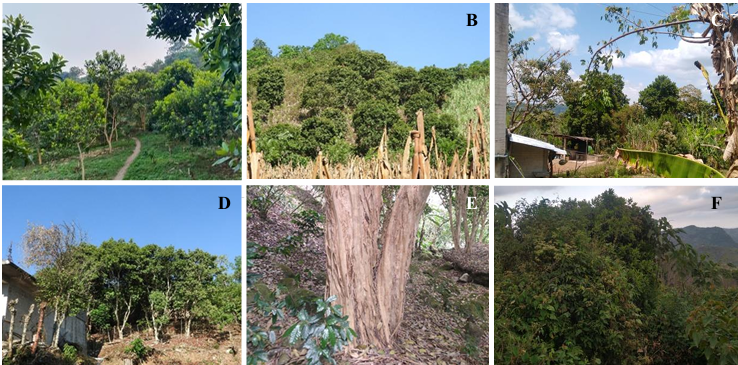
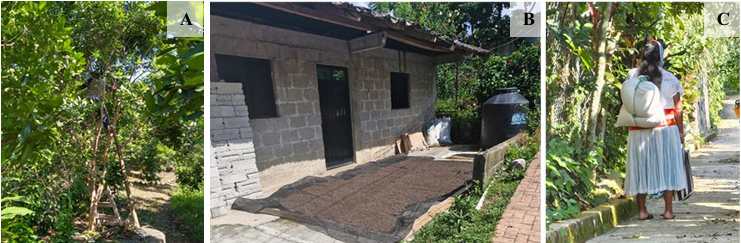
Figure 1. Allspice production systems under traditional Totonac management in Lipuntahuaca, Huehuetla, Puebla. <strong>A</strong>) Monoculture; <strong>B</strong>) Intercropped with corn; <strong>C</strong>) Home garden; <strong>D</strong>) Live fence; <strong>E</strong>) Coffee grown under allspice shade; <strong>F</strong>) <em>Acahual</em> (plant associations in areas originally occupied by tropical forests).
Figure 1. Allspice production systems under traditional Totonac management in Lipuntahuaca, Huehuetla, Puebla. A) Monoculture; B) Intercropped with corn; C) Home garden; D) Live fence; E) Coffee grown under allspice shade; F) Acahual (plant associations in areas originally occupied by tropical forests).
Figure 2. Allspice production in Lipuntahuaca, Huehuetla, Puebla. <strong>A</strong>) Harvesting green fruit from allspice trees; <strong>B</strong>) Sun drying area for dried fruit; <strong>C</strong>) Transport of dried allspice fruit.
Figure 2. Allspice production in Lipuntahuaca, Huehuetla, Puebla. A) Harvesting green fruit from allspice trees; B) Sun drying area for dried fruit; C) Transport of dried allspice fruit.
Figure 3. Symptoms and signs of rust (<em>Austropuccinia psidii</em>) in allspice cultivated in Huehuetla, Puebla, Mexico. <strong>A</strong> and <strong>B</strong>) Presence of rust on young leaves; <strong>C</strong> and <strong>D</strong>) Pustules on the upper side of the leaf; <strong>E</strong>) Pustules on the underside of the leaf; <strong>F</strong>) Pustules on the stem; <strong>G</strong>) Presence of rust on flower buds; <strong>H</strong>) View of flower buds infected with rust; <strong>I</strong>) Necrosis and drop of flower buds caused by rust.
Figure 3. Symptoms and signs of rust (Austropuccinia psidii) in allspice cultivated in Huehuetla, Puebla, Mexico. A and B) Presence of rust on young leaves; C and D) Pustules on the upper side of the leaf; E) Pustules on the underside of the leaf; F) Pustules on the stem; G) Presence of rust on flower buds; H) View of flower buds infected with rust; I) Necrosis and drop of flower buds caused by rust.
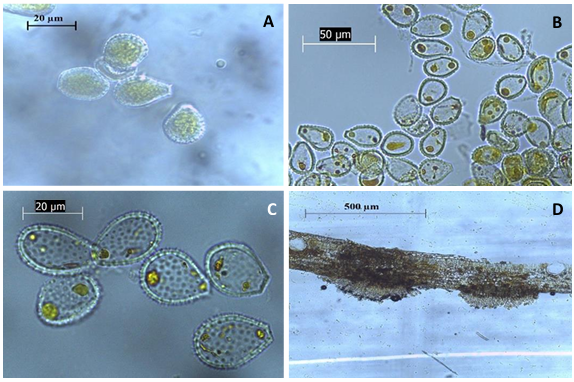
Figure 4. Uredinia and urediniospores of rust (<em>Austropuccinia psidii</em>) obtained from plant samples collected in Huehuetla, Puebla. <strong>A</strong>–<strong>C</strong>) Visualization of echinulate urediniospores with a truncated base; <strong>D</strong>) Visualization of uredinia in a cross-section of an allspice leaf.
Figure 4. Uredinia and urediniospores of rust (Austropuccinia psidii) obtained from plant samples collected in Huehuetla, Puebla. A–C) Visualization of echinulate urediniospores with a truncated base; D) Visualization of uredinia in a cross-section of an allspice leaf.
Figure 5. Symptoms of anthracnose on allspice fruits collected in Veracruz, Mexico. Source: Velázquez-Silva <em>et al</em>. (2018).
Figure 5. Symptoms of anthracnose on allspice fruits collected in Veracruz, Mexico. Source: Velázquez-Silva et al. (2018).
  • Vol. 2025, 43(3)
  • Phytopathological Note

In vitro antifungal activity and phytochemical characterization of aqueous extracts from Datura discolor

byDiana Angelina Urias Lugo, Gabriela López Angulo, Octavio Ernesto Martínez Ereva, Sylvia Paz Díaz Camacho, Carlos Ramiro Ibarra Sarmiento, Luis Gerardo Sarmiento López, Laura Aracely Contreras Angulo, Guadalupe Arlene Mora Romero*

Received: 28/February/2025 – Published: 22/July/2025
DOI: https://doi.org/10.18781/R.MEX.FIT.2502-2

Abstract Background/Objective. Sclerotium rolfsii and Sclerotinia sclerotiorum are phytopathogenic fungi of agricultural significance. The use of phytoextracts with antifungal properties offers an alternative approach to reduce agrochemical applications in pathogen management. This study reports the phytochemical characterization of Datura discolor aqueous extracts obtained by infusion and High-Pressure Processing (HPP), as well as their antifungal evaluation.

Materials and Methods. Aqueous extracts from the root, stem, seed, and leaf of Datura discolor (2, 4, and 6 % w/v) were obtained by infusion HPP. Phytochemical analysis was conducted through screening tests and quantification of total metabolites using colorimetric assays. The antifungal activity of the extracts obtained by infusion was determined based on the in vitro inhibition percentage of the pathogens.

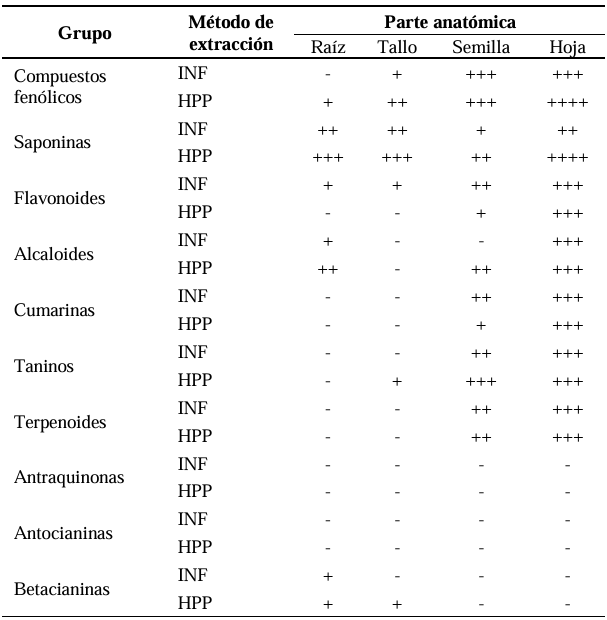
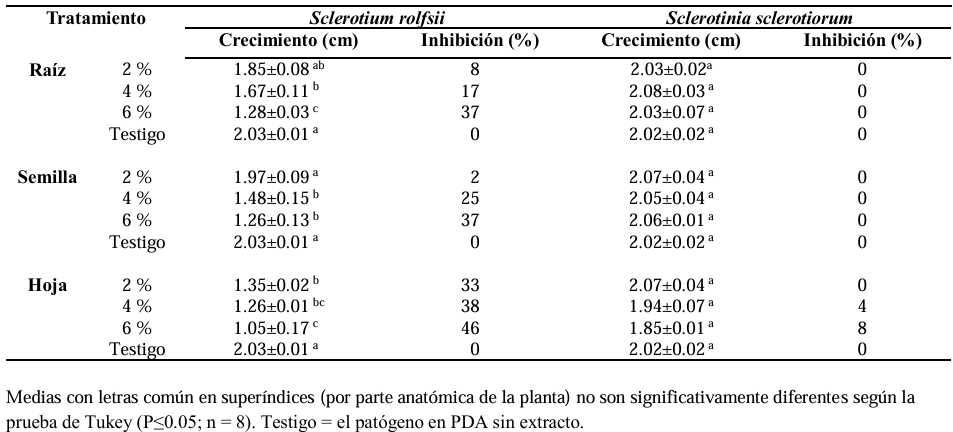
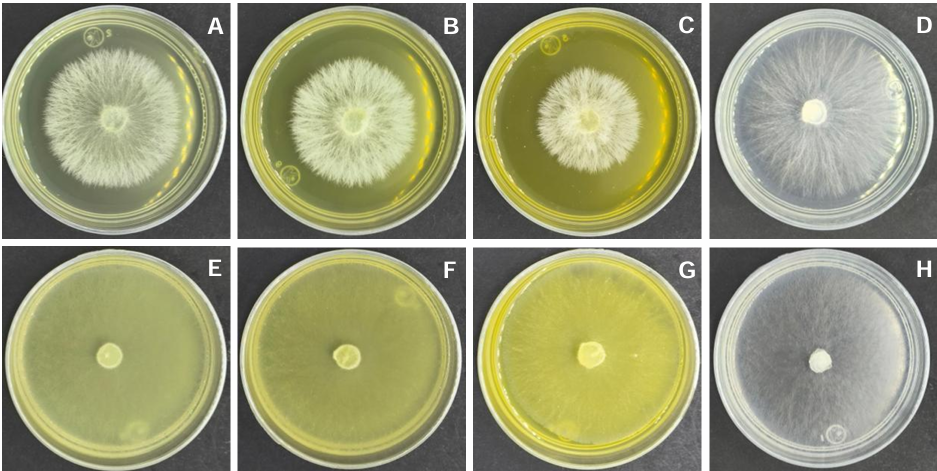
Results. Total phenolics and saponins content in root, stem, and leaf was higher in extracts obtained by HPP, whereas infusion showed greater values in the seed. Flavonoids were observed only in leaf extracts obtained by HPP. Alkaloid content was similar both infusion and HPP extracts. Phenols, saponins, flavonoids, alkaloids, tannins, terpenoids, coumarins, and betacyanins were detected, while anthraquinones and anthocyanins were not. The extracts inhibited Sclerotium rolfsii by 2 to 46 % but showed no effect on Sclerotinia sclerotiorum.

Conclusion. The results indicate that phenolic compounds and flavonoids contribute to the antifungal activity against the evaluated phytopathogens; the involvement of other non-analyzed compounds cannot be ruled out. Further studies under greenhouse conditions are required, applying the extracts either as foliar spray or soil treatment.

Show Figures and/or Tables
Table 1. Detection of phytochemical compounds from 6 % aqueous <em>Datura discolor</em> leaf extracts obtained by infusion (INF) and by high-pressure processing (HPP).
Table 1. Detection of phytochemical compounds from 6 % aqueous Datura discolor leaf extracts obtained by infusion (INF) and by high-pressure processing (HPP).
Table 2. <em>In vitro</em> inhibition of the mycelial growth of <em>Sclerotium rolfsii</em> and <em>Sclerotinia sclerotiorum</em>. The treatments shown are with aqueous <em>Datura discolor</em> extracts obtained by infusion.
Table 2. In vitro inhibition of the mycelial growth of Sclerotium rolfsii and Sclerotinia sclerotiorum. The treatments shown are with aqueous Datura discolor extracts obtained by infusion.
Figure 1. Quantification of phytochemical compounds from 6 % aqueous <em>Datura discolor</em> leaf extracts obtained by high-pressure processing (HPP) and infusion (INF). Gallic acid equivalents (EAG), Diosgenin equivalents (ED), Quercetin equivalents (EQ), Atropine equivalents (EA).
Figure 1. Quantification of phytochemical compounds from 6 % aqueous Datura discolor leaf extracts obtained by high-pressure processing (HPP) and infusion (INF). Gallic acid equivalents (EAG), Diosgenin equivalents (ED), Quercetin equivalents (EQ), Atropine equivalents (EA).
Figure 2. Effect of an aqueous <em>Datura discolor</em> leaf extract obtained by infusion. <em>Datura discolor</em> (2, 4 and 6 %) and Control, respectively. <strong>A</strong>-<strong>D </strong><em>Sclerotium rolfsii</em>, <strong>E</strong>-<strong>H </strong><em>Sclerotinia sclerotiorum</em>.
Figure 2. Effect of an aqueous Datura discolor leaf extract obtained by infusion. Datura discolor (2, 4 and 6 %) and Control, respectively. A-D Sclerotium rolfsii, E-H Sclerotinia sclerotiorum.
  • Vol. 2025, 43(3)
  • Scientific Article

Fatty acid composition of lipopeptides with antifungal activity synthesized by Bacillus amyloliquefaciens

byNancy Ley López, José Basilio Heredia, Isabel Cruz Lachica, Isidro Márquez Zequera, Raymundo Medina López, Cesar San Martín Hernández, Raymundo Saúl García Estrada*

Received: 14/May/2025 – Published: 18/July/2025
DOI: https://doi.org/10.18781/R.MEX.FIT.2503-1

Abstract Background/Objective. Some Bacillus species synthesize biologically active lipopeptides containing fatty acids of varying length. Fatty acid composition is key to their potential activity as surfactants. The objective was to determine the composition and quantification of fatty acids in the structures of lipopeptides synthesized by Bacillus amyloliquefaciens KX953161.1 and to observe the effect of lipopeptides on the mycelial growth of Fusarium oxysporum MG557870 and Sclerotium rolfsii OM510466.

Materials and Methods. The lipid profile of the extract with lipopeptides synthesized by B. amyloliquefaciens KX953161.1 was performed by gas chromatography with a flame ionization detector (GC-FID). The quantification of the detected fatty acids was performed using the area standardization method, and the fat determination was carried out using the 920.39 AOAC method. In addition, scanning electron microscopy (SEM) was used to observe the inhibitory effect of lipopeptides on the mycelial growth of F. oxysporum MG557870 and S. rolfsii OM510466. The data obtained (determination of fatty acids and MIC) were analyzed by analysis of variance (ANOVA), and the comparison of means was performed using the Tukey test (p≤0.05).

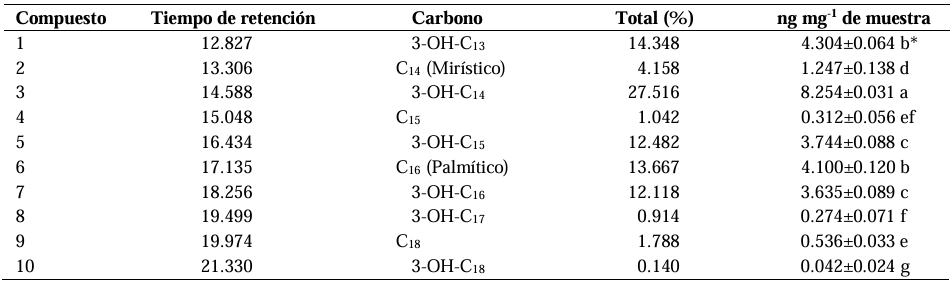
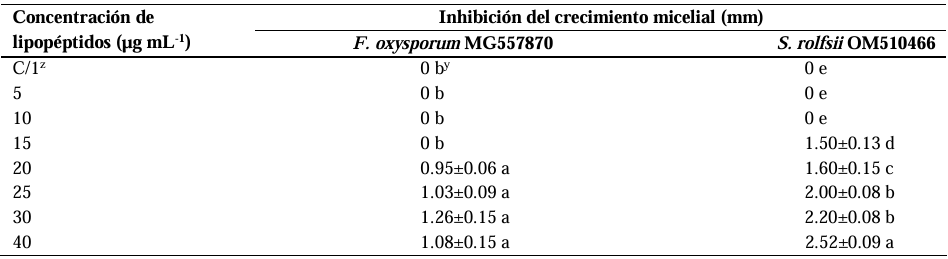
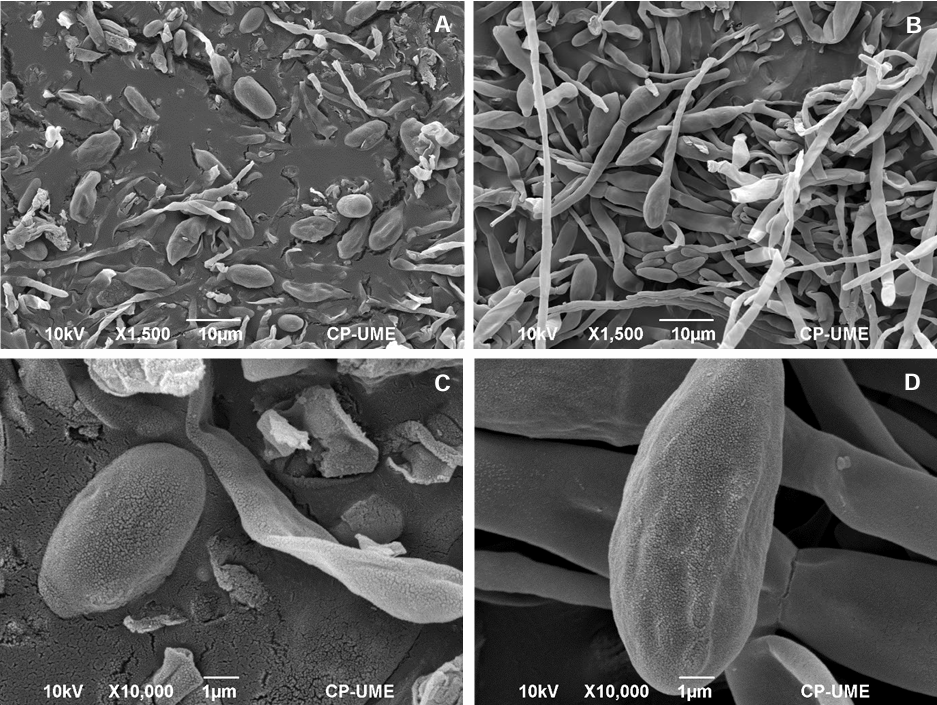
Results. Variability was observed in C13 to C18 β-hydroxylated fatty acids. The C14 β hydroxylated fatty acid (tetradecanoic acid) had the highest content, with 8.254 ± 0.031 ng mg-1 of sample, followed by the C13 β-hydroxylated fatty acids (tridecanoic acid) and C16 fatty acids (palmitic acid), with 4.304 ± 0.064 and 4.100 ± 0.120 ng mg-1, respectively. The minimum inhibitory concentration (MIC) of the lipopeptides on F. oxysporum MG557870 and S. rolfsii OM510466 was 20 and 15 µg mL-1. Damage to fungal cells was evident in their structure and morphology.

Conclusion. Lipopeptide synthesis by B. amyloliquefaciens KX953161.1 exhibits variation in the length of the fatty acid chains, which are primarily composed of C14 (tetradecanoic) fatty acids. This variability could be related to the biological activity of the lipopeptides, and the C14 (tetradecanoic) fatty acid could be important in their antagonism against phytopathogenic fungi.

Show Figures and/or Tables
Table 1. Conditions of injection by Gas Chromatography (GC).
Table 2. Profile of fatty acids of the lipopeptides biosynthesized by <em>Bacillus amyloliquefaciens</em> KX953161.1, identified using GC -MS.
Table 2. Profile of fatty acids of the lipopeptides biosynthesized by Bacillus amyloliquefaciens KX953161.1, identified using GC -MS.
Table 3. Antifungal effect of the lipopeptides synthesized by <em>B. amyloliquefaciens</em> KX953161.1 with the CMI on the mycelial growth of <em>F. oxysporum</em> MG557870 and <em>S. rolfsii</em> OM510466.
Table 3. Antifungal effect of the lipopeptides synthesized by B. amyloliquefaciens KX953161.1 with the CMI on the mycelial growth of F. oxysporum MG557870 and S. rolfsii OM510466.
Figure 1. Chromatogram of the lipid profile of the lipopeptides synthesized by <em>Bacillus amyloliquefaciens</em> KX953161.1, analyzed by CG-MS.
Figure 1. Chromatogram of the lipid profile of the lipopeptides synthesized by Bacillus amyloliquefaciens KX953161.1, analyzed by CG-MS.
Figure 2. Mass spectrum of fatty acid C<sub>14</sub> (Tetradecanoic) of the extract with lipopeptides synthesized by <em>B. amyloliquefaciens</em> KX953161.1.
Figure 2. Mass spectrum of fatty acid C14 (Tetradecanoic) of the extract with lipopeptides synthesized by B. amyloliquefaciens KX953161.1.
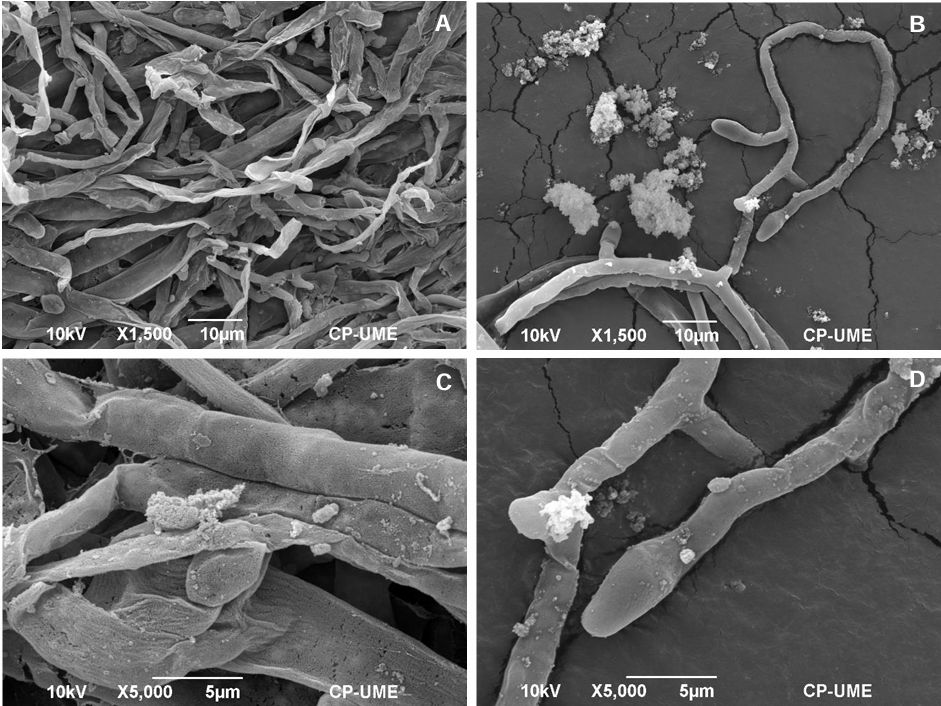
Figure 3. Micrographs (MEB) of spores and hyphae from <em>Fusarium oxysporum</em> MG557870 after the treatment with lipopeptides synthesized by <em>Bacillus amyloliquefaciens</em> KX953161.1. A and C: spores and hyphae treated with lipopeptides (1,500x, bar= 10 µm and 10,000x, bar= 1 µm, respectively); B and D: spores and hyphae without lipopeptides (1,500x, bar= 10 µm y 10,000x, bar= 1 µm, respectively).
Figure 3. Micrographs (MEB) of spores and hyphae from Fusarium oxysporum MG557870 after the treatment with lipopeptides synthesized by Bacillus amyloliquefaciens KX953161.1. A and C: spores and hyphae treated with lipopeptides (1,500x, bar= 10 µm and 10,000x, bar= 1 µm, respectively); B and D: spores and hyphae without lipopeptides (1,500x, bar= 10 µm y 10,000x, bar= 1 µm, respectively).
Figure 4. Micrographs (MEB) of mycelia from <em>Sclerotium rolfsii</em> OM510466 after the treatment with lipopeptides synthesized by <em>Bacillus amyloliquefaciens</em> KX953161.1. A and C: mycelia treated with lipopeptides (1,500x, bar= 10 µm and 5,000x, bar= 5 µm, respectively); B y D: micelium without lipopeptides (1,500x, bar= 10 µm y 5,000x, bar= 5 µm, respectively).
Figure 4. Micrographs (MEB) of mycelia from Sclerotium rolfsii OM510466 after the treatment with lipopeptides synthesized by Bacillus amyloliquefaciens KX953161.1. A and C: mycelia treated with lipopeptides (1,500x, bar= 10 µm and 5,000x, bar= 5 µm, respectively); B y D: micelium without lipopeptides (1,500x, bar= 10 µm y 5,000x, bar= 5 µm, respectively).
  • Vol. 2025, 43(3)
  • Phytopathological Report

First report of Orthotospovirus impatiensnecromaculae infecting lettuce (Lactuca sativa) in Guanajuato, Mexico

byMaría de los Ángeles Mora Ugalde, Jesús Serrano Castillejos, Alfredo Diaz Lara*

Received: 26/March/2025 – Published: 16/July/2025
DOI: https://doi.org/10.18781/R.MEX.FIT.2503-3

Abstract Background/Objective. Determine the presence of Orthotospovirus impatiensnecromaculae (Impatiens necrotic spot virus, INSV) in lettuce crops in Guanajuato, Mexico.

Materials and Methods. Symptomatic lettuce samples were collected from a commercial field in Guanajuato, Mexico, in May 2024. The detection and identification in 12 individual samples was performed with INSV ImmunoStrips and reverse transcription-PCR (RT-PCR) and corroborated by Sanger sequencing.

Results. Ten of the 12 lettuce samples tested positive for O. impatiensnecromaculae by ImmunoStrips. The identity of the virus was confirmed through RT-PCR and Sanger sequencing (GenBank: PQ151798).

Conclusion. The presence of INSV in lettuce crops from Guanajuato, Mexico highlights the need for continuous monitoring and implementation of integrated disease management strategies to mitigate the spread and impact in this region.

Show Figures and/or Tables
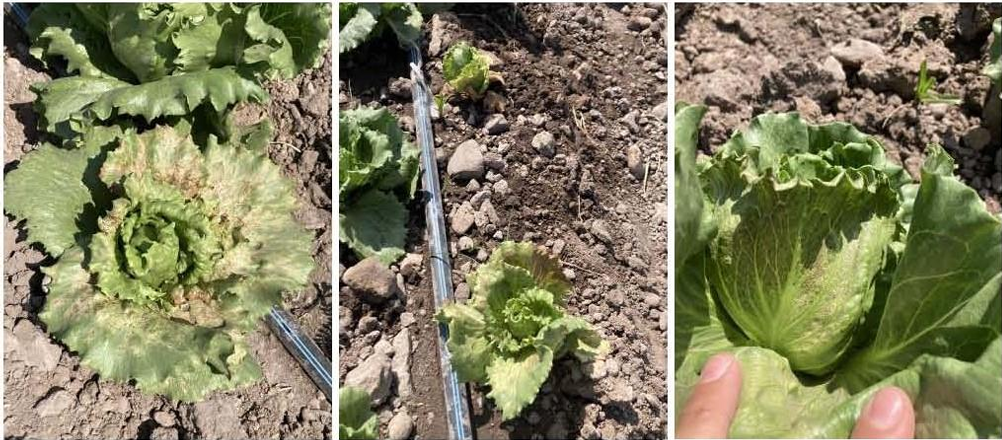
Figure 1. Symptomatic lettuce plants infected by <em>Orthotospovirus impatiensnecromaculae</em> observed during the field survey.
Figure 1. Symptomatic lettuce plants infected by Orthotospovirus impatiensnecromaculae observed during the field survey.
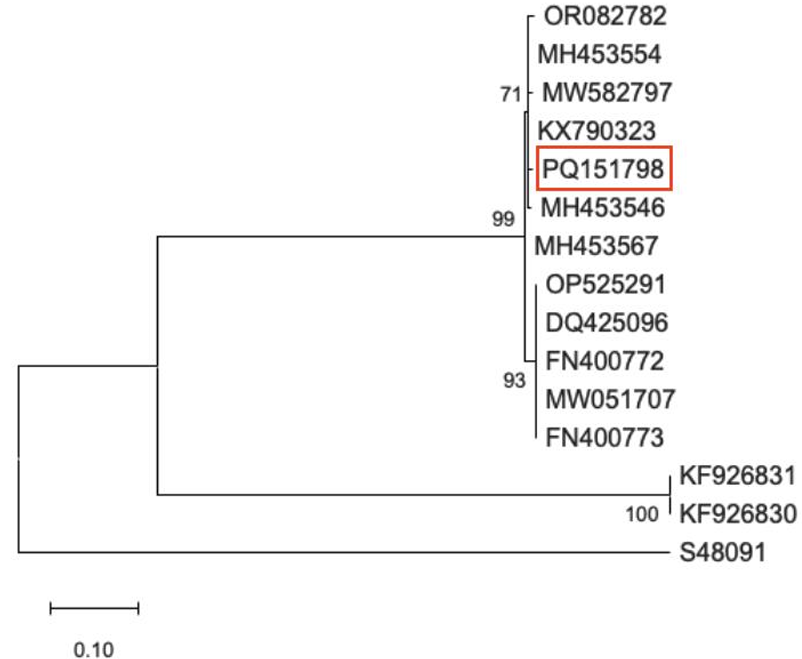
Figure 2. Maximum-likelihood phylogenetic tree of <em>Orthotospovirus impatiensnecromaculae</em> (Impatiens necrotic spot virus, INSV) isolates available in GenBank. Sequence generated during this study is indicated with red color. GenBank: S48091 corresponds to <em>Orthotospovirus tomatomaculae</em> (tomato spotted wilt virus, TSWV) and is included in the phylogenetic analysis as outgroup.
Figure 2. Maximum-likelihood phylogenetic tree of Orthotospovirus impatiensnecromaculae (Impatiens necrotic spot virus, INSV) isolates available in GenBank. Sequence generated during this study is indicated with red color. GenBank: S48091 corresponds to Orthotospovirus tomatomaculae (tomato spotted wilt virus, TSWV) and is included in the phylogenetic analysis as outgroup.
  • Vol. 2025, 43(3)
  • Scientific Article

Histopathology of Peronospora tabacina in tobacco

byYadira Margarita Ramos Barraza, Isabel Cruz Lachica, Juan Manuel Tovar Pedraza, José Benigno Valdez Torres, Raymundo Saúl García Estrada*

Received: 28/February/2025 – Published: 10/July/2025
DOI: https://doi.org/10.18781/R.MEX.FIT.2412-00

Abstract Background/Objective. Peronospora tabacina is an oomycete that causes blue mold in tobacco. Little is currently known about the pathogenicity of this pathogen, as available studies have focused on general aspects of the infection, and detailed histological analyses are scarce. Therefore, the objective of this study was to describe the histological changes that occur during P. tabacina infection in artificially inoculated tobacco plants.

Materials and Methods. The infection process was analyzed by differential tissue staining with safranin-fast green in inoculated plants under greenhouse conditions. Tissue sections were made at 2, 4, 6, 9, 12, 18, 20, 24, 30, 36, 48, 60, 72, 96, 120, 148, 172, 196, and 220 hours after inoculation (hai).

Results. The presence of sporangiospores attached to the leaf cuticle was observed between 2 and 48 hai, which germinated from 96 hai. The pathogen penetrated the leaves directly through appressoria at 96 hai. The first infectious hyphae emerged from 96-120 hai, and between 168 and 192 hai, intracellular hyphae developed and colonized the interior of the tissues, causing cell collapse in the lacunar and chlorophyll parenchyma, as well as structural alterations in vascular bundles and epidermal cells. The pathogen completed its infection cycle by producing oospores and sporangia at 192 hai and is considered a source of inoculum for the infection of new tissues.

Conclusion. Peronospora tabacina is capable of directly penetrating tobacco leaf tissue through appressoria and developing a progressive infection both intercellularly and intracellularly, with severe alterations in leaf anatomy and completion of the cycle with the production of reproductive structures in a short period, reinforcing its potential as an aggressive pathogen under favorable conditions.

Show Figures and/or Tables
Figure 1. Stages of the <em>Peronospora tabacina</em> infection process in artificially inoculated tobacco leaves. A) Transversal section of a healthy leaf displaying the abaxial (EAb) and adaxial (EAd) epidermis and stomata (St). B) Longitudinal section of a healthy leaf displaying the epidermis (Ep), vascular bundles (Hv) and palisade parenchyma (Pe). C) Longitudinal section 24 hai with sporangia (Es) in the trichome base. D) Longitudinal section 48 hai with sporangia in the epidermis. Bar = 40 µm.
Figure 1. Stages of the Peronospora tabacina infection process in artificially inoculated tobacco leaves. A) Transversal section of a healthy leaf displaying the abaxial (EAb) and adaxial (EAd) epidermis and stomata (St). B) Longitudinal section of a healthy leaf displaying the epidermis (Ep), vascular bundles (Hv) and palisade parenchyma (Pe). C) Longitudinal section 24 hai with sporangia (Es) in the trichome base. D) Longitudinal section 48 hai with sporangia in the epidermis. Bar = 40 µm.
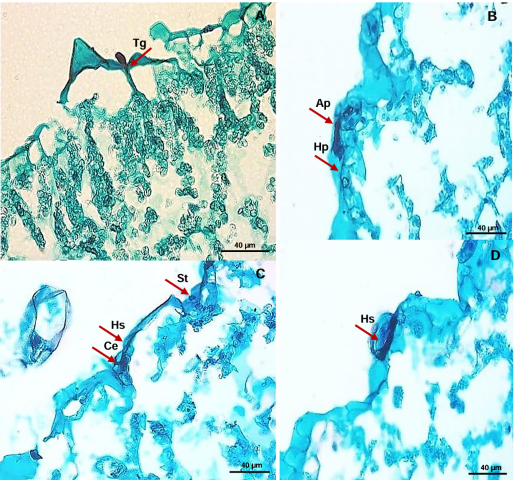
Figure 2. Development of infectious <em>Peronospora tabacin</em>a structures in tobacco leaves. A) Germinative tube (Tg) emerging from the sporangium at 96 hai. B) Penetration hyphae (Hp) emerging from the appressorium (Ap) at 96 hai. C) Secondary hyphae (Hs) intracellularly invading epidermal cells (Ce) 96 hai. D) Infection hyphae (Hi) emerging from the appressorium and invading tissues at 120 hai. Barra = 40 µm.
Figure 2. Development of infectious Peronospora tabacina structures in tobacco leaves. A) Germinative tube (Tg) emerging from the sporangium at 96 hai. B) Penetration hyphae (Hp) emerging from the appressorium (Ap) at 96 hai. C) Secondary hyphae (Hs) intracellularly invading epidermal cells (Ce) 96 hai. D) Infection hyphae (Hi) emerging from the appressorium and invading tissues at 120 hai. Barra = 40 µm.
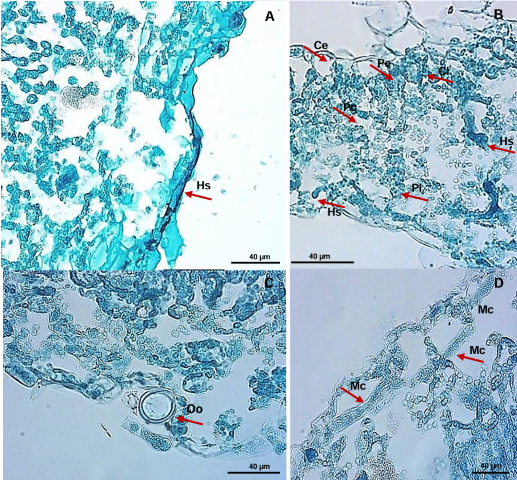
Figure 3. Advanced invasion of <em>Peronospora tabacina</em> on tobacco feal tissue. A) Secondary hyphae (Hs) invading intracellularly at 120 hai. B) Coenocytic hyphae growing intracellularly at 192 hai, causing cellular disorganization, and destroying spongy parenchyma (Pl), chlorenchyma (Pc) and chloroplasts (Cl). C) Formation of oospores (Oo) at 192 hai. D) Coenocytic mycelia (Mc) causing cell disorganization and destruction of tissues at 192 hai.
Figure 3. Advanced invasion of Peronospora tabacina on tobacco feal tissue. A) Secondary hyphae (Hs) invading intracellularly at 120 hai. B) Coenocytic hyphae growing intracellularly at 192 hai, causing cellular disorganization, and destroying spongy parenchyma (Pl), chlorenchyma (Pc) and chloroplasts (Cl). C) Formation of oospores (Oo) at 192 hai. D) Coenocytic mycelia (Mc) causing cell disorganization and destruction of tissues at 192 hai.
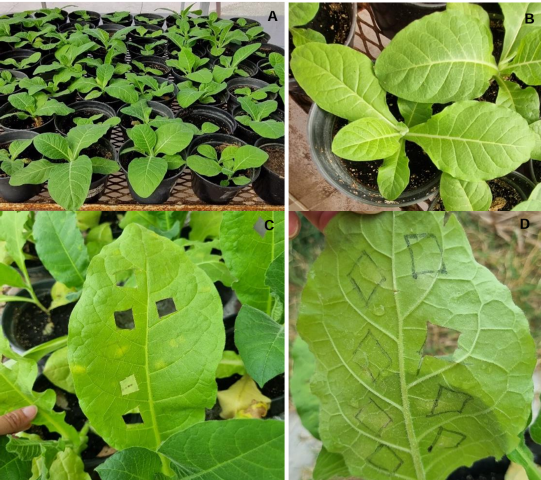
Figure 4. Foliar symptoms caused by <em>Peronospora tabacina</em> (Pt1SA isolation) in tobacco. A) Healthy plants used for inoculations. B) Control plants, not inoculated. C) and D) Leaves with symptoms on the adaxial and abaxial surfaces from 168 hai.
Figure 4. Foliar symptoms caused by Peronospora tabacina (Pt1SA isolation) in tobacco. A) Healthy plants used for inoculations. B) Control plants, not inoculated. C) and D) Leaves with symptoms on the adaxial and abaxial surfaces from 168 hai.
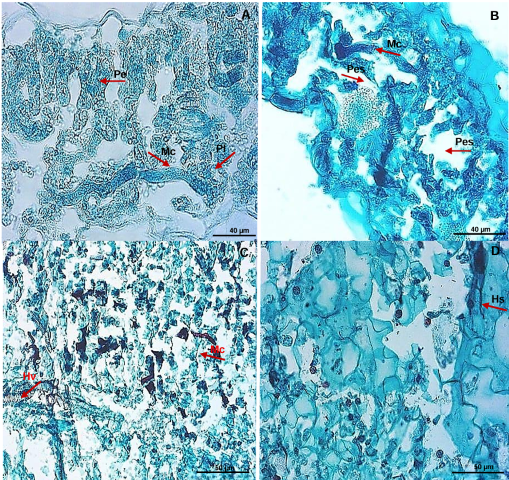
Figure 5. Longitudinal sections of the tobacco leaf at 192 hai and 216 hai displaying colonization of the foliar mesophyll by <em>Peronospora tabacina</em>. A) Coenocytic mycelium (Mc) invading the tissues of the palisade parenchyma (Pe) and the spongy parenchyma (Pl). B) Intercellular hyphae in the spongy parenchyma (Pes). C) Distribution of coenocytic mycelium in the leaf mesophyll. D) Accumulation of secondary hyphae (Hs) in intercellular spaces.
Figure 5. Longitudinal sections of the tobacco leaf at 192 hai and 216 hai displaying colonization of the foliar mesophyll by Peronospora tabacina. A) Coenocytic mycelium (Mc) invading the tissues of the palisade parenchyma (Pe) and the spongy parenchyma (Pl). B) Intercellular hyphae in the spongy parenchyma (Pes). C) Distribution of coenocytic mycelium in the leaf mesophyll. D) Accumulation of secondary hyphae (Hs) in intercellular spaces.

Page 6 of 16